
This is a list of the National Register of Historic Places listings in Lauderdale County, Alabama.
This is intended to be a complete list of the properties and districts on the National Register of Historic Places in Lauderdale County, Alabama, United States. Latitude and longitude coordinates are provided for many National Register properties and districts; these locations may be seen together in an online map.[1]
There are 33 properties and districts listed on the National Register in the county, including 1 National Historic Landmark.
This National Park Service list is complete through NPS recent listings posted April 12, 2024.[2]
YouTube Encyclopedic
-
1/1Views:5 956
-
John ENGLANDER 2/4/15 Melting Ice, Rising Seas, Shifting Shorelines: The New Reality
Transcription
It's great to be back at Harbor Branch. I've visited here a number of times over the years. I last spoke here 23 years ago I think it was. So if you don't remember that I understand. And one of the research submersibles that I got to go down and look at ancient shorelines - I'll talk about that - was one of the submersibles from Harbor Branch years ago, the Clelia, when it was over in the Bahamas, where I lived for about 25 years. But in the last 6 years I've become a specialist about sea level. I stumbled into it in a way but have a deep background in it, in a true way in that, in college, 45 years ago - I was a Marine Geology major - I studied ancient sea levels because I thought it was really fascinating how they went up-and-down with the Ice Ages and, as a diver, when I got to go diving in The Bahamas, either scuba diving or in the research sub like the one from Harbor Branch I would look for ancient shorelines evidence when sea level was down much lower and I'll talk about that so my connections about that subject go back to my college studies and actually to one of the research trips done with Harbor Branch's facility so a kind of an interesting connection. I explain sea-level rise now not only all over the country but all over the world. I was in San Francisco last week. They have a big issue there. I'll show you some images. I did it to the government of Hong Kong about 2 months ago, the Miami Chamber of Commerce a month ago, Newport, Rhode Island, National Trust for Historic Preservation, looking at old buildings and what-do-we-have-to-do, federal agencies from Coast Guard to Homeland Security. As you'll see I take a very diverse set of sciences then, as alluded to, and cut across it, and look at a longer-term picture and I guarantee you some of the things you learn tonight will be new. They may displace other things you've heard about sea level. There'll be time for questions at the end. I love questions. I've not been stumped yet in 2.5 years of doing this so try it, it's fine. And I love talking to different audiences because people come at sea level with different concerns. Here in Florida we tend to think we're at Ground Zero and there certainly is a real vulnerability here but lots of places in the world are special in terms of their vulnerability to sea-level rise, not just here. The first misunderstanding that happens with looking at sea level is when we look at the polar icecap, the ice around the North Pole, like these images, most people think that that's why sea level's rising. I'm not going to embarrass anybody here tonight to find out which side of that question you're on but let me make it easy. I would say that 90 percent of the people across audiences that I talk to assume that the melting polar icecap is why sea level is rising. It's not. Like ice cubes in a glass, as they melt, they don't affect the level of liquid. It seems perhaps surprising but if you think about it, it's true, and you can run that experiment at home with iced tea or gin-and-tonic, whatever you wish and you'll probably want a gin-and-tonic by the time you're done listening to me tonight. [Laughter] I try and inject a little humor because this is a really sobering subject. It can be scary and that's just the facts. And some things in life are. I'm going to try and give it you. There's no politics involved and really there's no agenda. It's to let you see a new world that's different than what we tend to think about with storms and other events that are in our experience and it's really hard to see ahead to sea-level rise but I'm going to bring you there. You're going to see what's going to happen later this century in a way that I'm sure you've never looked at it before. Very few scientists have because most of us look at specific things and this is going to be a very holistic view. The importance of the disappearance of the polar icecap -- that is the ice around the North Pole, not Greenland and not Antarctica, which we'll get to in a minute -- is 2 things. As we go from bright-white ice, which reflects sunlight and heat to dark, polar ocean, which absorbs it, it's like having a white roof and then painting it black. Your house is going to get warmer, right? Your heating and your air conditioning will change. We know that. It's intuitive and I'm going to explain science just that simply not that you need it dumbed down to that level but I want to give you explanations that you can use on anybody. That's my goal. It's to make the science so clear you really don't need to understand science. The second importance besides the Arctic going from a reflecting surface to an absorbing surface, which accelerates the warming as the planet absorbs more heat, as the ice melts, even though it doesn't affect sea level. The real other significance of the melting Arctic, the disappearing polar icecap around the North Pole, is that it proves warming. You know, when I talk about sea-level rise or climate change, however you want to look at it, some people say, "Oh, well this has happened before. It's a natural thing." The polar icecap's been there for 3 million years. It's going to be gone starting for a few weeks in September and then increasing in periods of time in successive years in the next couple of decades. There are people already investing hundreds of millions of dollars in shipping ports in the Arctic so that when ships, during the ice-free months can go across the pole and save tremendous distances shipping that there will be ports ready on the northern side of Canada and Russia. This isn't make-believe stuff; this is real business and really happening. The Coast Guard for which I'm an advisor on this subject is trying to get ready for when they'll need to do more work as the Coast Guard and the Navy up in the Arctic when there's more shipping up there. But the fact that pole has been frozen for 3 million years really should give us pause. This is not just another natural cycle. The Arctic has not been ice-free in 3 million years. This isn't a matter of instruments and accuracy and where the gauges are. Ice melts at 32 degrees whether you're a Republican or Democrat. It doesn't care what you think, right? It's a visual thermometer. If you warm the planet enough and let enough years go by the ice will melt, and when people say it's happened before, they have no idea of timescale. You will know that by the end of this evening. You will have the arguments about the Ice Ages to really pull the rug out from underneath anybody who tries to tell you that, "Oh, well this is just a natural cycle. It's happened before; it's going to happen again.", and so on. You'll see the reality. I have done this for 2.5 years since my book was published and people have tried to challenge - wanted to challenge - facts and it hasn't happened. I have an impeccable record. I didn't think this would happen. I really am sure that some deniers or some people with financial interests contrary or political beliefs that just didn't want them to accept this would find some argument that I have missed. It hasn't happened. Law firms have really done searches and there is no refuting any fact in my book or point in my position or my presentations. I've been on the FOX Business Channel put up against one of the big paid climate deniers, Dr. Patrick Michaels. These arguments really up is the point. You can decide for yourself but I can assure you that lots of people have tried to find holes in it and it really is a very solid case. Well, let's start with the basics about sea level. We tend to take it for granted but to help you visualize it, the bottom line and this simple image sea level, think of it as low-tide, and we know that tides move up-and-down daily, right? And then when we get a storm - that's a storm, that's a storm surge and if the storm hits at a high tide it's even higher, right? That all makes sense. As the different causes of water rising stack up, the waves are going to go further inland, right? Obvious. What we don't tend to think of is that because sea level is largely caused by the melting of ice on land, which I'll talk about in a moment that you can't reverse the process quickly so the timeframes are very different. High tide - extreme high tide events - dissipate in hours. Storm surge, even from a Sandy-like event, dissipates hours or days at most. Sea level cannot go down for over 1,000 years no matter what we do. I'll show you why with the ice sheets in a moment but it's just to put it in a framework that we tend to want to think that all flooding is the same or all ocean rise is the same and they're not and you'll understand that shortly. As venerable sources, National Geographic Magazine in September, 2013, put sea-level rise on its cover. The point of their cover was that when all the ice melts that's how high sea level will be on the Statue of Liberty, 212 feet above sea level. That's not an opinion. It's a pretty simple calculation of the amount of ice that's on land. It's the opening sentence of my book, too: When all the ice melts, sea level will be 212 feet higher. Now that's not going to happen this century. It won't happen next century. I'm not here to scare you. In fact quite the opposite: I want you to understand reality and simple physics that anybody can understand and hype and myth and so on. That's my goal this evening. The reason we're confused about sea level is it hasn't changed much in 5,000 years as I'm going to illustrate to you. The last time sea level got higher than today - and when I say sea level I mean the low tide, if you will, the base level - was 120,000 years ago at which time it got 25 feet higher than today. We tend not to think about that unless we study geology or climatology or glaciology. So the most common question I get probably is, "Well, how high will it rise in 30 years or 50 years or by the year 2100 or something?" I'm going to tell you up-front we don't know. You're going to see lots of estimates and I'll give you some of the projections that you will see to refresh your memory and then I'm going to make very clear to you we don't know the answer to that question and, let's be honest about why we can't know the answer to that question. It's a little bit like asking, "How many people will the earth have by a given year?" There's too many variables. Now with sea level it largely relates to melting the ice that's on land, the glaciers and ice sheets on Greenland and Antarctica, as we're going to go through in some detail. Well, the amount of ice that melts, it depends on how warm the planet gets. It makes sense, right? How warm the planet gets depends on how we make our energy and how much of it we need in the next 85 years. Now if one of you can tell me exactly how much energy we're going to use in the next 85 years and how we're going to produce it and how many people there will be and how much energy-per-capita they get then you give me all those figures, and I'll tell you how high sea level's going to be but of course you can't possibly know those answers for 85 years. We don't know whether we're going to be pure solar, whether we're going to use nuclear, tar sands or anything else, right? It's all a matter of conjecture, of assumptions. Those things will determine how much sea level rises and even if we knew those things, as I'm going to show you, there are some dynamics in Greenland and Antarctica that, truthfully, we can't precisely calculate how the ice sheets are going to collapse. So unfortunately while people do estimates just like they do population estimates. I mean the current estimate is the 7 billion people on the planet will peak at 9 or 10 billion by the year 2050. There used to projects it'll be 12 billion, okay? It doesn't mean they're incompetent. It means that situations change and our models change. This is the graph that's most commonly used in Florida about sea-level rise. It's done by a group called the Southeast Florida Climate Change Compact. They came out with this about 3 years ago and it's a graph that shows from the present, here - well, 2010, close enough - by 2030 or 2060 and if you can't read it just the grey or the orange arc peaks at the year 2060 at 9-24 inches of sea-level rise. And what this is, it was a very good effort by 4 counties from the Keys - Dade, Broward and Palm Beach County - to say, "Let's work together", and at least have the same guidelines so that one county's not planning on 12 inches and another one's planning on 16, you know for the same problem. And that made sense and, in fact, they kinda set a national example of cooperation in trying to do this with some consistency. Those figures will probably be raised because that's been the pattern of sea-level rise projections, they do keep getting higher. But it's also based upon the same uncertainties I just gave you. It's not absolute. People tend to think, "Well, the worst that could happen is 24 inches by 2060." No, that's the highest example based upon a series of assumptions in that model and the models do keep getting higher, by and large. Now Florida we all know what it looks like. It's a pretty distinctive shape. 20,000 years ago Florida was much larger. Sea level was 390 feet straight down, lower. Florida is essentially twice the size. That was when the ice sheets were at their maximum. We'll look at that, the last Ice Age and glacial maximum, as scientists call it, but let's call it the Ice Age. The other part of the Ice Age cycle when we were at the previous warm spot, 120,000 years ago, sea level got 25 feet higher, as I mentioned and Florida was half the size. This is in the geologic record. This isn't a model. It's not a projection. This is actually very easy to find whether you're looking for stratigraphic layers in the rock or shark's teeth or ancient beaches underwater, this is geologic history. Now one of the other up-front parts here I would like you to think about is we tend to think flooding is all the same. It's not and I want - no matter where I travel I find that there's a tendency - to confuse storms, hurricanes if you will, and the flooding that comes from that, extreme tides, which are more predictable, and we'll talk about that in a moment. Sea-level rise, which gets wrapped in somehow with the first two. Subsidence. As land goes down it effectively makes sea level seem to rise higher if the land is going down - if sea level's here and the land falls it's the same thing as if sea level rises for your piece of property, right? Okay and then runoff from heavy rainfall or downstream flooding from a river or stream and then the sixth one, in brackets, is erosion. Erosion is a little bit different. It's typically scouring because of currents or perhaps storm waves and it's not in the normal sense of inundation like these others but - and so it's worth listing there, differently. Now those causes or those effects of flooding or forms of flooding, I should say, have different things causing them, different predictability. I can tell you when we're getting an extreme tide 5 years in advance. What time, what day and what inlet. We know what extreme tide's going to happen because it's based upon the planetary alignment, the tide tables. Fishermen and boaters know about the tide tables and we know about peak tides, sometimes called king tides. I have no idea when the next storm's going to be, right? And I have an idea about sea-level rise within parameters. Well, these things tend to combine but they really need to be thought of separately because - for the reasons you already understand - sea level's not going to recede so it raises the base elevation. And on top of sea level, we have normal tides and extreme tides and storm sides, right? So sea level keeps lifting everything up and somebody said it's kinda like in basketball if you could keep raising the floor, the point scores would keep increasing, right? So you're raising the base, which has a - can have a big impact. Now we've - storms allow us to see the impact of sea-level rise. This was Fort Lauderdale Beach before the event and this is the no-name storm a month after Sandy, actually, in Fort Lauderdale Beach. I don't know if you saw it. I actually went down there to witness this. Not only did it put the road underwater, it actually eliminated I think 4 blocks of A1A down there in Fort Lauderdale. That's not sea-level rise. That was a storm event. But it helps us to visualize what's going to happen just as Sandy, on October 29, 2012, showed us what happens when a shoreline breaches in a way we didn't expect. This I have to tell you - you may have seen it if you go to my website or things like that or even I think on Amazon they talk about it. This was a terrible event that was very fortunate for me in its timing. When Sandy happened on October 29, 2012, my book came out a week before - October 22 - it was published and, on Page 121, I describe a super storm hitting Atlantic City in New York so I got on British television the next morning, you know? "So Mr. Englander, how did you write about this a week before it happened?" Well, I wrote about it 4 years before. Of course it was just lucky and I hate to call it lucky with such a tragic event but the point is it illustrated that if you get the physics right and the geology, you know some of this stuff's pretty simple. I mean, you can give a forecast or a scenario and, at some point, it's going to happen. The fact that it happened a week later was pretty bizarre but it helped me sell some books so it was okay. I don't mean to be callous about that. It was a terrible event but it should get us to start thinking about what is going to happen. Now we have another kind of flooding event, these extreme tides, and we see that in neighborhoods all over the US and, in fact, all over the world. This could be in Seattle. This happens to be in Broward County, Fort Lauderdale but it could be any one of a number of waterfront communities and storm drains were put in to take excess rainfall and take it to the nearest waterway, right? You're all familiar with that. Well, every 28 days this neighborhood has a problem. Saltwater backs up through that system and comes onto the street. That didn't happen when that community was designed or engineered 50 years ago. And we haven't had real subsidence here, by the way, or not much. The land has not gone down. That's not the cause of this problem. And this could be anywhere. San Francisco: The Embarcadero. Many of you have probably been out there and seen The Embarcadero, the famous 7.5-mile waterfront, in San Francisco. Well, it's been there 140 years. It didn't do this as often, by a long shot. They're now having to figure out how to redesign the waterfront because, every 28 days, water is breaking over the seawall and it's not the ocean. Remember this is inside the Golden Gate Bridge. This is inside San Francisco Bay. Those crashing waves are really very small bay waves that are just high enough because the ocean's higher, at peak tides, which is what they call king tides out there. San Francisco is - from this aerial shot - just is here to point out something that you don't tend to think of because we think Florida is the most vulnerable area. Of course some people would say Bangladesh or Vietnam or The Maldives or various places in the world, Kiribas, there's lots of place that are vulnerable to sea-level rise but we tend not to think of a place like California but San Francisco Bay has huge vulnerability. Those areas in light blue are areas that will go underwater with just a couple of feet of sea-level rise. They were all fill land because the bay - they made land, basically, by filling in 10 or 12 feet of water depth. This was a cheap way to make real estate in a very valuable area and it was protected from the ocean so they were safe. So they made it, eh, 2 feet above sea level. Well, now not only have ports and airports, we have entire cities in the Bay Area - I was there last week - that have been built on fill land that's 2 feet above sea level, as flat as this table. And when sea level gets that high the whole city is going to flood. And it's not just coastal cities. The other interesting thing about sea level, we tend to think it's like a storm that's going to hit the beach. It's not. It's going to go to the low land behind the beach and up tidal rivers. Sacramento, California just as one example but this could be Hartford, Connecticut, it could be Washington, DC, it could be London, England. Cities on tidal rivers are vulnerable to sea-level rise, too, so that's another difference between storm surge, which hits the coast with waves, and seal level, which finds the low land wherever it happens to be. It has a much wider impact area. Not only that, Sacramento is not only on a tidal river, the river basically has been formed, at this point in history, by over 1,000 miles of earth and levies, similar to New Orleans. In fact analysis by various federal agencies says that there's more vulnerability to sea-level rise, breaking the levies in Sacramento than there is New Orleans. And it's not only the capital city of Sacramento, it's the rich, valuable farmland beyond that, which is why the levies were put in there over the last 2 centuries. So sea level really needs to cause - or causes - us to think different. We tend to think of it like a storm or like these extreme tide events but it's really fundamentally different and we're not prepared for it because it hasn't happened in all of human history. So what do we know about sea-level rise? Well, over the last 100 years or so this is a graph showing since 1850 - so 165 years - sea level has risen about 7 or 8 inches and sometimes people question why the blips in the line? That's an interesting scientific question and there are some answers to it but I think you just need to step back and look at the big picture. Pretend this was an investment opportunity, right? You wouldn't care that it blipped up and down if it had that kind of trend to it, would you? You can bet the trend even if it's not going where you want. You know 'the trend is your friend'? Because you can see where it's headed and you actually can get ahead of a trend even if it's going in a direction you don't like. So sea-level rise is not only increasing in a long-term but if you look at this chart very carefully and in the upper-right, the little red line, the straight line, indicates that the rate of increase is steepening or that sea level is rising at a faster and faster rate, decade-by-decade, not year-to-year. It doesn't do that. Now that same 8-inch global average sea-level rise over the last century or so, here is plotted against 13 cities. That same 8-inch line is this little red, squiggly line down here. You can see that, right? Well, here's 13 cities from New Orleans on the left at 46 inches to Norfolk, Virginia, at 30. New York's 14, Miami is 12 and Los Angeles is 4. So why would a global increase of 8 inches of sea-level rise manifest as 46 inches one place, 30, 12, 4? Because of the land subsiding or uplifting. New Orleans is compacting because it's silt and we take oil and water out of the ground and the land is compacting severely. Virginia Beach is a different phenomenon. It's a plate that's tilting. It's a tectonic effect. Los Angeles is being lifted because the Pacific Plate, you've probably seen pictures that, in the Pacific, the ocean plate is going underneath California, which is why they get all the earthquakes out there and that's lifted Los Angeles by 4 inches. So a global sea-level rise at 8 inches looks like 4 inches if you're measuring it from Los Angeles, makes sense? Well, and things you wouldn't think of quickly and the discrepancy of 4 inches to 46 inches does create grounds for confusion or misinformation. This is to step back to almost a million years. I don't know why this graph was cut off at 900,000 but to show you that sea level in the 900,000-year pattern at the top goes up-and-down. There's a fairly regular pattern. I'm going to talk about that but I want you to see the big picture before we zero in. And the last Ice Age cycle is blown up there at the bottom for some detail. But let's focus on the last - since the last Ice Age. Again about 20,000 years ago was the peak of the last Ice Age. At that point as I've already told you sea level was 390 feet lower. There are 2 or 3 interesting facts from this chart. One is that sea level got to pretty much the present level about 5,000 or 6,000 years ago. That happens to be about when we started keeping written records. By most peoples' arguments it was pretty much about our human civilization. Some people might go back 6,000 or 8,000 or so on, depending, but we don't go back much more than that. Organized farming started about 8,000 years ago. There're some cave paintings going back 40,000 years ago but I think a case can be made that civilization as we know it is 5,000 years, more or less, okay? So if sea level hasn't changed much in that 5,000 years no matter we don't think it's going to change much. 14,000 years ago that bump and let's see if I can do it here. There's 2 bumps actually. Scientists call that melt-water pulse 1A, regardless. Sea level rose quickly. About 65 feet in 400 years, by nature, no impact demand. That's in the geologic record. Go to any geology book, online, this isn't a controversial statement. Sea level changes by nature. There was an actual cycle. We just kind of were ignorant of it. The truth is we didn't understand a lot of this until the last century or so when had the ability to kind of put together a more sophisticated case. So that's - now that happened - because of the Ice Ages. You know, if you have kids or grandkids that are the right age, you probably saw the 4-part science series, "Ice Age". This was Part 2, "The Meltdown". My daughter was 6 at the time. I've watched this 30 or 40 times and I pretty much have it memorized. But besides being a good cartoon movie, it's actually pretty close to the big picture of what happened with the ice ages, and I show it both to make people laugh because I've pretty much depressed them by this point and I don't want them to reach for the valium and other things that would take their edge off but it's really just to make a point that that 2 miles of ice that's behind the animals, behind Manny, Sid, Diego, Scat, okay? I do know their names. Behind the animals that 2 miles of ice - call it 10,000 feet. You know, 5,280 is a mile so just round figures. I keep everything round figures, easy-to-remember. 10,000 feet of ice, as it melted, turned into 400 feet of sea-level rise. Makes sense, right? That's about all the science you need to know to understand this stuff. It really doesn't have to be complicated. We don't need to use fancy, complicating terms. Not only for yourselves, some of you are more sophisticated in scientific understanding but when we teach it to others, this is the level to teach it at. I've done this to all sorts of groups all over the world. People walk out of the room understanding it. All the pieces hold together. Another way to visualize it that I like is to say that if - pretend that we're at the 30th floor of a building, with the present-day sea level and that the elevator is sea level. Just 20,000 years ago it was at the ground floor. It rose 30 floors, 390 feet to get to the present and it got here about 5,000 years ago. When all the remaining ice on the planet melts, we don't know when but when it does the sea level will be at the 2 floor of that building, another 17 floors or 212 feet up. I know I'm being repetitious but I'm trying to help you remember a couple of numbers. You don't have to write it down. Now as I started out we tend to first think about the polar region, which I mean the North Pole, not the Antarctic region, which I'll talk about when we think about the warming of the planet, the melting of the ice, the plight of the polar bear and most people assume why sea level's rising. You now understand not. I'm not going to get into the biologic or ecological issues today but certainly the polar bear's got a problem. But, as I prefer to say, you know the planet's changed, species have come and gone and I certainly hope the polar bear survives but we really have a much bigger issue in what's at stake here than the polar bear: Us. Now I'm not talking about imminent extinction or anything like that but the profoundness of what's at stake here is - can't be - overstated. And I think we need to find ways to kind of get through the clutter and the politics and the emotions and - well, it's emotional, certainly, but to really talk about this in a factual way that people get and that's what I have made it my mission to do. Now nonetheless the images of the melting ice is stunning. It's both a - well, of course this isn't the North Pole. This is Antarctica. Most of you know that penguins are not in the Arctic. Polar bears are at North Pole. Penguins are South Pole. There are some of these great images about the ice melting are beautiful, poignant if you will. They tell their own story. Now that's happened before probably but it's happening a lot faster now. As the polar ice melts you've already heard that we go from bright-white to dark-ocean. That's really profound. We're changing the planet's heat reflectance, which is speeding up the warming, in its own positive feedback loop as we tend to call it sometimes. The problem as I've mentioned is the ice on land. Greenland has enough ice presently that if it were all to - no, when it all - melts, whenever it all melts, sea level will be 24 feet higher. Antarctica 7 times that: 186 feet. It's not going to happen this century. It won't happen next century or the century thereafter. It really won't. I mean little bits may. We'll talk about that. I am not here to scare anybody. [Laughs] You think that's funny. No, I'm really not. I'm here to tell you and I like to - I use the metaphor in my book but it's really true but - pretend I'm your doctor. There's some bad news, okay? Let's deal with it, okay? Let's find out what the options are, what's fact, what's fiction, you know? And that's way I want to talk to you because I decided as I was - it took me 4 years to research and write my book and my daughter was growing up and I really was struck by "How do I convey information that isn't just depressing as hell and that people will listen to you?" And it really took me a while to find the voice and I'm pretty comfortable with it now. It's really as if I was your doctor telling you something and I think you can understand that and it's what you - it's what I - would want, and I just assume that's what most people want. You know, just give me the facts. Don't depress me. Don't sugarcoat it. Tell me what the options are, and that's what I try to do. Now so there's 210 feet if you add up those 2 numbers so I gave you 212 and that's give-or-take a foot or 2. We don't know exactly but it's pretty good estimates. When all the glaciers in the world melt from Alaska to The Alps to South America, to Africa, that will be another 2 or 3 feet of sea-level rise and I have to tell you when I came across that bit of research, I was surprised it was that small. That all the glaciers in the world were 2 or 3 feet and yet Greenland but then when you look at these photos of the size of Greenland and Antarctica, it sort of makes sense because you can even get a hint of some of the glaciers in Alaska up there and other places, you know? Volume-wise it's tiny. The other thing that causes sea level to rise is kind of elusive but you need to understand it. So we have ice on land, which I'm going to go through in a second but the other factor that just to be clear, up-front, is what they call thermal expansion of seawater. It sounds like a mouth but it's really not. Most substances, as you warm them, they change size. You know parts don't fit in the wintertime and if you've been up north when it gets colder or warmer, we've all been through that, right, where different things change dimensions very slightly. Well, the oceans are on average 12,000 feet deep, a little over 2 miles on average, of course much deeper at the extremes. But that 12,000 feet of ocean, in the last century, has turned into about 4 inches of sea-level rise just from warming the ocean. It's expanded that much. So about - I told you there were 7 or 8 inches of sea-level rise in the last century or so. About half's come from the expansion of sea water, which has no lag time and about half from the glaciers and Greenland melting, which does have a lag time, once you apply heat. It doesn't melt instantly, okay? But now let me take you on a quick tour of Greenland and then Antarctica so to help you differentiate where the problems are. We've just seen icebergs. Think of them as giant ice cubes. They calve off at the face of a glacier. Here this is one in Greenland. It's an image in 2007 of Eqi Glacier. There's about 100 such glaciers in Greenland and they calve off into icebergs and if you go up the glacier on this helicopter tour, I hope you visually remember that a glacier is a bending river of ice, just as it looks. So we have icebergs, now we have glaciers, and then there's 2 ice sheets in the world, major ice sheets. At the top of Greenland as you saw before there's basically an ice sheet covering the island. It's 2 miles thick or so. It's essentially flat and it drains to the ocean through the 100 or so glaciers and breaks off into icebergs and meltwater. The problem is - well, there're several problems but one problem is - looking at the Greenland Ice Sheet here, in 2012, that first it looks dark. That's not the natural color of snow. That's mostly soot and other forms of carbon, not carbon dioxide but call it pollution if you will but carbon that settles in the Arctic and again, like a white-roof/black-roof imagery, which you all would understand - the black roof absorbs more heat - the problem is, is soot lays down in the Arctic, it accelerates the warming. There's also some pooling water - they call them lakes - up here and so on, and that pooling water is a problem because that darker blue actually also intensifies the heat. And as you can see here, very plainly over a wide area of the ice sheet on top of Greenland there's fissures. This isn't a flat sheet that's just melting from a flat tabletop surface. There's fissures going down vertically, very easy to see and that has a dramatic effect because as the ice sheet fissures, the heat and the melting is happening down through the ice sheet, not at the top. These things are not fully in the models yet because they're acting in ways we can't quite predict. So the dynamics are changing. Now when the meltwater collects in Greenland and this has been on the cover of National Geographic at least once but in 2 articles and it's you've probably seen images. Again at the top of Greenland, there's no mountains in Greenland but there are in Antarctica, which I'll show you in a minute. But this meltwater that's gathered here and going into this stream and down the shoot is not coming from some mountain stream. This is the water that's aggregating from just the surface melting on the top of Greenland that needs to find a path and so it finds a crack and it goes down and it works its way through the crack and it makes it bigger but it becomes what they call moulin, a French word, okay? Think of it like chimney. It's vertical shaft. When I was there in 2007 we did our helicopter survey out into the ice sheet, the pilots and scientists who were there for the whole season estimated there were about 100 of these moulins. They could just count 'em and they do a survey technique, in fact and map out so many square miles and extrapolate it with some statistical validation. There are about 100 of them in in 2007. Can I keep my - I round off numbers to make them easy, not because I'm faking them but just to make them really easy to remember and they're very close. They're all within 10 percent. We went from 100 moulins in 2007, in 2012, 5 years later, 1,000. That's not a matter of instruments or somebody's prejudice on how much water is melting. That's counting these bright, dark - actually dark - blue spots. I mean you can't miss 'em from the helicopter, okay? You can imagine seeing this. It's a dark shaft with kind of fringing blue. It went from about 100 to 1,000, a 10-fold increase in 5 years. That is astounding. Now 2012 was peak-warm year, it was actually probably worse than most but still to get a 10-fold increase of something physical like that that there's no opportunity to misinterpret what the needle said or the accuracy of the gauge or anything like that is pretty good proof that something dramatic is happening. And when the water gets down to the base of the ice sheet, as shown in the far right, it not only works its way to the ocean, at which point it does add to sea-level rise but by lubricating the ice sheet and lifting the ice sheet off the bedrock, the glaciers are speeding up double, triple and - in some cases - quadruple their traditional speed so the formation of icebergs calving off and breaking off those giant ice cubes is happening a lot faster. So the system - this is not pieces of a puzzle. Well it is but they're fitting together very well. How many of you have heard of the IPCC? Okay well about 20 percent okay. That's the Intergovernmental Panel on Climate Change. It's the UN group, 2,000 scientists that work together largely as volunteers from countries all over the world to try and come up with the Encyclopedia of Climate every 5 or 6 years. They just came out with the 5th report last year and it made the news as well it should. It's the best consensus document and what did they say about sea-level rise? Well in this last projection - and I cover this in my book for those who have read it or want to understand more about it but as I headline here, I'll give you the answer. They say we're going to get 10-32 inches of sea-level rise. Now you might read that and think that they've said we're going to 10-32 inches of sea-level rise for some reason, right? Not. The problem is that if you read it carefully their protocol says -- which they've been bound to from their formation in 1988 -- that they'll only consider evidence in peer-reviewed literature. By a cut-off date, it's got to be quantifiable by the year 2100 and to a very high confidence, 2 or 3 sigma, like, 90-percent certainty. That's kinda the rules to get in there so that it's fair and even. The problem is that allows them to count the things they can quantify to that standard of certainty. There are some unknowns and I've suggested some but I'm going to show them in some explicit now. I mean one of them is methane, which I'm not going to get into much but methane is escaping out of the seabed, the permafrost and lakes in Siberia because there's slushy methane deep under the - well not deep under the - ocean, actually shallow under the deep ocean and in various cold climates that's been trapped. It's also essentially natural gas and so when we do fraccing, which is becoming more and more popular as a cheap energy source in America, the what they call fugitive gas or that escapes during drilling or even transferring it into trucks or whatever, that methane - or the natural gas is essentially methane - and methane is a powerful warming agent, really powerful. Dozens of times - maybe 80 times more powerful than CO2 and we haven't really quantified it but the recent studies indicate that there's a lot more methane escaping than we thought so it's something to be concerned about. But the one I wanted to talk to you about specifically because I can be visual about it is Antarctica. They also say we really can't quantify Antarctica very well and we know, in particular, the areas to be concerned about. Just to help you visualize Antarctica, it's much more mountainous - it is mountainous - where Greenland's not, really. It's much bigger, of course. Everybody can see that. The ice sheet's thicker so there's about 7 times the amount of ice on it or frozen water. And if we look at this image of Antarctica, which has been colorized to show where the warming's happening most significantly and where the ice is showing signs of moving the thing we're really concerned about is at the 8 o'clock position. I'm going to show you a little more detail in a moment but those glaciers -- we're going to refer to that group with the red - is at the 8 o'clock position as the Pine Island Glaciers. You also may hear the Thwaites Glacier, and we need to start paying attention to that because that is the place that could trigger big sea-level rise. We know exactly where it is. We're spending tens of millions of dollars doing better and better research. We've now got probes that go down through it. Well actually let me - this is a better view of that same area from an aerial view, in effect, a graphic that shows those same 6 glaciers - Thwaites, Pine Island, Smith, et cetera - and those 6 glaciers have been studied for over 35 years as the potential source of let's call it catastrophic sea-level rise. What's catastrophic? Well, I think many of us would probably agree that 10 feet of sea-level rise in a century is catastrophic and, in this case, it could be in decade or 2. Now again it's not going to happen this decade. It can't happen next decade. There's some physical reasons why it really can't but the question of when these 6 glaciers will loosen and slide into the ocean and just these 6 glaciers cause 10 feet of sea-level rise means of course a really important question and the evidence is not good. We now can put ROV's, remote operated vehicles, cameras, underneath the glaciers and they've been melted underneath, going back 25 miles, into Antarctica. They go underwater so they're actually being eaten away quicker underwater than they are on the surface and we couldn't see that before. And the physical structure of these glaciers is such that at some point in the future - and it could be this century or next - they will slide into the ocean. Now the slide isn't like overnight. It's not instant. It may take a decade or two. We really don't know. We've never been able to witness something on this scale. Yeah, we do models and stuff like that but they're just models. Nobody wants to scare anybody and, in science, actually we tend to be cautious and not say something we can't prove. Inadvertently that has caused us to -- if anything -- minimize the projections for sea-level rise. We've got to find a happy balance and that's what I try to do. Keep your eye on the Pine Island Glaciers or the Thwaites Glacier if you read about Antarctic changes because it has been in the news in the last 2 years. In fact if you want there's a great little YouTube video called "Meltwater Pulse 2B" but you don't have to remember that. My website, which I'll list here at the end, is johnenglander.net. Go to it and I think just 2 blog posts ago that I have links to - some awesome videos. Really is a fine freebie and you don't even have to give me your email address and it'll take you to a video showing what's happening in Antarctica and one about Greenland, and you may want to see it because it'll give you some real-time imagery from NASA that - it's a little - it's a little scary or it gets your attention. And again it's not going to happen in the next 2 decades but it puts a whole different level of what could happen into perspective so I'm going to kinda wrap up here before I take questions. You've been a very attentive audience and I want to give you an opportunity to ask questions but I'm going to show you one - a couple, two - more graphs I think it is. Well, this one is the start. This is 400,000 years of sea level, up-and-down with the Ice Age cycles and, on top of that, from left-to-right and so the present is at the right, at the top of that graph I'm going to lay on a red line for temperature, global average temperature and one for greenhouse gas, carbon dioxide. So we have green, greenhouse gas, red for heat and blue for ocean, easy to remember, right? I submit that this is probably the best single image - not just because I created it because, in truth, is I did it with a lot of help form a very famous climatologist, Dr. James Hansen, former NASA scientist, chief scientist, and I give him credit on the far right there and if you want to write me you can borrow this. You can have this slide. It's even downloadable on the website. I think that this image tells a better story about climate than everything else we can say so let me talk you though it, it'll take me about 3 minutes. You know what the 3 lines are now: Greenhouse Gas, Average Global Temperature and Sea Level. I'm going to tell you where the data comes from in a minute because that's the next question. How could you possibly know 400,000 years of data. But let's start with Temperature, in the middle, the red. So the planet goes through these temperature cycles. We think of them as Ice Ages. It's a natural cycle. We've had nothing to do with the past ones, okay? We're at the warm spot of the normal cycle. You can see that, right, where line's at the high point. As the planet changes temperature in a 100,000-year cycle that we call the Ice Ages and it's roughly 100,000 years - really between 95 and 125,000 years but let's call it a 100,000-year Ice Age Cycle. The ice melts slowly but surely and the sea level rises so that's why temperature and sea level always go together more or less. And carbon dioxide was proven to be a greenhouse gas, and by greenhouse we mean that it's transparent, you can't see carbon dioxide no matter what the quantity unless it's frozen but it does trap heat to an amazing power, not proven recently by Al Gore or anyone else. It was proven in 1826 by a French genius, Joseph Fourier, mathematician, who was able to prove that carbon dioxide was a greenhouse gas without even using electricity. It's that basic in terms of physics. So carbon dioxide traps heat just like glass in a greenhouse, raising temperature. Now some sceptics or doubters or professional disinformation people, whatever you want to call it, propagandists I guess would be the right term, try and confuse things saying, "Well, sometimes temperature rose first before CO2 - and it's true. If you took a straight edge to this you'd see that certain cycles, that sometimes CO2 causes temperature to rise, as I just described, but the other is true, too, and it, at first, may sound contrary but it's not. There are some relationships in physics where either one can drive and both go the same direction, and I'll give you the proof of this. Again, you don't need any technical training to understand this. If you take 2 soda bottles, carbonated beverage, and uncap them and warm one, it will go flat faster. Warmer liquids give up gas faster so where the ocean has warmed because of volcano, undersea volcanoes or meteors or asteroids or whatever in earth's history, where the ocean has warmed it has given up CO2 and raised the CO2 level. Where more CO2 has been put into the atmosphere by whatever source it has trapped heat and warmed the ocean so they always go together. And, with warmth, goes change in the ice sheet over decades or centuries and with change in temperature goes sea-level rise. So you can see why the 3 lines happen to line up. It's not a coincidence. The 3 lines, the 4 peaks, with the Ice Ages all line up. Now sea level - and each one has a normal bound and, by the way, this graph could be extended to the left 4 million years and wouldn't change much. The pattern's been in place for 3 or 4 million years. A couple of other things that are worthwhile noting because this is such a great picture of climate - that the 100,000-year cycle, as you can see, isn't even, it doesn't go down 50 and up 50. It just goes down about 80 and up 20 and Ice Age - the Ice Age - peaked 20,000 years ago. We were at the turning point. The reason it looked like sea level wasn't changing was because we were at the turning point. I didn't see that 'til I wrote the book and researched it, frankly. I was always confused why sea level had been so stable for 5,000 years. It was just like going to the inlet here, out back: The high tide comes in; the water goes up, 20, 30 minutes. It just swirls around and doesn't seem to change, right? Slack tide: We've all seen that, right, at any inlet, before it goes out. Well, our 5,000 years of earth history happened to be slack tide. We got fooled. I guess it was kind of a Mother Nature's gotcha joke sort of, I guess, fooling us into building on the shoreline as if it was permanent. We didn't know any better. We really didn't understand this until 100, 150 years ago. And the other notable thing out of this is that the last peak 120,000 years ago as I've suggested but here you'll see it graphically is about 25 feet higher than present. We're going to go past that. There's no question - even if we all stop burning fossil fuels tomorrow, today, if we emit no more carbon dioxide or methane in the atmosphere, sea level's going to rise. It has to. The ocean's already been warmed a degree and a half. It's like an outdoor swimming pool that's been heated and then it gets cold outside. The heat stays in the pool for a while, right? Heat stays in water much better than air because of the density, right? You've all seen the outdoor-swimming-pool affect, right, that it takes a while to warm a pool as temperature rises, when it gets warmer, and once the pool is warmed, when it gets colder outside, the pool retains its heat, right? So that's the reason because 90 percent of the excess heat we're trapping is being stored in the ocean. So even if we stopped the greenhouse gasses today and they're already 40 percent higher than in 10 million years, sea level's still going to rise, which is not what most people think or are being lead to believe. I'm going to bring this all home to you in a just a minute and I know you're getting tired. It's the evening and - but - this'll come clear in a picture. I'm going to try and give you a positive way to look at this even though it seems like probably the worst news you've ever heard. But so the last time sea level was higher was about 25 feet high or 120,000 years ago. We know that data from ice cores. From Greenland in Antarctica we drilled down and different nations do it, different teams of scientists and they all come up with pretty consistent answers. It's a great technology. It's only been around for about 20 years. It's similar to, like, taking a tree core, you know, and getting tree rings. This is done down so it's horizontal instead of vertical but pretty much the same concept that you can go back or go in and pick your year by counting and, amazingly, you can get 800,000 years of data here from Antarctica and date these slices of the cores that you get outta the shafts here, a slice dated to within 3 years. 800,000 years old, really great technology. I used to say cool technology but it elicited too much of a groan. [Laughter] The air bubbles that are there were the air spaces that were trapped between the snow crystals and as it compacted and became ice and then, under weight, became pressurized ice the bubbles shrank so now they're pressurized. So every one of those bright dots between that person's fingers in the lower right is an air sample. And we have the technology just like in medical technology through the microanalysis today and we can get the percentage of carbon dioxide that was in existence. And temperature of course is the temperature of ice so we don't know. That doesn't tell us anything but there's gasses in there and there's 2 isotopes of oxygen - 16 and 18 - and their proportions vary with temperature because of their molecular weight so there's a really simple relative marker of temperature change and it's statistically been validated again by teams of scientists from different countries, different universities, different institutions so it really holds up and we have 800,000 years now of CO2 and temperature record from the ice cores. We didn't have that 20 years ago. Some people say, "Oh, they couldn't have data going back more than 100 years." No, we have really good data. Frozen data samples. And then we find ancient sea levels, as I described to you up-front, you can find ancient shorelines under water. I did that back in college and have done it since. So that's how we get carbon dioxide, temperature and sea level from different research groups around the world, creating a pretty consistent composite picture that you saw there in that 3-part chart. And from that, we know that if you take the last section, the most recent, 50 years or so, and see the trends that we can project quite safely what's going to happen within bounds, as shown here in shaded areas. We know that there's enough heat in the ocean again that even if we do all the right things, environmentally and being green and solar and all those really important things, if we don't do them, this is going to get out of control quicker. But that sea level's still going to rise and that's just an unfortunate truth. There are some things we can do if we start paying attention and get rid of the politics and the emotions and the nonsense and the disinformation and the propaganda. This is an example from The Netherlands, a town where they weren't worried about sea-level rise but they've had big storm problems from the North Sea and river flooding and, as you know, and their country is - most of it's - underwater, was 30 percent below sea level anyway so they've been reclaiming land from the sea for 1,000 years so they're kind of experts in that. And this is a town that's been built, called Vlissingen. It's down by the Belgian border and just to give you an example of what can be done with really bold thinking and futuristic planning. This relatively modern town, you can't quite see the water at the far-right at the beach there but if you walk yourself leftward, the black area's really the - well, I guess it's pavement of some sort or macadam that getting them up to the height of the levy - and you can count the steps so it's about 6 or 8 feet. And then the roadway's another several steps up and then the building height's another 5 feet and the ground floor of the building in this town, by code, has to be a wash-through. If a storm wave goes through the ground floor, it can do no damage, no electrical equipment. And so it's a good example of planning. They bought 25 or 30 feet of a combination of storm surge, extreme tides and sea-level rise. Now here in South Florida where it's porous limestone, we don't quite have that luxury that we have to really build up because they're able to protect lowland inland. If you've flown through Amsterdam Airport, Schiphol Airport, it's 11 feet below sea level. It's one of the many polders as they call them in The Netherlands, which means low area protected by a levy outside. There they have enough clay in the soil so that they can keep water out. If we did that here, it would just percolate into lowland behind so we have to lift everything we want to protect in Florida and The Bahamas and The Maldives and most coral-based islands. In closing let me just bring this back to when we look at the beaches and help you put this in perspective and then I'll take questions. We tend to forget when we look at the beach, which seems to have a 10-foot rise in it. You'd think that you'd understand intuitively, as sea level rose, how the shoreline would move inland. We don't. Because the beach rises steeply and as soon as you think about it you realize that if sea level were 3 feet higher, the beach is still fine actually in places like this but it's the lowland behind out towards the Everglades or the Intracoastal Waterway - Anyplace that's low, that's what's going to flood. So that's another example of how a storm surge is totally different from sea-level rise. I know this has been sobering and I'm going to conclude here, take questions, certainly. I do this with audiences from senior scientists to military leaders to community leaders not just in the United States. What your experience now of feeling "wow" or a little bummed or scared is perfectly understandable. But I hope you see that this really isn't an opinion. I've just connected some dots by looking farther and putting it in the context of the Ice Ages. I don't really care a whole lot about the models because the models aren't perfect. And I can tell you that having done this for 2.5 years that - and been in some pretty hostile audiences - there's no rebuttal. I welcome it. It just hasn't happened. It's a lot to think about. Again my website's free, books are cheap. They're $20.00 or $9.00 for eBooks. I'd be glad to take questions. I hope I've helped you piece together a picture. If you can use any of these materials and teach others I hope you do. The glass-half-full that I like to leave people with is this: Obviously the glass-half-empty is the bad news. Here's the 3 things I want you to think about to hopefully give you a little bit of a positivism after this perhaps disconcerting hour. Most problems that we think about and fear like tornados, Category 4 earthquake, hurricanes, earthquakes, tsunamis, give us little - if any - warning, right? We really don't know when and we might know a hurricane a few days in advance now but the rest of this stuff? None. And even with a few days of warning of a major hurricane, you know there's limits of what you can do. But we're always doing cleanup and catchup afterwards. This problem isn't an if-it-will-happen, it will happen. We just don't know how soon. We don't know whether we're going to get 3 feet of sea-level rise by 2100 or 2060 but it's going to happen. It's going to happen to all coastal areas. It's not a matter of where it happens. Now I don't know about you but I'll take this problem any day over tsunamis, earthquakes, tornados that you're kind of building in case it happens and you don't really know what you're building to what level. We can start planning for the first 3 feet of sea-level rise, the first 3 feet. I say 3 feet. Why do I pick that number? Well, it's a meter if you're metric and international but it really forces us to think higher if you're an architect or engineer or building the new dock on your house or figuring out the new floor elevation or the new design height for your water system in your community or sewage system. We don't know when we're going to get the first 3 feet. The soonest is 2060. I would say the latest is 2120 but with the certainty that it's going to happen, that actually is liberating: We have time to plan, but we have no time to waste. We've really got to get with this and we're idiots if we don't. We gotta stop playing around with it. The second is to put that in a positive frame. When we tackle big problems whether it be man-on-the-moon, cellphones, AIDS, you know, anything, we do great stuff. But we're not focused on this problem yet because we're either playing disinformation and politics or playing about the energy side of this equation and confusing ourselves. We've gotta get over that. So I think time's on our side to a degree. It's slow. It's inevitable. We've gotta stop confusing this with reducing greenhouse gas and all the other great, green, environmental, sustainable things we should be doing so that it doesn't go catastrophic on us. Because if that area in Antarctic warms quicker, it's going to get catastrophic. We still have the possibility of keeping it from getting catastrophic. We should do that. We also need to begin adapting to rising sea level for the first time in human civilization. And the third perspective is that, well, you may say, "What can I do about it?" Well, you can help inform others. I mean, there's nothing I've explained tonight that you could not explain to your neighbor, your family members, your business partners. Whether you use my book, use my website, if there's some of these slides you want, send me an email. You can find my stuff on the web. This is worth sharing and it's not about my message. I've just put it together in a way that seems to cut through a lot of other stuff and I hope you join me in sharing this insight into the future of this planet. Thank you.
Current listings
| [3] | Name on the Register | Image | Date listed[4] | Location | City or town | Description |
|---|---|---|---|---|---|---|
| 1 | Peter F. Armistead Sr. House | July 9, 1986 (#86001540) |
Waterloo Rd. 34°50′28″N 87°44′24″W / 34.841111°N 87.74°W | Florence | ||
| 2 | William Bowen Lustron House |  |
February 24, 2000 (#00000135) |
1145 Wildwood Park Rd. 34°49′00″N 87°41′18″W / 34.816728°N 87.688226°W | Florence | |
| 3 | Cherry Street Historic District |  |
July 3, 1997 (#97000648) |
Cherry St. between Hermitage Dr. and E. Tombigbee St. 34°48′29″N 87°40′21″W / 34.808056°N 87.672500°W | Florence | |
| 4 | Coffee High School | February 4, 1982 (#82002045) |
319 Hermitage Dr. 34°48′29″N 87°40′34″W / 34.80803°N 87.67604°W | Florence | Demolished | |
| 5 | College Place Historic District |  |
January 12, 1995 (#94001547) |
Along Sherrod Ave. between W. Lelia St. and Circular Rd.; also roughly along W. Lelia and W. Mattie Lou Sts. 34°48′46″N 87°40′51″W / 34.812778°N 87.680833°W | Florence | Second set of boundaries represents a boundary increase of September 14, 1998 |
| 6 | George Coulter House |  |
January 21, 1982 (#82002046) |
420 S. Pine St. 34°47′46″N 87°40′32″W / 34.79604°N 87.67549°W | Florence | |
| 7 | Courtview |  |
June 13, 1974 (#74000415) |
Court St. 34°48′21″N 87°40′46″W / 34.805833°N 87.679444°W | Florence | |
| 8 | E.H. Darby Lustron House |  |
February 24, 2000 (#00000127) |
321 Beverly 34°47′30″N 87°41′19″W / 34.791750°N 87.688611°W | Florence | |
| 9 | Downtown Florence Historic District |  |
August 22, 1995 (#95001021) |
Roughly the eastern side of Court St. from 104 N. Court to 119 S. Court, 100-128 E. Tennessee St., and 106, 108, and 110 S. Seminary St.; also roughly bounded by Pine St., Alabama St., Wood Ave., and Tuscaloosa St. 34°48′00″N 87°40′31″W / 34.8°N 87.675278°W | Florence | Second set of boundaries represents a boundary increase of December 18, 2001 |
| 10 | Florence Wagon Works Site | June 13, 1996 (#96000596) |
South of Dekalb Ave. between Main and Spurr Sts. 34°48′09″N 87°38′35″W / 34.802500°N 87.643056°W | Florence | ||
| 11 | Forks of Cypress |  |
October 10, 1997 (#97001166) |
Jackson Rd., roughly 1.5 miles northwest of the junction of Cox Creek Parkway and Jackson Rd. 34°50′42″N 87°43′32″W / 34.845°N 87.725556°W | Florence | |
| 12 | Forks of Cypress Cemetery |  |
February 24, 2000 (#00000140) |
0.25 miles north of Jackson Rd. on the eastern side of Dowdy Rd., north of Little Cypress Creek 34°50′53″N 87°43′19″W / 34.848056°N 87.721944°W | Florence | |
| 13 | Karsner-Carroll House |  |
March 31, 1970 (#70000104) |
303 N. Pine St. 34°48′05″N 87°40′43″W / 34.801500°N 87.678611°W | Florence | |
| 14 | William Koger House | July 9, 1986 (#86001542) |
Smithsonia-Rhodesville Rd. 34°49′19″N 87°52′25″W / 34.82185°N 87.87364°W | Smithsonia | ||
| 15 | Larimore House | November 21, 1974 (#74000416) |
Mars Hill Rd./U.S. Route 8, Box 344 34°50′49″N 87°39′36″W / 34.84697°N 87.65995°W | Florence | Burned July 19, 2018, subsequently demolished. | |
| 16 | Maud Lindsay Free Kindergarten | October 18, 2019 (#100001877) |
227 Enterprise St. 34°48′27″N 87°38′59″W / 34.8075°N 87.6496°W | Florence | ||
| 17 | Locust Street Historic District |  |
October 3, 2002 (#02001065) |
Roughly bounded by Pine St., College St., Locust St., and Irvine Ave. 34°48′08″N 87°40′47″W / 34.802222°N 87.679722°W | Florence | |
| 18 | James Martin House |  |
December 9, 1981 (#81000128) |
1400 Cypress Mill Rd. 34°48′56″N 87°42′12″W / 34.81563°N 87.70334°W | Florence | |
| 19 | McFarland Heights | July 10, 2017 (#100001280) |
501-920 Riverview Dr., 701-735 Pleasant Cir., 410-456 Riverview Cir. 34°47′32″N 87°40′57″W / 34.792191°N 87.682409°W | Florence | ||
| 20 | Old Natchez Trace (310-2A) |  |
November 7, 1976 (#76000156) |
15 miles northwest of Florence on State Route 20 34°55′31″N 87°50′38″W / 34.925278°N 87.843889°W | Florence | 1,250-foot segment of the Natchez Trace, both paved and unpaved.[5] |
| 21 | Governor Robert Patton House |  |
June 17, 1976 (#76000335) |
Sweetwater and Florence Boulevard 34°49′28″N 87°38′34″W / 34.82446°N 87.64269°W | Florence | |
| 22 | Rogers Department Store |  |
August 14, 1998 (#98001025) |
117 N. Court St. 34°48′03″N 87°40′36″W / 34.800833°N 87.676667°W | Florence | |
| 23 | Rosenbaum House | 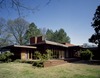 |
December 19, 1978 (#78000492) |
601 Riverview Dr. 34°47′35″N 87°40′50″W / 34.79304°N 87.68057°W | Florence | |
| 24 | Sannoner Historic District |  |
January 1, 1976 (#76000336) |
Includes both sides of N. Pine and N. Court from Tuscaloosa Ave. to the University of North Alabama campus 34°48′14″N 87°40′45″W / 34.803849°N 87.679095°W | Florence | |
| 25 | Seminary-O'Neal Historic District |  |
February 17, 1995 (#95000092) |
Roughly Seminary St. between Hermitage Dr. and Irvine Ave. and Irvine between Seminary and Wood Ave. 34°48′20″N 87°40′39″W / 34.805556°N 87.677500°W | Florence | |
| 26 | Seven Mile Island Archeological District | April 16, 1979 (#79003352) |
Address Restricted[6] 34°45′02″N 87°44′12″W / 34.7506°N 87.7367°W | Florence | ||
| 27 | Southall Drugs |  |
August 21, 1980 (#80000699) |
201 N. Court St. 34°48′04″N 87°40′37″W / 34.801111°N 87.676806°W | Florence | |
| 28 | Walnut Street Historic District |  |
December 12, 1976 (#76000337) |
N. Walnut between Hermitage and Tuscaloosa; also 415-609 N. Poplar St. (odd numbers only); also the junction of Poplar and Tuscaloosa Sts. 34°48′20″N 87°40′28″W / 34.805556°N 87.674444°W | Florence | Second and third sets of boundaries represent boundary increases of April 4, 1993 and March 16, 1996 respectively |
| 29 | Water Tower |  |
April 28, 1980 (#80000700) |
Seymore St. 34°49′29″N 87°41′27″W / 34.824722°N 87.690833°W | Florence | |
| 30 | Wesleyan Hall |  |
June 20, 1974 (#74000417) |
Morrison Ave. 34°48′32″N 87°40′45″W / 34.80897°N 87.67916°W | Florence | |
| 31 | Wilson Dam |  |
November 13, 1966 (#66000147) |
On the Tennessee River along State Route 133 34°48′03″N 87°37′33″W / 34.800917°N 87.625817°W | Florence | Extends into Colbert County |
| 32 | Wilson Park Houses |  |
January 25, 1979 (#79000390) |
209, 217, and 223 E. Tuscaloosa St. 34°48′14″N 87°40′31″W / 34.803889°N 87.675278°W | Florence | |
| 33 | Wood Avenue Historic District |  |
October 10, 1978 (#78000493) |
N. Wood Ave. roughly bounded by Tuscaloosa and Hawthorne Sts.; also roughly along E. Hawthorne, Meridian and Kendrick Sts.; also roughly along Kendrick Ave. and 633 Hermitage Dr. 34°48′26″N 87°40′37″W / 34.807222°N 87.676944°W | Florence | Second and third sets of boundaries represent boundary increases of March 16, 1996 and August 3, 1997 respectively |
See also
- List of National Historic Landmarks in Alabama
- National Register of Historic Places listings in Alabama
References
- ^ The latitude and longitude information provided in this table was derived originally from the National Register Information System, which has been found to be fairly accurate for about 99% of listings. Some locations in this table may have been corrected to current GPS standards.
- ^ National Park Service, United States Department of the Interior, "National Register of Historic Places: Weekly List Actions", retrieved April 12, 2024.
- ^ Numbers represent an alphabetical ordering by significant words. Various colorings, defined here, differentiate National Historic Landmarks and historic districts from other NRHP buildings, structures, sites or objects.
- ^ The eight-digit number below each date is the number assigned to each location in the National Register Information System database, which can be viewed by clicking the number.
- ^ William E. Cox (October 1, 1974). "National Register of Historic Places Inventory-Nomination: Old Natchez Trace (No. 310-2A) / Road from Natchez to Nashville, Path to Chickasaw Nation, Path to Choctaw Nation, Natchez Trace". National Park Service. and Accompanying photo from 1976, and map
- ^ Coordinates are derived from the GNIS feature record for Sevenmile Island closest to Florence; the NRIS provides no coordinates

Municipalities and communities of Lauderdale County, Alabama, United States | ||
|---|---|---|
| Cities |  | |
| Towns | ||
| CDPs | ||
| Unincorporated communities | ||