
Jintang County
金堂县 Kin-tang | |||||||||||||||||||||||||||||||||||||||||||||||||||||||||||||||
|---|---|---|---|---|---|---|---|---|---|---|---|---|---|---|---|---|---|---|---|---|---|---|---|---|---|---|---|---|---|---|---|---|---|---|---|---|---|---|---|---|---|---|---|---|---|---|---|---|---|---|---|---|---|---|---|---|---|---|---|---|---|---|---|
 | |||||||||||||||||||||||||||||||||||||||||||||||||||||||||||||||
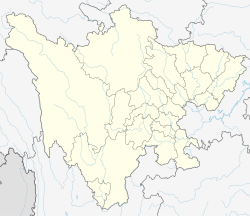
 Location of Jintang County in Sichuan | |||||||||||||||||||||||||||||||||||||||||||||||||||||||||||||||
 Jintang Location of the seat in Sichuan | |||||||||||||||||||||||||||||||||||||||||||||||||||||||||||||||
| Coordinates: 30°51′04″N 104°24′58″E / 30.851°N 104.416°E[1] | |||||||||||||||||||||||||||||||||||||||||||||||||||||||||||||||
| Country | China | ||||||||||||||||||||||||||||||||||||||||||||||||||||||||||||||
| Province | Sichuan | ||||||||||||||||||||||||||||||||||||||||||||||||||||||||||||||
| Sub-provincial city | Chengdu | ||||||||||||||||||||||||||||||||||||||||||||||||||||||||||||||
| County seat | Zhaozhen Subdistrict | ||||||||||||||||||||||||||||||||||||||||||||||||||||||||||||||
| Area | |||||||||||||||||||||||||||||||||||||||||||||||||||||||||||||||
| • Total | 1,156 km2 (446 sq mi) | ||||||||||||||||||||||||||||||||||||||||||||||||||||||||||||||
| Population (2010)[2] | |||||||||||||||||||||||||||||||||||||||||||||||||||||||||||||||
| • Total | 717,225 | ||||||||||||||||||||||||||||||||||||||||||||||||||||||||||||||
| • Density | 620/km2 (1,600/sq mi) | ||||||||||||||||||||||||||||||||||||||||||||||||||||||||||||||
| Time zone | UTC+8 (China Standard) | ||||||||||||||||||||||||||||||||||||||||||||||||||||||||||||||
| Postal code | 6104XX | ||||||||||||||||||||||||||||||||||||||||||||||||||||||||||||||
| Area code | 028 | ||||||||||||||||||||||||||||||||||||||||||||||||||||||||||||||
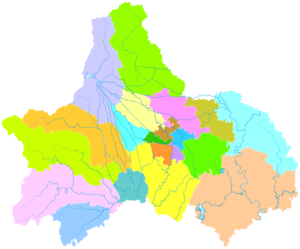
| Chengdu district map |
| ||||||||||||||||||||||||||||||||||||||||||||||||||||||||||||||
| Website | jintang | ||||||||||||||||||||||||||||||||||||||||||||||||||||||||||||||
| Jintang County | |||||||
|---|---|---|---|---|---|---|---|
| Traditional Chinese | 金堂縣 | ||||||
| Simplified Chinese | 金堂县 | ||||||
| Literal meaning | Golden Hall County | ||||||
| |||||||
Jintang County[a] is a county of the City of Chengdu, capital of Sichuan, China.
YouTube Encyclopedic
-
1/3Views:1 4961 1082 109
-
Floods in China. Heavy rains causes floods in Jintang county,Chengdu,Sichuan citys
-
China panic: Worst flood record drown China's Sichuan after 71 years, Three gorges dam threatened
-
Incredible Clouds in China August 2020
Transcription
Geography
Jintang is bordered by the prefecture-level cities of Deyang to the north and east and Jianyang to the south.
History
In the 19th century, Jintang County was regarded as producing the best tobacco in Sichuan after nearby Pidu District.[4]
Administrative divisions
Jintang is subdivided in 6 subdistricts and 10 towns:[5][6]
Subdistricts
- Zhaodao subdistrict (赵镇街道)
- Guancang subdistrict (官仓街道)
- Qixian subdistrict (栖贤街道)
- Gaoban subdistrict (高板街道)
- Baiguo subdistrict (白果街道)
- Huaikou subdistrict (淮口街道)
Towns
- Wufeng (五凤镇)
- Sanxi (三溪镇)
- Fuxing (福兴镇)
- Jinlong (金龙镇)
- Zhaojia (赵家镇)
- Zhugao (竹篙镇)
- Zhuanlong (转龙镇)
- Tuqiao (土桥镇)
- Yunhe (云合镇)
- Youxin (又新镇)
Climate
| Climate data for Jintang, elevation 494 m (1,621 ft), (1991–2020 normals, extremes 1981–2010) | |||||||||||||
|---|---|---|---|---|---|---|---|---|---|---|---|---|---|
| Month | Jan | Feb | Mar | Apr | May | Jun | Jul | Aug | Sep | Oct | Nov | Dec | Year |
| Record high °C (°F) | 20.1 (68.2) |
23.6 (74.5) |
32.8 (91.0) |
33.4 (92.1) |
37.1 (98.8) |
36.7 (98.1) |
38.1 (100.6) |
37.9 (100.2) |
36.8 (98.2) |
30.6 (87.1) |
26.1 (79.0) |
19.0 (66.2) |
38.1 (100.6) |
| Mean daily maximum °C (°F) | 10.0 (50.0) |
13.0 (55.4) |
17.9 (64.2) |
23.8 (74.8) |
27.6 (81.7) |
29.5 (85.1) |
31.1 (88.0) |
31.0 (87.8) |
26.5 (79.7) |
21.6 (70.9) |
16.9 (62.4) |
11.4 (52.5) |
21.7 (71.0) |
| Daily mean °C (°F) | 6.3 (43.3) |
8.9 (48.0) |
13.2 (55.8) |
18.4 (65.1) |
22.4 (72.3) |
24.8 (76.6) |
26.5 (79.7) |
26.1 (79.0) |
22.3 (72.1) |
17.7 (63.9) |
12.9 (55.2) |
7.7 (45.9) |
17.3 (63.1) |
| Mean daily minimum °C (°F) | 3.6 (38.5) |
6.0 (42.8) |
9.8 (49.6) |
14.4 (57.9) |
18.4 (65.1) |
21.3 (70.3) |
23.1 (73.6) |
22.7 (72.9) |
19.6 (67.3) |
15.3 (59.5) |
10.4 (50.7) |
5.2 (41.4) |
14.2 (57.5) |
| Record low °C (°F) | −4.4 (24.1) |
−2.1 (28.2) |
−1.6 (29.1) |
4.6 (40.3) |
7.2 (45.0) |
14.2 (57.6) |
17.1 (62.8) |
16.3 (61.3) |
12.9 (55.2) |
3.2 (37.8) |
0.6 (33.1) |
−4.3 (24.3) |
−4.4 (24.1) |
| Average precipitation mm (inches) | 6.8 (0.27) |
8.7 (0.34) |
18.7 (0.74) |
40.6 (1.60) |
65.2 (2.57) |
111.9 (4.41) |
185.4 (7.30) |
180.5 (7.11) |
114.3 (4.50) |
39.4 (1.55) |
9.9 (0.39) |
4.7 (0.19) |
786.1 (30.97) |
| Average precipitation days (≥ 0.1 mm) | 6.5 | 6.1 | 8.5 | 10.4 | 12.6 | 14.6 | 15.3 | 13.1 | 13.7 | 12.2 | 5.8 | 4.3 | 123.1 |
| Average snowy days | 1.0 | 0.3 | 0 | 0 | 0 | 0 | 0 | 0 | 0 | 0 | 0.1 | 0.3 | 1.7 |
| Average relative humidity (%) | 79 | 75 | 72 | 70 | 68 | 75 | 81 | 81 | 82 | 82 | 80 | 79 | 77 |
| Mean monthly sunshine hours | 58.9 | 66.4 | 105.1 | 135 | 143 | 125.1 | 143.3 | 157.2 | 94.3 | 70.8 | 66.2 | 54.8 | 1,220.1 |
| Percent possible sunshine | 18 | 21 | 28 | 35 | 34 | 30 | 33 | 39 | 26 | 20 | 21 | 17 | 27 |
| Source: China Meteorological Administration[7][8] | |||||||||||||
Notes
References
- Citations
- ^ Google (2014-07-02). "Jintang" (Map). Google Maps. Google. Retrieved 2014-07-02.
- ^ 我市2010年第六次全国人口普查数据公报 (in Simplified Chinese). Government of Chengdu. 2011-05-13. Archived from the original on 2011-09-30. Retrieved 2011-08-04.
- ^ Gutzlaff (1838), p. 533.
- ^ Baynes, T. S., ed. (1878), , Encyclopædia Britannica, vol. 5 (9th ed.), New York: Charles Scribner's Sons
- ^ 2023年统计用区划代码和城乡划分代码:金堂县 (in Simplified Chinese). National Bureau of Statistics of China.
- ^ "四川省成都市金堂县". 博雅地名分享网 (in Chinese).
- ^ 中国气象数据网 – WeatherBk Data (in Simplified Chinese). China Meteorological Administration. Retrieved 14 April 2023.
- ^ 中国气象数据网 (in Simplified Chinese). China Meteorological Administration. Retrieved 14 April 2023.
- Bibliography
- Gutzlaff, Charles (1838), China Opened, or, A Display of the Topography, History, Customs, Manners, Arts, Manufactures, Commerce, Literature, Religion, Jurisprudence, Etc. of the Chinese Empire, Vol. II, London: Smith, Elder, & Co..
External links
- Government website Archived 2010-01-07 at the Wayback Machine (Simplified Chinese)
- Page of description (Simplified Chinese)
This Sichuan location article is a stub. You can help Wikipedia by expanding it. |