
Jingyuan
泾源县 ڭٍْيُوًا ثِيًا | |
|---|---|
 Jingyuan in Guyuan | |
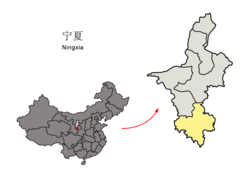 Guyuan in Ningxia | |
| Coordinates: 35°29′54″N 106°19′50″E / 35.4982°N 106.3306°E | |
| Country | China |
| Autonomous region | Ningxia |
| Prefecture-level city | Guyuan |
| County seat | Xiangshui |
| Area | |
| • Total | 1,128.67 km2 (435.78 sq mi) |
| Population | |
| • Total | 101,026 |
| • Density | 90/km2 (230/sq mi) |
| Time zone | UTC+8 (China Standard) |
Jingyuan County (simplified Chinese: 泾源县; traditional Chinese: 涇源縣; pinyin: Jīngyuán Xiàn, Xiao'erjing: ڭٍْيُوًا ثِيًا) is a county under the administration of the prefecture-level city of Guyuan in the south of the Ningxia Hui Autonomous Region of China, bordering Gansu province to the east, south, and southwest. The southernmost county-level division of Ningxia, it has a total area of 961 km2 (371 sq mi), and a population of approximately 120,000 people.[when?]
Characteristics
Jingyuan County, located at the southern tip of Ningxia Hui Autonomous Region, is the source of the Jing River. It is an agricultural region, with wheat being the primary crop. In recent years, the county has also begun to produce vegetables. The county government is located in the town of Xiangshui, and the county's postal code is 756400.
History and Demographics
According to the 1983 data, 96.8% of Jingyuan County's population (79,823 persons out of the then total population of 82,464) were Hui (Chinese Muslims) - the highest by far percentage of the Hui in any county-level jurisdiction in Ningxia or anywhere else in China. (Ningxia's county with second-highest percentage of Hui in its total population was Tongxin County, with 79.0% Hui).[1] According to Dru C. Gladney, the area became so heavily Hui after the suppression of the Dungan revolt (1862–1877), when many Muslims fled to, or were forcibly relocated to this mountainous district, near the Liu Pan mountain range, from other, more strategically located areas which the government wanted to keep Hui-free.[2] Even in modern times one can still see remains of Qing-era forts that were built on hilltops to monitor the potentially troublesome Hui settlers.[2]
Administrative divisions
Jingyuan County has 3 towns and 4 townships.[3]
- 3 towns
- Xiangshui (香水镇, ثِيَانْشُوِ جٍ)
- Liupanshan (六盘山镇, لِيُوپًاشًا جٍ)
- Jingheyuan (泾河源镇, ڭٍْحَيُوًا جٍ)
- 4 townships
- Dawan (大湾乡, دَاوًا ثِيَانْ)
- Huanghua (黄花乡, خُوَانْخُوَا ثِيَانْ)
- Xingsheng (兴盛乡, ثٍْشٍْ ثِيَانْ)
- Xinmin (新民乡, ثٍمٍ ثِيَانْ)
Climate
| Climate data for Jingyuan (1991–2020 normals, extremes 1981–2010) | |||||||||||||
|---|---|---|---|---|---|---|---|---|---|---|---|---|---|
| Month | Jan | Feb | Mar | Apr | May | Jun | Jul | Aug | Sep | Oct | Nov | Dec | Year |
| Record high °C (°F) | 15.5 (59.9) |
19.4 (66.9) |
24.0 (75.2) |
27.7 (81.9) |
29.1 (84.4) |
30.5 (86.9) |
32.6 (90.7) |
29.9 (85.8) |
30.9 (87.6) |
22.7 (72.9) |
18.5 (65.3) |
14.9 (58.8) |
32.6 (90.7) |
| Mean daily maximum °C (°F) | 0.2 (32.4) |
2.9 (37.2) |
8.0 (46.4) |
14.4 (57.9) |
18.4 (65.1) |
21.9 (71.4) |
23.4 (74.1) |
21.9 (71.4) |
17.1 (62.8) |
12.2 (54.0) |
7.3 (45.1) |
2.2 (36.0) |
12.5 (54.5) |
| Daily mean °C (°F) | −6.3 (20.7) |
−3.4 (25.9) |
1.8 (35.2) |
8.1 (46.6) |
12.3 (54.1) |
16.2 (61.2) |
18 (64) |
16.6 (61.9) |
12.1 (53.8) |
6.6 (43.9) |
1.0 (33.8) |
−4.5 (23.9) |
6.5 (43.8) |
| Mean daily minimum °C (°F) | −11.1 (12.0) |
−7.9 (17.8) |
−2.8 (27.0) |
2.6 (36.7) |
6.7 (44.1) |
10.9 (51.6) |
13.3 (55.9) |
12.6 (54.7) |
8.4 (47.1) |
2.6 (36.7) |
−3.5 (25.7) |
−9.3 (15.3) |
1.9 (35.4) |
| Record low °C (°F) | −23.1 (−9.6) |
−23.0 (−9.4) |
−17.8 (0.0) |
−10.2 (13.6) |
−5.7 (21.7) |
1.0 (33.8) |
5.2 (41.4) |
4.9 (40.8) |
−1.3 (29.7) |
−10.7 (12.7) |
−20.4 (−4.7) |
−27.4 (−17.3) |
−27.4 (−17.3) |
| Average precipitation mm (inches) | 6.2 (0.24) |
9.8 (0.39) |
18.5 (0.73) |
34.3 (1.35) |
59.9 (2.36) |
92.3 (3.63) |
127.4 (5.02) |
147.2 (5.80) |
96.5 (3.80) |
50.4 (1.98) |
13.0 (0.51) |
3.0 (0.12) |
658.5 (25.93) |
| Average precipitation days (≥ 0.1 mm) | 5.9 | 6.6 | 7.9 | 7.7 | 10.7 | 12.3 | 14.8 | 15.1 | 14.0 | 10.6 | 5.7 | 3.7 | 115 |
| Average snowy days | 7.9 | 8.4 | 7.4 | 2.6 | 0.5 | 0 | 0 | 0 | 0 | 2.3 | 5.5 | 5.1 | 39.7 |
| Average relative humidity (%) | 58 | 60 | 58 | 55 | 59 | 66 | 74 | 78 | 79 | 73 | 62 | 57 | 65 |
| Mean monthly sunshine hours | 187.4 | 170.5 | 195.4 | 213.7 | 226.5 | 219.4 | 208.4 | 187.4 | 149.4 | 170.3 | 182.9 | 193.1 | 2,304.4 |
| Percent possible sunshine | 60 | 55 | 52 | 54 | 52 | 51 | 47 | 45 | 41 | 49 | 60 | 64 | 53 |
| Source: China Meteorological Administration[4][5] | |||||||||||||
References
- ^ Gladney (1991), pp. 119-120
- ^ a b Gladney (1991), p. 39
- ^ 2023年统计用区划代码和城乡划分代码:泾源县 (in Simplified Chinese). National Bureau of Statistics of China.
- ^ 中国气象数据网 – WeatherBk Data (in Simplified Chinese). China Meteorological Administration. Retrieved 26 August 2023.
- ^ 中国气象数据网 (in Simplified Chinese). China Meteorological Administration. Retrieved 26 August 2023.
- Dru C. Gladney, Muslim Chinese: Ethnic Nationalism in the People's Republic. 1st ed.: Harvard University Press, 1991, ISBN 0-674-59495-9; 2nd ed., 1996. ISBN 0-674-59497-5.
| International | |
|---|---|
| National | |
This Ningxia location article is a stub. You can help Wikipedia by expanding it. |