
Geneva County | |
|---|---|
 The Geneva County Courthouse in Geneva | |
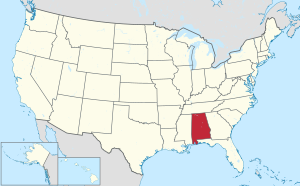
 Location within the U.S. state of Alabama | |
 Alabama's location within the U.S. | |
| Coordinates: 31°05′32″N 85°50′18″W / 31.0922°N 85.8383°W | |
| Country | |
| State | |
| Founded | December 26, 1868 |
| Named for | Geneva, New York |
| Seat | Geneva |
| Largest city | Geneva |
| Area | |
| • Total | 579 sq mi (1,500 km2) |
| • Land | 574 sq mi (1,490 km2) |
| • Water | 4.5 sq mi (12 km2) 0.8% |
| Population (2020) | |
| • Total | 26,659 |
| • Estimate (2023) | 26,988 |
| • Density | 46/sq mi (18/km2) |
| Time zone | UTC−6 (Central) |
| • Summer (DST) | UTC−5 (CDT) |
| Congressional district | 2nd |
| Website | genevacountyal |
| |
Geneva County is a county located in the southeastern part of the U.S. state of Alabama. As of the 2020 census, the population was 26,659.[1] Its county seat is Geneva.[2] The county was named after its county seat, which in turn was named after Geneva, New York which was named after Geneva, Switzerland, by Walter H. Yonge, an early town resident and Swiss native.[3] Geneva County is a dry county. However, beer and wine are sold in the city limits of Geneva, Samson, Slocomb, and most recently in Hartford, after residents voted to become wet in a 2022 election.
Geneva County is part of the Dothan, AL Metropolitan Statistical Area.
YouTube Encyclopedic
-
1/2Views:462 288561
-
Top 10 Worst Towns in Alabama. Don't live in these towns!
-
School Bus Perspective: Deteriorating Roads in Geneva County, Alabama
Transcription
History
Geneva County was established on December 26, 1868.
The county was declared a disaster area in September 1979 due to damage from Hurricane Frederic.
On March 10, 2009, a gunman, identified as Michael McLendon, went on a shooting spree at nine locations in Geneva County from the town of Samson to the city of Geneva, killing ten people and wounding six others. McLendon entered his former place of employment, Reliable Metal Products on the northeastern side of Geneva, where he killed himself.
Geography
According to the United States Census Bureau, the county has a total area of 579 square miles (1,500 km2), of which 574 square miles (1,490 km2) is land and 4.5 square miles (12 km2) (0.8%) is water.[4] The county is located in the Wiregrass region of southeast Alabama.
It is the fifth-smallest county in Alabama by total area.
Major highways
 State Route 27
 State Route 52
 State Route 54
 State Route 85
 State Route 87
 State Route 103
 State Route 123
 State Route 153
 State Route 167
 State Route 196
Adjacent counties
- Dale County (north-northeast)
- Houston County (east)
- Jackson County, Florida (southeast)
- Holmes County, Florida (south)
- Walton County, Florida (southwest)
- Covington County (west)
- Coffee County (north-northwest)
Demographics
| Census | Pop. | Note | %± |
|---|---|---|---|
| 1870 | 2,959 | — | |
| 1880 | 4,342 | 46.7% | |
| 1890 | 10,690 | 146.2% | |
| 1900 | 19,096 | 78.6% | |
| 1910 | 26,230 | 37.4% | |
| 1920 | 29,315 | 11.8% | |
| 1930 | 30,104 | 2.7% | |
| 1940 | 29,172 | −3.1% | |
| 1950 | 25,899 | −11.2% | |
| 1960 | 22,310 | −13.9% | |
| 1970 | 21,924 | −1.7% | |
| 1980 | 24,253 | 10.6% | |
| 1990 | 23,647 | −2.5% | |
| 2000 | 25,764 | 9.0% | |
| 2010 | 26,790 | 4.0% | |
| 2020 | 26,659 | −0.5% | |
| 2023 (est.) | 26,988 | [5] | 1.2% |
| U.S. Decennial Census[6] 1790–1960[7] 1900–1990[8] 1990–2000[9] 2010–2020[1] | |||
2020
| Race / Ethnicity | Pop 2000[10] | Pop 2010[11] | Pop 2020[12] | % 2000 | % 2010 | % 2020 |
|---|---|---|---|---|---|---|
| White alone (NH) | 22,181 | 22,692 | 21,654 | 86.09% | 84.70% | 81.23% |
| Black or African American alone (NH) | 2,725 | 2,523 | 2,231 | 10.58% | 9.42% | 8.37% |
| Native American or Alaska Native alone (NH) | 187 | 197 | 166 | 0.73% | 0.74% | 0.62% |
| Asian alone (NH) | 32 | 64 | 86 | 0.12% | 0.24% | 0.32% |
| Pacific Islander alone (NH) | 6 | 8 | 7 | 0.02% | 0.03% | 0.03% |
| Some Other Race alone (NH) | 11 | 15 | 72 | 0.04% | 0.06% | 0.27% |
| Mixed Race/Multi-Racial (NH) | 169 | 371 | 1,147 | 0.66% | 1.38% | 4.30% |
| Hispanic or Latino (any race) | 453 | 920 | 1,296 | 1.76% | 3.43% | 4.86% |
| Total | 25,764 | 26,790 | 26,659 | 100.00% | 100.00% | 100.00% |
As of the 2020 United States census, there were 26,659 people, 10,383 households, and 6,902 families residing in the county.
2010
The 2010 United States census has the breakdown as:
- 86.3% White
- 9.5% Black
- 0.8% Native American
- 0.3% Asian
- 0.0% Native Hawaiian or Pacific Islander
- 1.6% Two or more races
- 3.4% Hispanic or Latino (of any race)
2000
As of the census[13] of 2000, there were 25,764 people, 10,477 households, and 7,459 families residing in the county. The population density was 45 people per square mile (17 people/km2). There were 12,115 housing units at an average density of 21 units per square mile (8.1 units/km2). The racial makeup of the county was 87.11% White, 10.65% Black or African American, 0.76% Native American, 0.12% Asian, 0.02% Pacific Islander, 0.62% from other races, and 0.72% from two or more races. 1.76% of the population were Hispanic or Latino of any race.
There were 10,477 households, out of which 30.60% had children under the age of 18 living with them, 56.40% were married couples living together, 11.00% had a female householder with no husband present, and 28.80% were non-families. 26.30% of all households were made up of individuals, and 12.30% had someone living alone who was 65 years of age or older. The average household size was 2.43 and the average family size was 2.92.
In the county, the population was spread out, with 24.00% under the age of 18, 7.50% from 18 to 24, 26.80% from 25 to 44, 25.30% from 45 to 64, and 16.30% who were 65 years of age or older. The median age was 39 years. For every 100 females, there were 94.70 males. For every 100 women age 18 and over, there were 90.00 men.
The median income for a household in the county was $26,448, and the median income for a family was $32,563. Males had a median income of $26,018 versus $19,341 for females. The per capita income for the county was $14,620. About 15.90% of families and 19.60% of the population were below the poverty line, including 27.20% of those under age 18 and 21.80% of those age 65 or over.
Communities
Cities
Towns
- Black
- Coffee Springs
- Malvern
- Taylor (partly in Houston County)
Census-designated place
Unincorporated communities
Government and politics
Much like the state and the rest of the Deep South, Geneva County was locked for the Democrats before 1964, until Herbert Hoover won against Democrat nominee Al Smith in 1928 by 48 votes. However, ever since 1980, Geneva County has been a Republican stronghold. The last Democrat to carry the county was Deep South native Jimmy Carter in 1976.
Geneva is also noteworthy for being the best county in the country for Alabama native George Wallace in the 1968 election,[14] where his main support was from the Deep South and was strongest in the Wiregrass and Piney Woods regions.
| Year | Republican | Democratic | Third party | |||
|---|---|---|---|---|---|---|
| No. | % | No. | % | No. | % | |
| 2020 | 10,848 | 86.47% | 1,595 | 12.71% | 102 | 0.81% |
| 2016 | 9,994 | 85.00% | 1,525 | 12.97% | 239 | 2.03% |
| 2012 | 9,175 | 80.97% | 2,039 | 17.99% | 117 | 1.03% |
| 2008 | 9,417 | 80.78% | 2,134 | 18.31% | 106 | 0.91% |
| 2004 | 8,342 | 79.30% | 2,113 | 20.09% | 65 | 0.62% |
| 2000 | 6,588 | 68.92% | 2,769 | 28.97% | 202 | 2.11% |
| 1996 | 4,725 | 52.60% | 3,174 | 35.33% | 1,084 | 12.07% |
| 1992 | 4,843 | 49.08% | 3,622 | 36.71% | 1,402 | 14.21% |
| 1988 | 5,703 | 67.32% | 2,685 | 31.69% | 84 | 0.99% |
| 1984 | 6,308 | 70.00% | 2,330 | 25.86% | 373 | 4.14% |
| 1980 | 4,747 | 49.30% | 4,703 | 48.85% | 178 | 1.85% |
| 1976 | 2,663 | 30.47% | 5,983 | 68.46% | 93 | 1.06% |
| 1972 | 5,851 | 84.33% | 1,049 | 15.12% | 38 | 0.55% |
| 1968 | 284 | 3.31% | 380 | 4.43% | 7,917 | 92.26% |
| 1964 | 4,502 | 80.74% | 0 | 0.00% | 1,074 | 19.26% |
| 1960 | 1,502 | 32.95% | 3,050 | 66.90% | 7 | 0.15% |
| 1956 | 1,179 | 28.63% | 2,841 | 68.99% | 98 | 2.38% |
| 1952 | 950 | 25.98% | 2,703 | 73.93% | 3 | 0.08% |
| 1948 | 286 | 13.47% | 0 | 0.00% | 1,837 | 86.53% |
| 1944 | 385 | 16.01% | 2,004 | 83.36% | 15 | 0.62% |
| 1940 | 364 | 12.37% | 2,565 | 87.19% | 13 | 0.44% |
| 1936 | 295 | 10.00% | 2,652 | 89.93% | 2 | 0.07% |
| 1932 | 270 | 9.53% | 2,559 | 90.33% | 4 | 0.14% |
| 1928 | 1,533 | 50.80% | 1,485 | 49.20% | 0 | 0.00% |
| 1924 | 477 | 27.85% | 1,191 | 69.53% | 45 | 2.63% |
| 1920 | 1,088 | 41.65% | 1,488 | 56.97% | 36 | 1.38% |
| 1916 | 713 | 35.42% | 1,265 | 62.84% | 35 | 1.74% |
| 1912 | 99 | 6.44% | 891 | 57.93% | 548 | 35.63% |
| 1908 | 500 | 32.87% | 854 | 56.15% | 167 | 10.98% |
| 1904 | 473 | 31.12% | 743 | 48.88% | 304 | 20.00% |
| 1900 | 657 | 44.97% | 679 | 46.48% | 125 | 8.56% |
| 1896 | 46 | 3.40% | 1,246 | 92.16% | 60 | 4.44% |
| 1892 | 0 | 0.00% | 797 | 52.61% | 718 | 47.39% |
| 1888 | 5 | 0.63% | 794 | 99.37% | 0 | 0.00% |
See also
- National Register of Historic Places listings in Geneva County, Alabama
- Properties on the Alabama Register of Landmarks and Heritage in Geneva County, Alabama
References
- ^ a b "State & County QuickFacts". United States Census Bureau. Retrieved September 12, 2023.
- ^ "Find a County". National Association of Counties. Archived from the original on May 31, 2011. Retrieved June 7, 2011.
- ^ "Geneva County". Alabama Department of Archives and History. June 4, 2009. Archived from the original on October 8, 2017. Retrieved August 1, 2009.
- ^ "2010 Census Gazetteer Files". United States Census Bureau. August 22, 2012. Retrieved August 22, 2015.
- ^ "Annual Estimates of the Resident Population for Counties: April 1, 2020 to July 1, 2023". United States Census Bureau. Retrieved March 27, 2024.
- ^ "U.S. Decennial Census". United States Census Bureau. Retrieved August 22, 2015.
- ^ "Historical Census Browser". University of Virginia Library. Retrieved August 22, 2015.
- ^ Forstall, Richard L., ed. (March 24, 1995). "Population of Counties by Decennial Census: 1900 to 1990". United States Census Bureau. Retrieved August 22, 2015.
- ^ "Census 2000 PHC-T-4. Ranking Tables for Counties: 1990 and 2000" (PDF). United States Census Bureau. April 2, 2001. Retrieved August 22, 2015.
- ^ "P004 HISPANIC OR LATINO, AND NOT HISPANIC OR LATINO BY RACE – 2000: DEC Summary File 1 – Geneva County, Alabama". United States Census Bureau.
- ^ "P2 HISPANIC OR LATINO, AND NOT HISPANIC OR LATINO BY RACE – 2010: DEC Redistricting Data (PL 94-171) – Geneva County, Alabama". United States Census Bureau.
- ^ "P2 HISPANIC OR LATINO, AND NOT HISPANIC OR LATINO BY RACE - 2020: DEC Redistricting Data (PL 94-171) – Geneva County, Alabama". United States Census Bureau.
- ^ "U.S. Census website". United States Census Bureau. Retrieved May 14, 2011.
- ^ "1968 Presidential Election Statistics". Dave Leip’s U.S. Election Atlas.
- ^ "Dave Leip's Atlas of U.S. Presidential Elections". Retrieved November 16, 2016.
External links
Places adjacent to Geneva County, Alabama | ||||||||||||||||
|---|---|---|---|---|---|---|---|---|---|---|---|---|---|---|---|---|
| ||||||||||||||||
Municipalities and communities of Geneva County, Alabama, United States | ||
|---|---|---|
| Cities |  | |
| Towns | ||
| CDP | ||
| Unincorporated communities | ||
| Footnotes | ‡This populated place also has portions in an adjacent county or counties | |
| International | |
|---|---|
| National | |
31°05′32″N 85°50′18″W / 31.09222°N 85.83833°W