
Functional data analysis (FDA) is a branch of statistics that analyses data providing information about curves, surfaces or anything else varying over a continuum. In its most general form, under an FDA framework, each sample element of functional data is considered to be a random function. The physical continuum over which these functions are defined is often time, but may also be spatial location, wavelength, probability, etc. Intrinsically, functional data are infinite dimensional. The high intrinsic dimensionality of these data brings challenges for theory as well as computation, where these challenges vary with how the functional data were sampled. However, the high or infinite dimensional structure of the data is a rich source of information and there are many interesting challenges for research and data analysis.
YouTube Encyclopedic
-
1/5Views:4 55370 3821 1956 1305 824
-
Discrete vs Continuous Biomechanical Data Analysis | Dr Todd Pataky
-
Data Analysis 4: Data Transformation - Computerphile
-
Functions with Parameters Lesson 14.10 Tutorial Code.org CS Discoveries Physical Computing Unit 6
-
Lecture 4: Smoothing Splines
-
CHiP-Seq Analysis- Day 1
Transcription
History
Functional data analysis has roots going back to work by Grenander and Karhunen in the 1940s and 1950s.[1][2][3][4] They considered the decomposition of square-integrable continuous time stochastic process into eigencomponents, now known as the Karhunen-Loève decomposition. A rigorous analysis of functional principal components analysis was done in the 1970s by Kleffe, Dauxois and Pousse including results about the asymptotic distribution of the eigenvalues.[5][6] More recently in the 1990s and 2000s the field has focused more on applications and understanding the effects of dense and sparse observations schemes. The term "Functional Data Analysis" was coined by James O. Ramsay.[7]
Mathematical formalism
Random functions can be viewed as random elements taking values in a Hilbert space, or as a stochastic process. The former is mathematically convenient, whereas the latter is somewhat more suitable from an applied perspective. These two approaches coincide if the random functions are continuous and a condition called mean-squared continuity is satisfied.[8]
Hilbertian random variables
In the Hilbert space viewpoint, one considers an -valued random element , where is a separable Hilbert space such as the space of square-integrable functions . Under the integrability condition that , one can define the mean of as the unique element satisfying


![{\displaystyle L^{2}[0,1]}](https://wikimedia.org/api/rest_v1/media/math/render/svg/0cec70e845808e22e359ab32ed7c3c0d946fab70)


This formulation is the Pettis integral but the mean can also be defined as Bochner integral . Under the integrability condition that is finite, the covariance operator of is a linear operator that is uniquely defined by the relation


![{\displaystyle {\mathcal {C}}h=\mathbb {E} [\langle h,X-\mu \rangle (X-\mu )],\qquad h\in H,}](https://wikimedia.org/api/rest_v1/media/math/render/svg/4d78d952144a26c69cacb4b333a3fd5a41ec2d5c)
or, in tensor form, . The spectral theorem allows to decompose as the Karhunen-Loève decomposition
![{\displaystyle {\mathcal {C}}=\mathbb {E} [(X-\mu )\otimes (X-\mu )]}](https://wikimedia.org/api/rest_v1/media/math/render/svg/2ddfd0d1b91b177d50f38fb344a433984e5c602b)

where are eigenvectors of , corresponding to the nonnegative eigenvalues of , in a non-increasing order. Truncating this infinite series to a finite order underpins functional principal component analysis.


Stochastic processes
The Hilbertian point of view is mathematically convenient, but abstract; the above considerations do not necessarily even view as a function at all, since common choices of like and Sobolev spaces consist of equivalence classes, not functions. The stochastic process perspective views as a collection of random variables
![{\displaystyle \{X(t)\}_{t\in [0,1]}}](https://wikimedia.org/api/rest_v1/media/math/render/svg/45ca3a75461bffe5a913ccc863136879bd6964af)
indexed by the unit interval (or more generally interval ). The mean and covariance functions are defined in a pointwise manner as

![{\displaystyle \mu (t)=\mathbb {E} X(t),\qquad \Sigma (s,t)={\textrm {Cov}}(X(s),X(t)),\qquad s,t\in [0,1]}](https://wikimedia.org/api/rest_v1/media/math/render/svg/929a6a917012f2b12e339f93d89c52e098ffd92f)
(if for all ).
![{\displaystyle \mathbb {E} [X(t)^{2}]<\infty }](https://wikimedia.org/api/rest_v1/media/math/render/svg/0ddc1d5a6fc8a9e9ec013b6f80fefb715b124137)
![{\displaystyle t\in [0,1]}](https://wikimedia.org/api/rest_v1/media/math/render/svg/31a5c18739ff04858eecc8fec2f53912c348e0e5)
Under the mean square continuity, and are continuous functions and then the covariance function defines a covariance operator given by


-
(1)
-

The spectral theorem applies to , yielding eigenpairs , so that in tensor product notation writes


Moreover, since is continuous for all , all the are continuous. Mercer's theorem then states that


![{\displaystyle \sup _{s,t\in [0,1]}\left|\Sigma (s,t)-\sum _{j=1}^{K}\lambda _{j}\varphi _{j}(s)\varphi _{j}(t)\right|\to 0,\qquad K\to \infty .}](https://wikimedia.org/api/rest_v1/media/math/render/svg/9727fa95c893ad324ae2e588769d644fa65aa59e)
Finally, under the extra assumption that has continuous sample paths, namely that with probability one, the random function is continuous, the Karhunen-Loève expansion above holds for and the Hilbert space machinery can be subsequently applied. Continuity of sample paths can be shown using Kolmogorov continuity theorem.
![{\displaystyle X:[0,1]\to \mathbb {R} }](https://wikimedia.org/api/rest_v1/media/math/render/svg/f579a095939bfe51f43ca8bdf3904f503f5116e2)
Functional data designs
Functional data are considered as realizations of a stochastic process that is an process on a bounded and closed interval with mean function and covariance function . The realizations of the process for the i-th subject is , and the sample is assumed to consist of independent subjects. The sampling schedule may vary across subjects, denoted as for the i-th subject. The corresponding i-th observation is denoted as , where . In addition, the measurement of is assumed to have random noise with and , which are independent across and .
![{\displaystyle X(t),\ t\in [0,1]}](https://wikimedia.org/api/rest_v1/media/math/render/svg/16ccfd4a54f8727a9dcf6ac67a09878e82537a0c)

![{\displaystyle [0,1]}](https://wikimedia.org/api/rest_v1/media/math/render/svg/738f7d23bb2d9642bab520020873cccbef49768d)


1. Fully observed functions without noise at arbitrarily dense grid
Measurements available for all


Often unrealistic but mathematically convenient.
Real life example: Tecator spectral data.[7]
2. Densely sampled functions with noisy measurements (dense design)
Measurements , where are recorded on a regular grid,


, and applies to typical functional data.


Real life example: Berkeley Growth Study Data and Stock data
3. Sparsely sampled functions with noisy measurements (longitudinal data)
Measurements , where are random times and their number per subject is random and finite.

Real life example: CD4 count data for AIDS patients.[9]
Functional principal component analysis
Functional principal component analysis (FPCA) is the most prevalent tool in FDA, partly because FPCA facilitates dimension reduction of the inherently infinite-dimensional functional data to finite-dimensional random vector of scores. More specifically, dimension reduction is achieved by expanding the underlying observed random trajectories in a functional basis consisting of the eigenfunctions of the covariance operator on . Consider the covariance operator as in (1), which is a compact operator on Hilbert space.

![{\displaystyle {\mathcal {C}}:L^{2}[0,1]\rightarrow L^{2}[0,1]}](https://wikimedia.org/api/rest_v1/media/math/render/svg/3721486b6ac138647656517335473eb12c30da03)
By Mercer's theorem, the kernel of , i.e., the covariance function , has spectral decomposition , where the series convergence is absolute and uniform, and are real-valued nonnegative eigenvalues in descending order with the corresponding orthonormal eigenfunctions . By the Karhunen–Loève theorem, the FPCA expansion of an underlying random trajectory is , where are the functional principal components (FPCs), sometimes referred to as scores. The Karhunen–Loève expansion facilitates dimension reduction in the sense that the partial sum converges uniformly, i.e., as and thus the partial sum with a large enough yields a good approximation to the infinite sum. Thereby, the information in is reduced from infinite dimensional to a -dimensional vector with the approximated process:


![{\displaystyle \sup _{t\in [0,1]}\mathbb {E} [X_{i}(t)-\mu (t)-\sum _{k=1}^{K}A_{ik}\varphi _{k}(t)]^{2}\rightarrow 0}](https://wikimedia.org/api/rest_v1/media/math/render/svg/98b33e335d769c44209b4a1abf95262ebcc1f1b2)


-
(2)
-

Other popular bases include spline, Fourier series and wavelet bases. Important applications of FPCA include the modes of variation and functional principal component regression.
Functional linear regression models
Functional linear models can be viewed as an extension of the traditional multivariate linear models that associates vector responses with vector covariates. The traditional linear model with scalar response and vector covariate can be expressed as


-
(3)
-

where denotes the inner product in Euclidean space, and denote the regression coefficients, and is a zero mean finite variance random error (noise). Functional linear models can be divided into two types based on the responses.


Functional regression models with scalar response
Replacing the vector covariate and the coefficient vector in model (3) by a centered functional covariate and coefficient function for and replacing the inner product in Euclidean space by that in Hilbert space , one arrives at the functional linear model


-
(4)
-

The simple functional linear model (4) can be extended to multiple functional covariates, , also including additional vector covariates , where , by


-
(5)
-

where is regression coefficient for , the domain of is , is the centered functional covariate given by , and is regression coefficient function for , for . Models (4) and (5) have been studied extensively.[10][11][12]


Functional regression models with functional response
Consider a functional response on and multiple functional covariates , , . Two major models have been considered in this setup.[13][7] One of these two models, generally referred to as functional linear model (FLM), can be written as:


-
(6)
-
![{\displaystyle Y(s)=\alpha _{0}(s)+\sum _{j=1}^{p}\int _{0}^{1}\alpha _{j}(s,t)X_{j}^{c}(t)\,dt+\varepsilon (s),\ {\text{for}}\ s\in [0,1]}](https://wikimedia.org/api/rest_v1/media/math/render/svg/9c808ba95d480095cbbc0b8b7d1635bcf5046293)
where is the functional intercept, for , is a centered functional covariate on , is the corresponding functional slopes with same domain, respectively, and is usually a random process with mean zero and finite variance.[13] In this case, at any given time , the value of , i.e., , depends on the entire trajectories of . Model (6) has been studied extensively.[14][15][16][17][18]


![{\displaystyle s\in [0,1]}](https://wikimedia.org/api/rest_v1/media/math/render/svg/aff1a54fbbee4a2677039524a5139e952fa86eb9)


Function-on-scalar regression
In particular, taking as a constant function yields a special case of model (6)

![{\displaystyle Y(s)=\alpha _{0}(s)+\sum _{j=1}^{p}X_{j}\alpha _{j}(s)+\varepsilon (s),\ {\text{for}}\ s\in [0,1],}](https://wikimedia.org/api/rest_v1/media/math/render/svg/f4b9b9588075901036c260b91f88582557c300e9)
Concurrent regression models
This model is given by,
-
(7)
-
![{\displaystyle Y(s)=\beta _{0}(s)+\sum _{j=1}^{p}\beta _{j}(s)X_{j}(s)+\varepsilon (s),\ {\text{for}}\ s\in [0,1],}](https://wikimedia.org/api/rest_v1/media/math/render/svg/67f55ca28ff663cc83418173f95c1089b6212e7a)
where are functional covariates on , are the coefficient functions defined on the same interval and is usually assumed to be a random process with mean zero and finite variance.[13] This model assumes that the value of depends on the current value of only and not the history or future value. Hence, it is a "concurrent regression model", which is also referred as "varying-coefficient" model. Further, various estimation methods have been proposed.[19][20][21][22][23][24]


Functional nonlinear regression models
Direct nonlinear extensions of the classical functional linear regression models (FLMs) still involve a linear predictor, but combine it with a nonlinear link function, analogous to the idea of generalized linear model from the conventional linear model. Developments towards fully nonparametric regression models for functional data encounter problems such as curse of dimensionality. In order to bypass the "curse" and the metric selection problem, we are motivated to consider nonlinear functional regression models, which are subject to some structural constraints but do not overly infringe flexibility. One desires models that retain polynomial rates of convergence, while being more flexible than, say, functional linear models. Such models are particularly useful when diagnostics for the functional linear model indicate lack of fit, which is often encountered in real life situations. In particular, functional polynomial models, functional single and multiple index models and functional additive models are three special cases of functional nonlinear regression models.
Functional polynomial regression models
Functional polynomial regression models may be viewed as a natural extension of the Functional Linear Models (FLMs) with scalar responses, analogous to extending linear regression model to polynomial regression model. For a scalar response and a functional covariate with domain and the corresponding centered predictor processes , the simplest and the most prominent member in the family of functional polynomial regression models is the quadratic functional regression[25] given as follows,


![{\displaystyle [0,1]\times [0,1]}](https://wikimedia.org/api/rest_v1/media/math/render/svg/92f35a051af39d8299688d7c4a63e39ee5f95c8b)

Functional single and multiple index models
A functional multiple index model is given as below, with symbols having their usual meanings as formerly described,


Functional additive models (FAMs)
For a given orthonormal basis on , we can expand on the domain .


A functional linear model with scalar responses (see (3)) can thus be written as follows,


![{\displaystyle g:[0,1]\times \mathbb {R} \longrightarrow \mathbb {R} }](https://wikimedia.org/api/rest_v1/media/math/render/svg/4a6d29882cd138d3e9fe07e3c53959bdd1179663)
![{\displaystyle \mathbb {E} [g(t,X(t))]=0}](https://wikimedia.org/api/rest_v1/media/math/render/svg/487837c1630d29d8c48646ecae9f1db15cad3b27)
Generalized functional linear model
An obvious and direct extension of FLMs with scalar responses (see (3)) is to add a link function leading to a generalized functional linear model (GFLM)[30] in analogy to the generalized linear model (GLM). The three components of the GFLM are:
- Linear predictor ; [systematic component]
- Variance function , where is the conditional mean; [random component]
- Link function connecting the conditional mean and the linear predictor through . [systematic component]


Clustering and classification of functional data
For vector-valued multivariate data, k-means partitioning methods and hierarchical clustering are two main approaches. These classical clustering concepts for vector-valued multivariate data have been extended to functional data. For clustering of functional data, k-means clustering methods are more popular than hierarchical clustering methods. For k-means clustering on functional data, mean functions are usually regarded as the cluster centers. Covariance structures have also been taken into consideration.[31] Besides k-means type clustering, functional clustering[32] based on mixture models is also widely used in clustering vector-valued multivariate data and has been extended to functional data clustering.[33][34][35][36][37] Furthermore, Bayesian hierarchical clustering also plays an important role in the development of model-based functional clustering.[38][39][40][41]
Functional classification assigns a group membership to a new data object either based on functional regression or functional discriminant analysis. Functional data classification methods based on functional regression models use class levels as responses and the observed functional data and other covariates as predictors. For regression based functional classification models, functional generalized linear models or more specifically, functional binary regression, such as functional logistic regression for binary responses, are commonly used classification approaches. More generally, the generalized functional linear regression model based on the FPCA approach is used.[42] Functional Linear Discriminant Analysis (FLDA) has also been considered as a classification method for functional data.[43][44][45][46][47] Functional data classification involving density ratios has also been proposed.[48] A study of the asymptotic behavior of the proposed classifiers in the large sample limit shows that under certain conditions the misclassification rate converges to zero, a phenomenon that has been referred to as "perfect classification".[49]
Time warping
Motivations
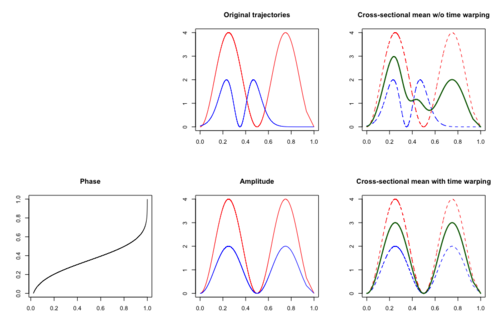
In addition to amplitude variation,[50] time variation may also be assumed to present in functional data. Time variation occurs when the subject-specific timing of certain events of interest varies among subjects. One classical example is the Berkeley Growth Study Data,[51] where the amplitude variation is the growth rate and the time variation explains the difference in children's biological age at which the pubertal and the pre-pubertal growth spurt occurred. In the presence of time variation, the cross-sectional mean function may not be an efficient estimate as peaks and troughs are located randomly and thus meaningful signals may be distorted or hidden.
Time warping, also known as curve registration,[52] curve alignment or time synchronization, aims to identify and separate amplitude variation and time variation. If both time and amplitude variation are present, then the observed functional data can be modeled as , where is a latent amplitude function and is a latent time warping function that corresponds to a cumulative distribution function. The time warping functions are assumed to be invertible and to satisfy .

![{\displaystyle Y_{i}(t)=X_{i}[h_{i}^{-1}(t)],t\in [0,1]}](https://wikimedia.org/api/rest_v1/media/math/render/svg/4936c8e9cb54b7bf9a82083f5118c61b473f8cc4)


The simplest case of a family of warping functions to specify phase variation is linear transformation, that is , which warps the time of an underlying template function by subjected-specific shift and scale. More general class of warping functions includes diffeomorphisms of the domain to itself, that is, loosely speaking, a class of invertible functions that maps the compact domain to itself such that both the function and its inverse are smooth. The set of linear transformation is contained in the set of diffeomorphisms.[53] One challenge in time warping is identifiability of amplitude and phase variation. Specific assumptions are required to break this non-identifiability.

Methods
Earlier approaches include dynamic time warping (DTW) used for applications such as speech recognition.[54] Another traditional method for time warping is landmark registration,[55][56] which aligns special features such as peak locations to an average location. Other relevant warping methods include pairwise warping,[57] registration using distance[53] and elastic warping.[58]

Dynamic time warping
The template function is determined through an iteration process, starting from cross-sectional mean, performing registration and recalculating the cross-sectional mean for the warped curves, expecting convergence after a few iterations. DTW minimizes a cost function through dynamic programming. Problems of non-smooth differentiable warps or greedy computation in DTW can be resolved by adding a regularization term to the cost function.
Landmark registration
Landmark registration (or feature alignment) assumes well-expressed features are present in all sample curves and uses the location of such features as a gold-standard. Special features such as peak or trough locations in functions or derivatives are aligned to their average locations on the template function.[53] Then the warping function is introduced through a smooth transformation from the average location to the subject-specific locations. A problem of landmark registration is that the features may be missing or hard to identify due to the noise in the data.
Extensions
So far we considered scalar valued stochastic process, , defined on one dimensional time domain.

Multidimensional domain of
The domain of can be in , for example the data could be a sample of random surfaces.[59][60]

Multivariate stochastic process
The range set of the stochastic process may be extended from to [61][62][63] and further to nonlinear manifolds,[64] Hilbert spaces[65] and eventually to metric spaces.[59]

Python packages
There are Python packages to work with functional data, and its representation, perform exploratory analysis, or preprocessing, and among other tasks such as inference, classification, regression or clustering of functional data.
R packages
Some packages can handle functional data under both dense and longitudinal designs.
See also
- Functional principal component analysis
- Karhunen–Loève theorem
- Modes of variation
- Functional regression
- Generalized functional linear model
- Stochastic processes
- Lp space
- Variance function
Further reading
- Ramsay, J. O. and Silverman, B.W. (2005) Functional data analysis, 2nd ed., New York: Springer, ISBN 0-387-40080-X
- Horvath, L. and Kokoszka, P. (2012) Inference for Functional Data with Applications, New York: Springer, ISBN 978-1-4614-3654-6
- Hsing, T. and Eubank, R. (2015) Theoretical Foundations of Functional Data Analysis, with an Introduction to Linear Operators, Wiley series in probability and statistics, John Wiley & Sons, Ltd, ISBN 978-0-470-01691-6
- Morris, J. (2015) Functional Regression, Annual Review of Statistics and Its Application, Vol. 2, 321 - 359, https://doi.org/10.1146/annurev-statistics-010814-020413
- Wang et al. (2016) Functional Data Analysis, Annual Review of Statistics and Its Application, Vol. 3, 257-295, https://doi.org/10.1146/annurev-statistics-041715-033624
References
- ^ Grenander, U. (1950). "Stochastic processes and statistical inference". Arkiv för Matematik. 1 (3): 195–277. Bibcode:1950ArM.....1..195G. doi:10.1007/BF02590638. S2CID 120451372.
- ^ Rice, JA; Silverman, BW. (1991). "Estimating the mean and covariance structure nonparametrically when the data are curves". Journal of the Royal Statistical Society. 53 (1): 233–243.
- ^ Müller, HG. (2016). "Peter Hall, functional data analysis and random objects". Annals of Statistics. 44 (5): 1867–1887. doi:10.1214/16-AOS1492.
- ^ Karhunen, K (1946). Zur Spektraltheorie stochastischer Prozesse. Annales Academiae scientiarum Fennicae.
- ^ Kleffe, J. (1973). "Principal components of random variables with values in a seperable hilbert space". Mathematische Operationsforschung und Statistik. 4 (5): 391–406. doi:10.1080/02331887308801137.
- ^ Dauxois, J; Pousse, A; Romain, Y. (1982). "Asymptotic theory for the principal component analysis of a vector random function: Some applications to statistical inference". Journal of Multivariate Analysis. 12 (1): 136–154. doi:10.1016/0047-259X(82)90088-4.
- ^ a b c d e Ramsay, J; Silverman, BW. (2005). Functional Data Analysis, 2nd ed. Springer.
- ^ Hsing, T; Eubank, R (2015). Theoretical Foundations of Functional Data Analysis, with an Introduction to Linear Operators. Wiley Series in Probability and Statistics.
- ^ Shi, M; Weiss, RE; Taylor, JMG. (1996). "An analysis of paediatric CD4 counts for acquired immune deficiency syndrome using flexible random curves". Journal of the Royal Statistical Society. Series C (Applied Statistics). 45 (2): 151–163.
- ^ Hilgert, N; Mas, A; Verzelen, N. (2013). "Minimax adaptive tests for the functional linear model". Annals of Statistics. 41 (2): 838–869. arXiv:1206.1194. doi:10.1214/13-AOS1093. S2CID 13119710.
- ^ Kong, D; Xue, K; Yao, F; Zhang, HH. (2016). "Partially functional linear regression in high dimensions". Biometrika. 103 (1): 147–159. doi:10.1093/biomet/asv062.
- ^ Horváth, L; Kokoszka, P. (2012). Inference for functional data with applications. Springer Series in Statistics. Springer-Verlag.
- ^ a b c d Wang, JL; Chiou, JM; Müller, HG. (2016). "Functional data analysis". Annual Review of Statistics and Its Application. 3 (1): 257–295. Bibcode:2016AnRSA...3..257W. doi:10.1146/annurev-statistics-041715-033624. S2CID 13709250.
- ^ Ramsay, JO; Dalzell, CJ. (1991). "Some tools for functional data analysis". Journal of the Royal Statistical Society, Series B (Methodological). 53 (3): 539–561. doi:10.1111/j.2517-6161.1991.tb01844.x. S2CID 118960346.
- ^ Malfait, N; Ramsay, JO. (2003). "The historical functional linear model". The Canadian Journal of Statistics. 31 (2): 115–128. doi:10.2307/3316063. JSTOR 3316063. S2CID 55092204.
- ^ He, G; Müller, HG; Wang, JL. (2003). "Functional canonical analysis for square integrable stochastic processes". Journal of Multivariate Analysis. 85 (1): 54–77. doi:10.1016/S0047-259X(02)00056-8.
- ^ a b Yao, F; Müller, HG; Wang, JL. (2005). "Functional data analysis for sparse longitudinal data". Journal of the American Statistical Association. 100 (470): 577–590. doi:10.1198/016214504000001745. S2CID 1243975.
- ^ He, G; Müller, HG; Wang, JL; Yang, WJ. (2010). "Functional linear regression via canonical analysis". Journal of Multivariate Analysis. 16 (3): 705–729. arXiv:1102.5212. doi:10.3150/09-BEJ228. S2CID 17843044.
- ^ Fan, J; Zhang, W. (1999). "Statistical estimation in varying coefficient models". The Annals of Statistics. 27 (5): 1491–1518. doi:10.1214/aos/1017939139. S2CID 16758288.
- ^ Wu, CO; Yu, KF. (2002). "Nonparametric varying-coefficient models for the analysis of longitudinal data". International Statistical Review. 70 (3): 373–393. doi:10.1111/j.1751-5823.2002.tb00176.x. S2CID 122007787.
- ^ Huang, JZ; Wu, CO; Zhou, L. (2002). "Varying-coefficient models and basis function approximations for the analysis of repeated measurements". Biometrika. 89 (1): 111–128. doi:10.1093/biomet/89.1.111.
- ^ Huang, JZ; Wu, CO; Zhou, L. (2004). "Polynomial spline estimation and inference for varying coefficient models with longitudinal data". Statistica Sinica. 14 (3): 763–788.
- ^ Şentürk, D; Müller, HG. (2010). "Functional varying coefficient models for longitudinal data". Journal of the American Statistical Association. 105 (491): 1256–1264. doi:10.1198/jasa.2010.tm09228. S2CID 14296231.
- ^ Eggermont, PPB; Eubank, RL; LaRiccia, VN. (2010). "Convergence rates for smoothing spline estimators in varying coefficient models". Journal of Statistical Planning and Inference. 140 (2): 369–381. doi:10.1016/j.jspi.2009.06.017.
- ^ a b Yao, F; Müller, HG. (2010). "Functional quadratic regression". Biometrika. 97 (1):49–64.
- ^ Horváth, L; Reeder, R. (2013). "A test of significance in functional quadratic regression". Bernoulli. 19 (5A): 2120–2151. arXiv:1105.0014. doi:10.3150/12-BEJ446. S2CID 88512527.
- ^ Chen, D; Hall, P; Müller HG. (2011). "Single and multiple index functional regression models with nonparametric link". The Annals of Statistics. 39 (3):1720–1747.
- ^ Jiang, CR; Wang JL. (2011). "Functional single index models for longitudinal data". he Annals of Statistics. 39 (1):362–388.
- ^ Müller HG; Wu Y; Yao, F. (2013). "Continuously additive models for nonlinear functional regression". Biometrika. 100 (3): 607–622. doi:10.1093/biomet/ast004.
{{cite journal}}: CS1 maint: multiple names: authors list (link) - ^ Müller HG; Stadmüller, U. (2005). "Generalized Functional Linear Models". The Annals of Statistics. 33 (2): 774–805. arXiv:math/0505638. doi:10.1214/009053604000001156.
{{cite journal}}: CS1 maint: multiple names: authors list (link) - ^ Chiou, JM; Li, PL. (2007). "Functional clustering and identifying substructures of longitudinal data". Journal of the Royal Statistical Society, Series B (Statistical Methodology). 69 (4): 679–699. doi:10.1111/j.1467-9868.2007.00605.x. S2CID 120883171.
- ^ Banfield, JD; Raftery, AE. (1993). "Model-based Gaussian and non-Gaussian clustering". Biometrics. 49 (3): 803–821. doi:10.2307/2532201. JSTOR 2532201.
- ^ James, GM; Sugar, CA. (2003). "Clustering for sparsely sampled functional data". Journal of the American Statistical Association. 98 (462): 397–408. doi:10.1198/016214503000189. S2CID 9487422.
- ^ Jacques, J; Preda, C. (2013). "Funclust: A curves clustering method using functional random variables density approximation" (PDF). Neurocomputing. 112: 164–171. doi:10.1016/j.neucom.2012.11.042. S2CID 33591208.
- ^ Jacques, J; Preda, C. (2014). "Model-based clustering for multivariate functional data". Computational Statistics & Data Analysis. 71 (C): 92–106. doi:10.1016/j.csda.2012.12.004.
- ^ Coffey, N; Hinde, J; Holian, E. (2014). "Clustering longitudinal profiles using P-splines and mixed effects models applied to time-course gene expression data". Computational Statistics & Data Analysis. 71 (C): 14–29. doi:10.1016/j.csda.2013.04.001.
- ^ Heinzl, F; Tutz, G. (2014). "Clustering in linear-mixed models with a group fused lasso penalty". Biometrical Journal. 56 (1): 44–68. doi:10.1002/bimj.201200111. PMID 24249100. S2CID 10969266.
- ^ Angelini, C; Canditiis, DD; Pensky, M. (2012). "Clustering time-course microarray data using functional Bayesian infinite mixture model". Journal of Applied Statistics. 39 (1): 129–149. Bibcode:2012JApSt..39..129A. doi:10.1080/02664763.2011.578620. S2CID 8902492.
- ^ Rodríguez, A; Dunson, DB; Gelfand, AE. (2009). "Bayesian nonparametric functional data analysis through density estimation". Biometrika. 96 (1): 149–162. doi:10.1093/biomet/asn054. PMC 2650433. PMID 19262739.
- ^ Petrone, S; Guindani, M; Gelfand, AE. (2009). "Hybrid Dirichlet mixture models for functional data". Journal of the Royal Statistical Society. 71 (4): 755–782. doi:10.1111/j.1467-9868.2009.00708.x. S2CID 18638091.
- ^ Heinzl, F; Tutz, G. (2013). "Clustering in linear mixed models with approximate Dirichlet process mixtures using EM algorithm" (PDF). Statistical Modelling. 13 (1): 41–67. doi:10.1177/1471082X12471372. S2CID 11448616.
- ^ Leng, X; Müller, HG. (2006). "Classification using functional data analysis for temporal gene expression data" (PDF). Bioinformatics. 22 (1): 68–76. doi:10.1093/bioinformatics/bti742. PMID 16257986.
- ^ James, GM; Hastie, TJ. (2001). "Functional linear discriminant analysis for irregularly sampled curves". Journal of the Royal Statistical Society. 63 (3): 533–550. doi:10.1111/1467-9868.00297. S2CID 16050693.
- ^ Hall, P; Poskitt, DS; Presnell, B. (2001). "A Functional Data—Analytic Approach to Signal Discrimination". Technometrics. 43 (1): 1–9. doi:10.1198/00401700152404273. S2CID 21662019.
- ^ Ferraty, F; Vieu, P. (2003). "Curves discrimination: a nonparametric functional approach". Computational Statistics & Data Analysis. 44 (1–2): 161–173. doi:10.1016/S0167-9473(03)00032-X.
- ^ Chang, C; Chen, Y; Ogden, RT. (2014). "Functional data classification: a wavelet approach". Computational Statistics. 29 (6): 1497–1513. doi:10.1007/s00180-014-0503-4. S2CID 120454400.
- ^ Zhu, H; Brown, PJ; Morris, JS. (2012). "Robust Classification of Functional and Quantitative Image Data Using Functional Mixed Models". Biometrics. 68 (4): 1260–1268. doi:10.1111/j.1541-0420.2012.01765.x. PMC 3443537. PMID 22670567.
- ^ Dai, X; Müller, HG; Yao, F. (2017). "Optimal Bayes classifiers for functional data and density ratios". Biometrika. 104 (3): 545–560. arXiv:1605.03707.
- ^ Delaigle, A; Hall, P (2012). "Achieving near perfect classification for functional data". Journal of the Royal Statistical Society. Series B (Statistical Methodology). 74 (2): 267–286. doi:10.1111/j.1467-9868.2011.01003.x. ISSN 1369-7412. S2CID 124261587.
- ^ Wang, JL; Chiou, JM; Müller, HG. (2016). "Functional Data Analysis". Annual Review of Statistics and Its Application. 3 (1): 257–295. Bibcode:2016AnRSA...3..257W. doi:10.1146/annurev-statistics-041715-033624. S2CID 13709250.
- ^ Gasser, T; Müller, HG; Kohler, W; Molinari, L; Prader, A. (1984). "Nonparametric regression analysis of growth curves". The Annals of Statistics. 12 (1): 210–229.
- ^ Ramsay, JO; Li, X. (1998). "Curve registration". Journal of the Royal Statistical Society, Series B. 60 (2): 351–363. doi:10.1111/1467-9868.00129. S2CID 17175587.
- ^ a b c Marron, JS; Ramsay, JO; Sangalli, LM; Srivastava, A (2015). "Functional data analysis of amplitude and phase variation". Statistical Science. 30 (4): 468–484. arXiv:1512.03216. doi:10.1214/15-STS524. S2CID 55849758.
- ^ Sakoe, H; Chiba, S. (1978). "Dynamic programming algorithm optimization for spoken word recognition". IEEE Transactions on Acoustics, Speech, and Signal Processing. 26: 43–49. doi:10.1109/TASSP.1978.1163055. S2CID 17900407.
- ^ Kneip, A; Gasser, T (1992). "Statistical tools to analyze data representing a sample of curves". Annals of Statistics. 20 (3): 1266–1305. doi:10.1214/aos/1176348769.
- ^ Gasser, T; Kneip, A (1995). "Searching for structure in curve sample". Journal of the American Statistical Association. 90 (432): 1179–1188.
- ^ Tang, R; Müller, HG. (2008). "Pairwise curve synchronization for functional data". Biometrika. 95 (4): 875–889. doi:10.1093/biomet/asn047.
- ^ a b Anirudh, R; Turaga, P; Su, J; Srivastava, A (2015). "Elastic functional coding of human actions: From vector-fields to latent variables". Proceedings of the IEEE Conference on Computer Vision and Pattern Recognition: 3147–3155.
- ^ a b Dubey, P; Müller, HG (2021). "Modeling Time-Varying Random Objects and Dynamic Networks". Journal of the American Statistical Association. 117 (540): 2252–2267. arXiv:2104.04628. doi:10.1080/01621459.2021.1917416. S2CID 233210300.
- ^ Pigoli, D; Hadjipantelis, PZ; Coleman, JS; Aston, JAD (2017). "The statistical analysis of acoustic phonetic data: exploring differences between spoken Romance languages". Journal of the Royal Statistical Society. Series C (Applied Statistics). 67 (5): 1130–1145.
- ^ Happ, C; Greven, S (2018). "Multivariate Functional Principal Component Analysis for Data Observed on Different (Dimensional) Domains". Journal of the American Statistical Association. 113 (522): 649–659. arXiv:1509.02029. doi:10.1080/01621459.2016.1273115. S2CID 88521295.
- ^ Chiou, JM; Yang, YF; Chen, YT (2014). "Multivariate functional principal component analysis: a normalization approach". Statistica Sinica. 24: 1571–1596.
- ^ Carroll, C; Müller, HG; Kneip, A (2021). "Cross-component registration for multivariate functional data, with application to growth curves". Biometrics. 77 (3): 839–851. arXiv:1811.01429. doi:10.1111/biom.13340. S2CID 220687157.
- ^ Dai, X; Müller, HG (2018). "Principal component analysis for functional data on Riemannian manifolds and spheres". The Annals of Statistics. 46 (6B): 3334–3361. arXiv:1705.06226. doi:10.1214/17-AOS1660. S2CID 13671221.
- ^ Chen, K; Delicado, P; Müller, HG (2017). "Modelling function-valued stochastic processes, with applications to fertility dynamics". Journal of the Royal Statistical Society. Series B (Statistical Methodology). 79 (1): 177–196. doi:10.1111/rssb.12160. hdl:2117/126653. S2CID 13719492.