
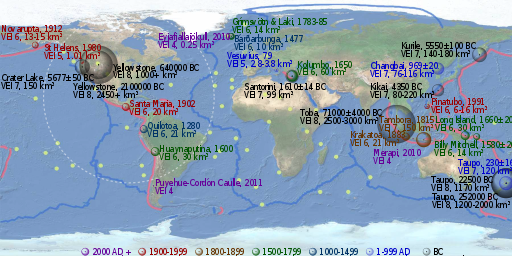
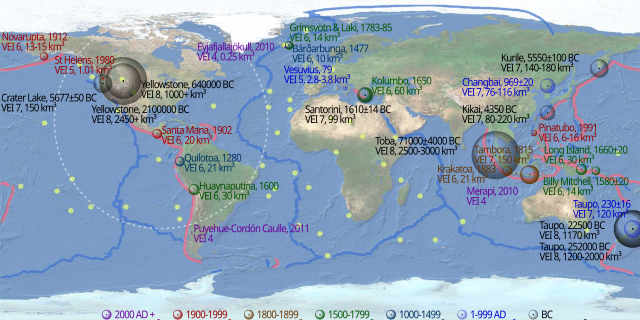
![Map of notable volcanic eruptions. The apparent volume of each bubbles is linearly proportional to the volume of tephra ejected (i.e. their radius is linearly proportional to the cube root of the volume of tephra ejected), colour-coded by time of eruption as in the legend. Pink lines denote convergent boundaries, blue lines denote divergent boundaries and yellow spots denote hotspots. The dashed circle shows the equivalent ejection from the Chicxulub impact (200000+ km³).[1] The background map is extracted from https://earthquake.usgs.gov/learn/topics/plate_tectonics/majplatecolor.pdf and http://oceanexplorer.noaa.gov/okeanos/explorations/ex1103/logs/hires/hotspots_map_hires.jpg .](http://upload.wikimedia.org/wikipedia/commons/0/06/Volcanic_eruption_map.svg)
Size of this PNG preview of this SVG file: 512 × 256 pixels. Other resolutions: 320 × 160 pixels | 640 × 320 pixels | 1,024 × 512 pixels | 1,280 × 640 pixels | 2,560 × 1,280 pixels.
Original file (SVG file, nominally 512 × 256 pixels, file size: 362 KB)
| This is a file from the Wikimedia Commons. Information from its description page there is shown below. Commons is a freely licensed media file repository. You can help. |

|
This file requires updating. In doing so, you could add a timestamp to the file.
|
Summary
| Description |
Map of notable volcanic eruptions. The apparent volume of each bubbles is linearly proportional to the volume of tephra ejected (i.e. their radius is linearly proportional to the cube root of the volume of tephra ejected), colour-coded by time of eruption as in the legend. Pink lines denote convergent boundaries, blue lines denote divergent boundaries and yellow spots denote hotspots. The dashed circle shows the equivalent ejection from the Chicxulub impact (200000+ km³).[1] The background map is extracted from https://earthquake.usgs.gov/learn/topics/plate_tectonics/majplatecolor.pdf and http://oceanexplorer.noaa.gov/okeanos/explorations/ex1103/logs/hires/hotspots_map_hires.jpg . |
| Date | (UTC) |
| Source |
This file was derived from: USGS majplatecolor.png: |
| Author |
|
| Other versions |
|

- ↑ Starr, Evers, Starr, Biology: Concepts and Applications Without Physiology p.395
| This is a retouched picture, which means that it has been digitally altered from its original version. Modifications: Add volcanic eruptions, boundaries and hotspots. The original can be viewed here: USGS majplatecolor.png:
|
Licensing
This file is licensed under the Creative Commons Attribution-Share Alike 3.0 Unported license.
- You are free:
- to share – to copy, distribute and transmit the work
- to remix – to adapt the work
- Under the following conditions:
- attribution – You must give appropriate credit, provide a link to the license, and indicate if changes were made. You may do so in any reasonable manner, but not in any way that suggests the licensor endorses you or your use.
- share alike – If you remix, transform, or build upon the material, you must distribute your contributions under the same or compatible license as the original.
Original upload log
This image is a derivative work of the following images:
- File:USGS_majplatecolor.png licensed with PD-USGov-USGS
- 2012-07-11T22:13:58Z Cmglee 4368x2205 (10477176 Bytes) Update to 24-bit PNG.
- 2012-07-11T22:11:29Z Cmglee 4368x2205 (4014441 Bytes) {{Information |Description ={{en|1=Equirectangular projection of world land and ocean visible plus elevation data, in faded colours suitable as background for further data visualisation. Extracted from PDF at http://earthq
Uploaded with derivativeFX
File history
Click on a date/time to view the file as it appeared at that time.
| Date/Time | Thumbnail | Dimensions | User | Comment | |
|---|---|---|---|---|---|
| current | 17:43, 11 September 2013 | | 512 × 256 (362 KB) | Cmglee | Fix MIME type. |
| 02:45, 26 January 2013 |  | 512 × 256 (362 KB) | Cmglee | Previous upload failed; try again... | |
| 02:43, 26 January 2013 |  | 512 × 256 (362 KB) | Cmglee | Fix Merapi's year (thanks, '''Res'''Mar) | |
| 12:38, 13 July 2012 |  | 512 × 256 (362 KB) | Cmglee | Add Chixculub equivalent. | |
| 23:35, 12 July 2012 |  | 512 × 256 (361 KB) | Cmglee | Try uploading again. | |
| 23:34, 12 July 2012 |  | 512 × 256 (361 KB) | Cmglee | Reduce kerning. | |
| 23:32, 12 July 2012 |  | 512 × 256 (361 KB) | Cmglee | == {{int:filedesc}} == {{Information |Description={{en|1=Equirectangular projection of world land and ocean visible plus elevation data, in faded colours suitable as background for further data visualisation. Extracted from PDF at http://earthquake.usg... |
File usage
The following pages on the English Wikipedia use this file (pages on other projects are not listed):
Global file usage
The following other wikis use this file:
- Usage on hu.wikipedia.org
- Usage on tr.wikipedia.org
- Usage on uk.wikipedia.org
- Usage on zh.wikipedia.org