
Size of this preview: 799 × 599 pixels. Other resolutions: 320 × 240 pixels | 640 × 480 pixels | 1,024 × 768 pixels | 1,280 × 960 pixels | 1,801 × 1,351 pixels.
Original file (1,801 × 1,351 pixels, file size: 155 KB, MIME type: image/jpeg)
| This is a file from the Wikimedia Commons. Information from its description page there is shown below. Commons is a freely licensed media file repository. You can help. |

|
File:US timeline. Number of overdose deaths from all drugs.svg is a vector version of this file. It should be used in place of this JPG file when not inferior.
File:US timeline. Number of overdose deaths from all drugs.jpg → File:US timeline. Number of overdose deaths from all drugs.svg
For more information, see Help:SVG. |
 |
Summary
| Description |
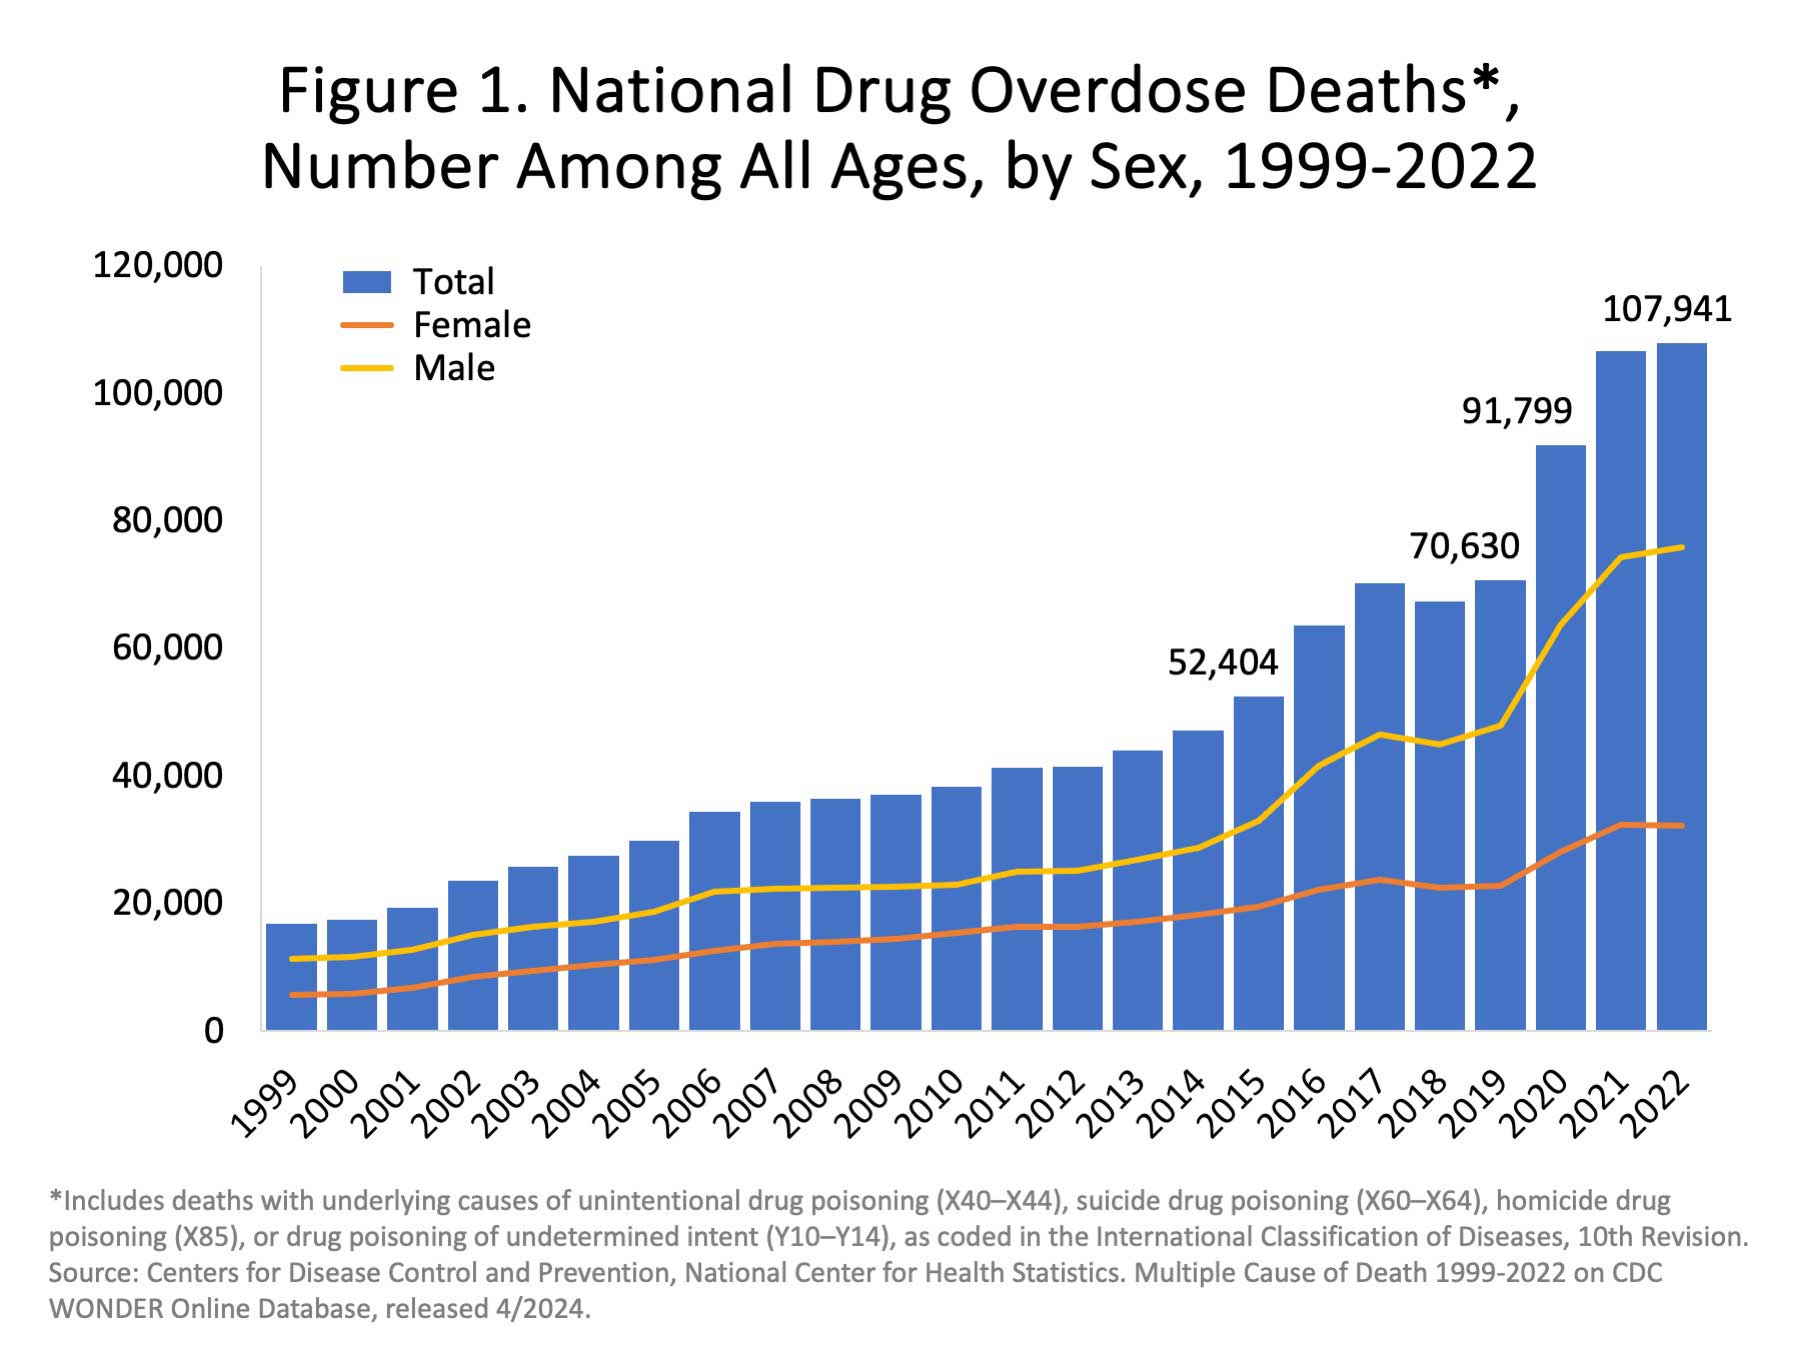
"Figure 1. National Drug Overdose Deaths—Number Among All Ages, by Sex, 1999-2022. Nearly 108,000 persons in the U.S. died from drug-involved overdose in 2022, including from illicit or prescription drugs. The figure is a bar and line graph showing the total number of U.S. drug overdose deaths involving select illicit and prescription drugs from 1999 to 2022. The bars are overlaid by lines showing the number of deaths by gender from 1999 to 2022 (Source: CDC WONDER)." |
| Date | - date of first upload here to the Commons. See file history for date of latest upload. |
| Source | From Overdose Death Rates. By National Institute on Drug Abuse (NIDA). Click on the chart on the compilation page. The large chart will show up. Right-click it, and then "Open image in new tab" to get image URL. 1999-2022 chart. 1999-2021 chart. 1999-2020 chart. 1999-2019 chart. 2002-2017 chart. 1999-2017 chart. 2002-2015 chart. |
| Author | National Institute on Drug Abuse. Some of the charts were cropped to get rid of outer white space. The caption and legend text were edited in some charts. The edited charts were put under the same public domain license. See Commons:Convert tables and charts to wiki code or image files, and the section about removing, adding, and editing text on chart images. |
Licensing
This image is a work of the National Institutes of Health, part of the United States Department of Health and Human Services, taken or made as part of an employee's official duties. As a work of the U.S. federal government, the image is in the public domain.
 |
||
| This file has been identified as being free of known restrictions under copyright law, including all related and neighboring rights. | ||
File history
Click on a date/time to view the file as it appeared at that time.
| Date/Time | Thumbnail | Dimensions | User | Comment | |
|---|---|---|---|---|---|
| current | 13:21, 16 May 2024 | | 1,801 × 1,351 (155 KB) | Timeshifter | Latest. |
| 16:47, 12 July 2023 |  | 1,200 × 900 (180 KB) | Timeshifter | Latest | |
| 21:21, 29 May 2022 |  | 1,200 × 900 (153 KB) | Timeshifter | Latest version | |
| 16:27, 13 March 2021 |  | 1,106 × 524 (130 KB) | Timeshifter | Latest version. | |
| 17:52, 16 August 2019 |  | 869 × 675 (128 KB) | Timeshifter | Newer version. | |
| 15:32, 5 September 2018 |  | 813 × 583 (96 KB) | Timeshifter | new version | |
| 11:42, 27 March 2017 |  | 840 × 643 (103 KB) | Timeshifter | Added border | |
| 02:17, 21 March 2017 |  | 837 × 641 (96 KB) | Timeshifter | User created page with UploadWizard |
File usage
The following pages on the English Wikipedia use this file (pages on other projects are not listed):
Global file usage
The following other wikis use this file:
- Usage on cs.wikipedia.org
- Usage on de.wikipedia.org
- Usage on es.wikipedia.org
- Usage on et.wikipedia.org
- Usage on sr.wikipedia.org
- Usage on www.wikidata.org
- Usage on zh.wikipedia.org