
_png)
![This graph shows projections of global mean sea level rise (SLR) by Parris et al. (2012)[1] In 2100, global mean sea level is projected to rise by 0.2-2.0 m (0.7-6.6 ft), relative to mean sea level in 1992: Scenario / SLR by 2100 (m) / SLR by 2100 (ft) Highest / 2.0 / 6.6 Intermediate-high / 1.2 / 3.9 Intermediate-low / 0.5 / 1.6 Lowest / 0.2 / 0.7 Note: projections are relative to mean sea level in 1992. SLR increases smoothly over the 21st century, with a slight acceleration over time. In 2050, SLR projections approximately range between 0.1-0.62 m (0.3-2.0 ft). Parris et al. (2012)[2] do not assign probabilities to these scenarios. Therefore, none of these scenarios should be interpreted as a best-estimate of future SLR. Notes ↑ Figure 10, in: 4. Global Mean Sea Level Rise Scenarios, in: Main Report, in Parris & others 2012, p. 12 ↑ Executive Summary, in Parris & others 2012, p. 1 References Parris, A., et al. (2012-12-06) Global Sea Level Rise Scenarios for the US National Climate Assessment. NOAA Tech Memo OAR CPO-1[1], NOAA Climate Program Office](http://upload.wikimedia.org/wikipedia/commons/5/54/Projections_of_global_mean_sea_level_rise_by_Parris_et_al._%282012%29.png)
Size of this preview: 800 × 449 pixels. Other resolutions: 320 × 180 pixels | 640 × 359 pixels | 1,355 × 761 pixels.
Original file (1,355 × 761 pixels, file size: 34 KB, MIME type: image/png)
| This is a file from the Wikimedia Commons. Information from its description page there is shown below. Commons is a freely licensed media file repository. You can help. |
.png)
Summary
| Description |
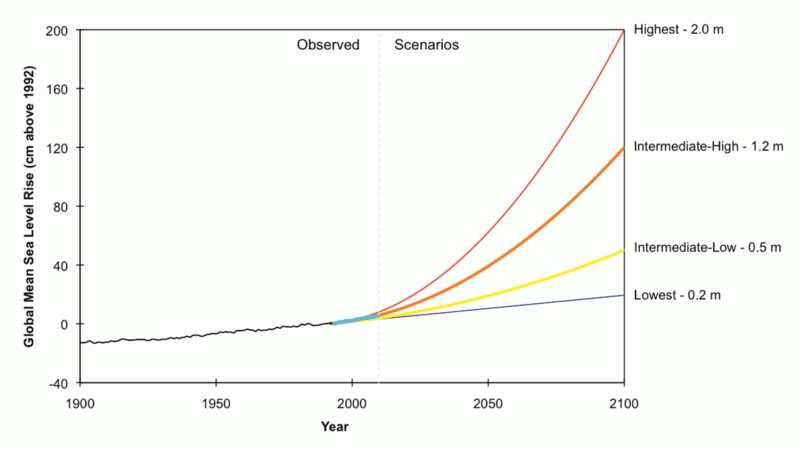
This graph shows projections of global mean sea level rise (SLR) by Parris et al. (2012)[1] In 2100, global mean sea level is projected to rise by 0.2-2.0 m (0.7-6.6 ft), relative to mean sea level in 1992:
Scenario / SLR by 2100 (m) / SLR by 2100 (ft) Note: projections are relative to mean sea level in 1992. SLR increases smoothly over the 21st century, with a slight acceleration over time. In 2050, SLR projections approximately range between 0.1-0.62 m (0.3-2.0 ft). Parris et al. (2012)[2] do not assign probabilities to these scenarios. Therefore, none of these scenarios should be interpreted as a best-estimate of future SLR. Notes
References
|
| Date | |
| Source | Figure 10, in: "4. Global Mean Sea Level Rise Scenarios," in: "Main Report," in: Global Sea Level Rise Scenarios for the US National Climate Assessment. NOAA Tech Memo OAR CPO-1[2], National Oceanic and Atmospheric Administration Climate Program Office, 6 December 2012, p.12. |
| Author | Parris, A., P. Bromirski, V. Burkett, D. Cayan, M. Culver, J. Hall, R. Horton, K. Knuuti, R. Moss, J. Obeysekera, A. Sallenger, and J. Weiss |
Licensing
This image is in the public domain because it contains materials that originally came from the U.S. National Oceanic and Atmospheric Administration, taken or made as part of an employee's official duties.
|
File history
Click on a date/time to view the file as it appeared at that time.
| Date/Time | Thumbnail | Dimensions | User | Comment | |
|---|---|---|---|---|---|
| current | 12:03, 17 August 2013 | | 1,355 × 761 (34 KB) | Enescot | {{Information |Description ={{en|1=This graph shows projections of global mean sea level rise (SLR) by Parris ''et al.'' (2012)<ref> Figure 10, in: 4. Global Mean Sea Level Rise Scenarios, in: Main Report, in {{harvnb|... |
File usage
The following pages on the English Wikipedia use this file (pages on other projects are not listed):
Global file usage
The following other wikis use this file:
- Usage on es.wikipedia.org
- Usage on uk.wikipedia.org
.png)