

Size of this PNG preview of this SVG file: 250 × 160 pixels. Other resolutions: 320 × 205 pixels | 640 × 410 pixels | 1,024 × 655 pixels | 1,280 × 819 pixels | 2,560 × 1,638 pixels.
Original file (SVG file, nominally 250 × 160 pixels, file size: 87 KB)
| This is a file from the Wikimedia Commons. Information from its description page there is shown below. Commons is a freely licensed media file repository. You can help. |
Summary
| Description |
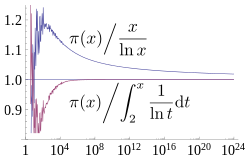
A plot showing how two estimates described by the prime number theorem, and converge asymptotically towards , the number of primes less than x. The x axis is and is logarithmic (labelled in evenly spaced powers of 10), going up to 1024, the largest for which is currently known. The former estimate converges extremely slowly, while the latter has visually converged on this plot by 108. Source used to generate this chart is shown below. |
| Date | |
| Source | Own work |
| Author | Dcoetzee |
| SVG development | This chart was created with Mathematica. |


Licensing
I, the copyright holder of this work, hereby publish it under the following license:
| This file is made available under the Creative Commons CC0 1.0 Universal Public Domain Dedication. | |
| The person who associated a work with this deed has dedicated the work to the public domain by waiving all of their rights to the work worldwide under copyright law, including all related and neighboring rights, to the extent allowed by law. You can copy, modify, distribute and perform the work, even for commercial purposes, all without asking permission.
|
Source
All source released under CC0 waiver.
Mathematica source to generate graph (which was then saved as SVG from Mathematica):
(* Sample both functions at 600 logarithmically spaced points between \
1 and 2^40 *)
base = N[E^(24 Log[10]/600)];
ratios = Table[{Round[base^x],
    N[PrimePi[Round[base^x]]/(base^x/(x*Log[base]))]}, {x, 1,
    Floor[40/Log[2, base]]}];
ratiosli =
  Table[{Round[base^x],
    N[PrimePi[
       Round[base^x]]/(LogIntegral[base^x] - LogIntegral[2])]}, {x,
    Ceiling[Log[base, 2]], Floor[40/Log[2, base]]}];
(* Supplement with larger known PrimePi values that are too large for \
Mathematica to compute *)
LargePiPrime = {{10^13, 346065536839}, {10^14, 3204941750802}, {10^15,
     29844570422669}, {10^16, 279238341033925}, {10^17,
    2623557157654233}, {10^18, 24739954287740860}, {10^19,
    234057667276344607}, {10^20, 2220819602560918840}, {10^21,
    21127269486018731928}, {10^22, 201467286689315906290}, {10^23,
    1925320391606803968923}, {10^24, 18435599767349200867866}};
ratios2 =
  Join[ratios,
   Map[{#[[1]], N[#[[2]]]/(#[[1]]/(Log[#[[1]]]))} &, LargePiPrime]];
ratiosli2 =
  Join[ratiosli,
   Map[{#[[1]], N[#[[2]]]/(LogIntegral[#[[1]]] - LogIntegral[2])} &,
    LargePiPrime]];
(* Plot with log x axis, together with the horizontal line y=1 *)
Show[LogLinearPlot[1, {x, 1, 10^24}, PlotRange -> {0.8, 1.25}],
 ListLogLinearPlot[{ratios2, ratiosli2}, Joined -> True],
 LabelStyle -> FontSize -> 14]
LaTeX source for labels:
$$ \left.{\pi(x)}\middle/{\frac{x}{\ln x}}\right. $$
$$ \left.{\pi(x)}\middle/{\int_2^x \frac{1}{\ln t} \mathrm{d}t}\right. $$
These were converted to SVG with [1] and then the graph was embedded into the resulting document in Inkscape. Axis fonts were also converted to Liberation Serif in Inkscape.
File history
Click on a date/time to view the file as it appeared at that time.
| Date/Time | Thumbnail | Dimensions | User | Comment | |
|---|---|---|---|---|---|
| current | 13:07, 21 March 2013 | | 250 × 160 (87 KB) | Dcoetzee | Change n to x to match article |
| 12:30, 21 March 2013 |  | 250 × 160 (86 KB) | Dcoetzee | Convert formula from graphics to pure SVG using http://www.tlhiv.org/ltxpreview/ | |
| 12:23, 21 March 2013 |  | 250 × 160 (130 KB) | Dcoetzee | {{Information |Description ={{en|1=A plot showing how two estimates described by the prime number theorem, <math>\frac{n}{\ln n}</math> and <math>\int_2^n \frac{1}{\ln t} \mathrm{d}t = Li(n) = li(n) - li(2)</math> converge asymptotically towards <ma... |
File usage
The following pages on the English Wikipedia use this file (pages on other projects are not listed):
Global file usage
The following other wikis use this file:
- Usage on ar.wikipedia.org
- Usage on bn.wikipedia.org
- Usage on ca.wikipedia.org
- Usage on el.wikipedia.org
- Usage on fa.wikipedia.org
- Usage on he.wikipedia.org
- Usage on hu.wikipedia.org
- Usage on hy.wikipedia.org
- Usage on id.wikipedia.org
- Usage on ja.wikipedia.org
- Usage on no.wikipedia.org
- Usage on pl.wikipedia.org
- Usage on sl.wikipedia.org
- Usage on sr.wikipedia.org
- Usage on sv.wikipedia.org
- Usage on ta.wikipedia.org
- Usage on vi.wikipedia.org