

Original file (2,003 × 955 pixels, file size: 671 KB, MIME type: image/png)
| This is a file from the Wikimedia Commons. Information from its description page there is shown below. Commons is a freely licensed media file repository. You can help. |
| This is a featured picture, which means that members of the community have identified it as one of the finest images on the English Wikipedia, adding significantly to its accompanying article. If you have a different image of similar quality, be sure to upload it using the proper free license tag, add it to a relevant article, and nominate it. |
| This image was selected as picture of the day on the English Wikipedia for June 24, 2008. |
|

Summary
| Description |
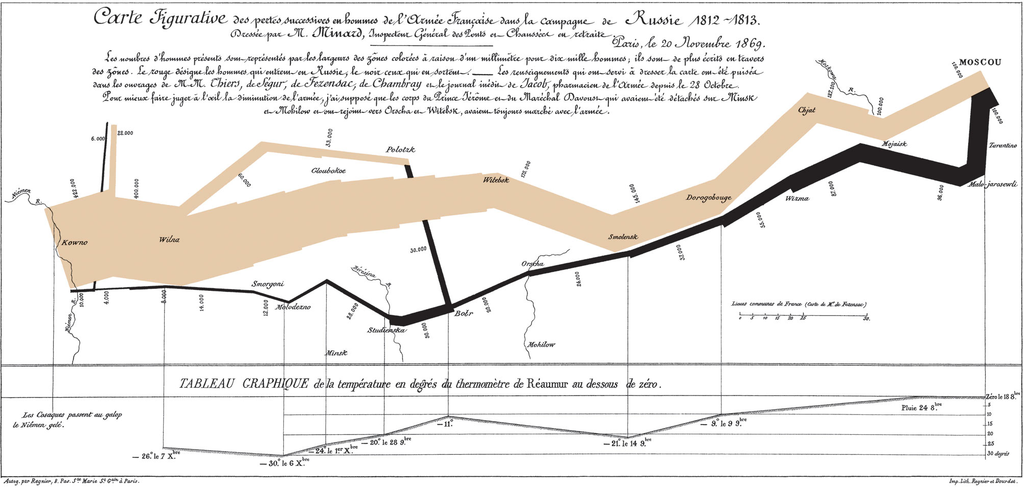
Charles Minard's 1869 chart showing the number of men in Napoleon’s 1812 Russian campaign army, their movements, as well as the temperature they encountered on the return path. Lithograph, 62 × 30 cm
|
| Date | Published November 20, 1869 |
| Source | see upload log |
| Author | Charles Minard (1781–1870) |
Legend
Bildhafte Karte der fortlaufenden Verluste an Männern der französischen Armee im Russlandfeldzug 1812-1813.
Ausgeführt von Herrn Minard, Generalinspektor der Ponts et Chaussées [die ehemals in Frankreich für Straßen- und Brückenbau zuständige Behörde] im Ruhestand. Paris, der 20. November 1869.
Die Zahl der Männer wird durch die Breiten der farbigen Bereiche dargestellt, wobei ein Millimeter zehntausend Männern entspricht; sie sind zusätzlich im Verlauf der Bereiche beschriftet. Rot bezeichnet die Männer, die nach Russland einmarschieren, schwarz diejenigen, die es verlassen. —— Die Informationen, deren man sich zum Erzeugen der Karte bedient hat, wurden den Werken der Herren Thiers, de Ségur, de Fezensac, de Chambray und dem unveröffentlichten Tagebuch von Jacob (Apotheker der Armee seit dem 28. Oktober) entnommen. Um das Schrumpfen der Armee dem Auge besser vorzuführen, habe ich unterstellt, dass die Korps des Prinzen Jérôme und des Marschalls Davoust, die sich bei Minsk und Mobilow abgespalten haben und später bei Orscha und Witebsk wieder hinzugekommen sind, die ganze Zeit mit der Armee mitmarschiert sind.
Der Massstab ist in "lieues communes de France", ein Maß, das 4,444 Kilometern entspricht, und die Temperaturen in Réaumur, die jeweils 1,25 Grad Celsius entsprechen, angegeben.
Figurative Map of the successive losses in men of the French Army in the Russian campaign 1812–1813.
Drawn up by M. Minard, Inspector General of Bridges and Roads in retirement. Paris, 20 November 1869.
The numbers of men present are represented by the widths of the colored zones at a rate of one millimeter for every ten-thousand men; they are further written across the zones. The red [now brown] designates the men who enter into Russia, the black those who leave it. —— The information which has served to draw up the map has been extracted from the works of M. M. Thiers, of Segur, of Fezensac, of Chambray, and the unpublished diary of Jacob, pharmacist of the army since October 28th. In order to better judge with the eye the diminution of the army, I have assumed that the troops of prince Jerome and of Marshal Davoush who had been detached at Minsk and Moghilev and have rejoined around Orcha and Vitebsk, had always marched with the army.
The scale is shown on the center-right, in "lieues communes de France" (common French league) which is 4444 m (2.75 miles).
The lower portion of the graph is to be read from right to left. It shows the temperature on the army's return from Russia, in degrees below freezing on the Réaumur scale. (Multiply Réaumur temperatures by 1¼ to get Celsius, e.g. −30 °R = −37.5 °C) At Smolensk, the temperature was −21° Réaumur on 14 November.
Placenames: Chjat = Gzhatsk (now named Gagarin).
Mapa figurativo de las pérdidas humanas sucesivas del ejército francés durante la campaña rusa de 1812-1813.
Dibujado por M. Minard, Inspector General de Puentes y Caminos en retiro. París, 20 de noviembre, 1869.
El número de hombres está representado por el ancho de las zonas coloreadas a razón de un milímetro por cada diez mil hombres; además están escritas en números en cada zona. El rojo [ahora marrón] designa los hombres que entran en Rusia, el negro, aquellos que la dejan. —— La información utilizada para la elaboración de este mapa ha sido extraída del trabajo de M. M. Thiers, de Segur, de Fezensac, de Chambray, y del diario inédito de Jacob, farmacéutico del ejército desde el 28 de octubre. Para facilitar la valoración visual de la disminución del ejército, he asumido que las tropas del príncipe Jérôme y del mariscal Davoust que se habían separado en Minsk y Moguilev y se han vuelto a juntar cerca de Orcha y Vitebsk, han marchado al mismo tiempo que el ejército.
La escala se muestra a la derecha en «lieues communes de France» (leguas comunes francesas), que equivalen a 4444 metros.
La porción inferior del gráfico se debe leer de derecha a izquierda. Muestra la temperatura ambiental durante el regreso del ejército desde Rusia, en grados bajo cero en la escala de Réaumur (para convertir a grados Celsius, se debe multiplicar por 1,25 P.ej.: −30°R = −37.5 °C). La temperatura en Smolensk era de −21° Réaumur el 14 de noviembre.
Carte Figurative des pertes successives en hommes de l'armée française dans la campagne de Russie 1812-1813.
Dressée par M. Minard, Inspecteur Général des Ponts et Chaussées en retraite. Paris, le 20 Novembre 1869.
Les nombres d'hommes présentés par les largeurs des zones colorées à raison d'un millimètre pour dix mille hommes ; ils sont de plus écrits en travers des zones. Le rouge désigne les hommes qui entrent en Russie, le noir ceux qui en sortent. —— Les renseignements qui ont servi à dresser la carte ont été puisés dans les ouvrages de MM. Thiers, de Ségur, de Fezensac, de Chambray et le journal inédit de Jacob, pharmacien de l'armée depuis le 28 octobre. Pour mieux faire juger à l'œil la diminution de l'armée, j'ai supposé que les corps du prince Jérôme et du Maréchal Davoust qui avaient été détachés sur Minsk et Mobilow et ont rejoint vers Orscha et Witebsk, avaient toujours marché avec l'armée.
L'échelle est en lieues, une mesure valant 4,444 kilomètres, et les températures en degrés Réaumur, qui valent 1,25 degrés Celsius.
Rusya Seferi (1812-1813) sırasında Farnsız Ordusu'nun asker kayıplarını gösteren Temsili Harita.
Çizen: M. Minard, Köprü ve Yollar Emekli Başmüfettişi. Paris, 20 Kasım 1869.
Asker sayısı renkli çizgilerin kalınlığı ile gösterilmiştir, on bin asker bir milimetre kalınlığa karşılık gelir; ayrıca her çiziginin kenarında da bu sayı belirtilmiştir. Kırmızı, Rusya'ya giren askerleri göstermektedir, siyah oradan geri gelenleri. —— Bu haritayı çizmek için kullanılan bilgi, Segur'lü bay Thiers, Chambray'li bay Fezensac ve 28 Ekimden beri ordu eczacısı olan bay Jacob'un yayımlanmamış güncesinden elde edilmiştir. Ordunun küçülmesini daha iyi görülebilmesi için, Minsk ve Moghilev'de ayrılıp sonra Orcha ve Vitbesk'te tekrar sefere katılan Prens Jerome ve Mareşal Davoush'un birliklerini hep orduyla beraber yürümüş varsaydım.
Ölçek ortanın sağında, "lieues communes de France" (Fransız halk fersahı) olarak gösterilmiştir, bu uzunluk birimi 4444 metreye denktir.
Haritanın alt kısmı sağdan sola okunmalıdır. Ordunun Rusya'dan geri dönüşündeki sıcaklıkları sıfırın altında Réaumur derecesi olarak gösterir. (Réaumur sıcaklığı 1¼ ile çarpılarak Santigrad derece değeri elde edilir, örneğin −30°R = −37.5 °C). Smolensk'te 14 Kasım'da sıcaklık −21° Réaumur'dü.
График потерь французской армии по ходу Русской кампании 1812–1813.
Изготовлена Жозефом Минаром, генерал-ревизором мостов и дорог в отставке. Париж, 20 ноября 1869 года.
Количество человек в армии представляется шириной цветной полосы. Одному миллиметру ширины полосы соответствует десять тысяч человек. Бежевая полоса соответствует количеству войск по ходу движения к Москве, черная - от Москвы (обратно). Информация, которая была использована для изготовления этой схемы, взята из работ М. Тьера, Сегюра, Амбруаз-Анатоля Монтескье-Фезензака, Шамбре и неопубликованного дневника Жакоба, фармацевта наполеоновской армии с 28 октября. Для того, чтобы можно было составить лучшее представление о убывании личного состава армии, я предположил, что войска принца Жерома и маршала Даву, которые отсоединились от основных сил под Минском и Могилевым, и, в дальнейшем, снова присоединились у Орши и Витебска, всё время находились с основными силами.
Шкала, показанная чуть правее центра, имеет единицу измерения льё (соответствует 4444 метрам). Нижний график должен быть прочитан справа налево. На нём изображена температура во время отступления французской армии из России, в градусах ниже точки замерзания воды по шкале Реомюра (1 °R = 1,25 °С)
Licensing
|
This work is in the public domain in its country of origin and other countries and areas where the copyright term is the author's life plus 100 years or fewer. | |
| This file has been identified as being free of known restrictions under copyright law, including all related and neighboring rights. | |
| Annotations | This image is annotated: View the annotations at Commons |
File history
Click on a date/time to view the file as it appeared at that time.
| Date/Time | Thumbnail | Dimensions | User | Comment | |
|---|---|---|---|---|---|
| current | 19:55, 17 January 2008 | | 2,003 × 955 (671 KB) | Mahahahaneapneap | pngcrushed |
| 06:28, 17 January 2008 |  | 2,003 × 955 (810 KB) | Jeff Dahl | restore right border | |
| 04:29, 28 December 2007 |  | 2,000 × 951 (861 KB) | Renata3 | color quality version from The Economist, Christmas edition | |
| 23:32, 28 August 2007 |  | 2,203 × 1,250 (419 KB) | Mzajac | Higher resolution scan, based on file found at http://www.cs.uta.fi/~ov/itv/luennot/kalvot/visu/kuvia/napoleon.gif | |
| 08:48, 29 August 2005 |  | 988 × 565 (87 KB) | Hispa | Gráfico de Minard sobre el avance y retirada de Napoleón en Rusia. Autor: Charles Joseph Minard Licencia: Dominio Público {{PD}} |
File usage
- 1810s
- Attrition warfare
- Attrition warfare against Napoleon
- Cartographic design
- Charles Joseph Minard
- Council at Fili
- Data and information visualization
- Edward Tufte
- Flow map
- French invasion of Russia
- Grande Armée
- Infographic
- Information design
- Mikhail Kutuzov
- Minard
- Russian Winter
- Sankey diagram
- Spatial analysis
- Thematic map
- Visual literacy
Global file usage
The following other wikis use this file:
- Usage on af.wikipedia.org
- Usage on ar.wikipedia.org
- Usage on ast.wikipedia.org
- Usage on bn.wikipedia.org
- Usage on bs.wikipedia.org
- Usage on ca.wikipedia.org
- Usage on cs.wikipedia.org
- Usage on cy.wikipedia.org
- Usage on da.wikipedia.org
- Usage on de.wikipedia.org
- Napoleon Bonaparte
- 1861
- Russlandfeldzug 1812
- Multivariate Verfahren
- Diskussion:Russlandfeldzug 1812
- Sankey-Diagramm
- Informationsgrafik
- Charles Joseph Minard
- Schlacht bei Krasnoi
- Diskussion:Russlandfeldzug 1812/Archiv/1
- Benutzer:Kopiersperre/Informationsdesign
- Wikipedia:WikiBär/SchönerWohnen
- General Winter
- Usage on de.wikiversity.org
- Usage on el.wikipedia.org
- Usage on en.wikiquote.org
- Usage on es.wikipedia.org
- Usage on et.wikipedia.org
View more global usage of this file.