
Mandelbrot_Creation_Animation.gif (600 × 600 pixels, file size: 1.78 MB, MIME type: image/gif, looped, 20 frames, 20 s)
| This is a file from the Wikimedia Commons. Information from its description page there is shown below. Commons is a freely licensed media file repository. You can help. |
Summary
| Description |
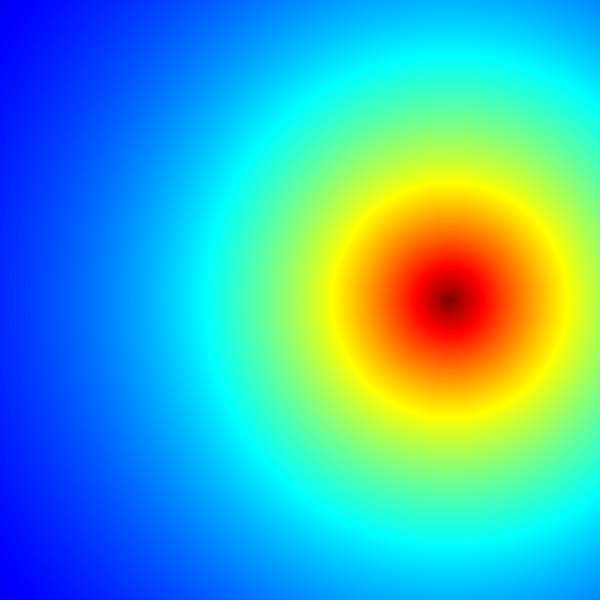
An animated diagram showing iterations of the equation used to generate the Mandelbrot set, a fractal first studied by Benoît Mandelbrot in 1979. The animation shows the values of Z for first 20 iterations of the equation where c is a complex variable. Mandelbrot set graphics are usually generated using the so-called "escape algorithm", where color is assigned according to the number of iterations it took for the equation to diverge past a pre-set limit, and black color is used for regions that never diverge. This, however, is a plot of a much simpler quantity: the actual values of the equation at the first 20 iterations. Every pixel in the image corresponds to a different value of a complex constant c ranging from -2.2 to 1 on the real axis (horizontal) and from -1.2i to 1.2i on the imaginary axis (vertical). Z is initialized to 0. At each iteration, the next value of Z is calculated using the equation above. This graphic was generated with 13 lines of code in the R language (see below for the code). For each point, the magnitude (aka absolute value) of Z is calculated, than scaled using an exponential function to emphasize fine detail, and finally mapped to color palette (jetColors). Dark red is a very low number, dark blue is a very high number. The deep blue region "squeezing" in the boundaries of the fractal is the region where Z value diverges to infinity. |
| Date | |
| Source | Own work |
| Author | Jarekt |
| Other versions |
Mandelbrot Creation Animation (800x600).gif: .gif) |
| GIF development | |
| Source code | R codelibrary(caTools)
jet.colors = colorRampPalette(c("#00007F", "blue", "#007FFF", "cyan", "#7FFF7F", "yellow", "#FF7F00", "red", "#7F0000"))
m = 600
C = complex( real=rep(seq(-1.8,0.6, length.out=m), each=m ),
imag=rep(seq(-1.2,1.2, length.out=m), m ) )
C = matrix(C,m,m)
Z = 0
X = array(0, c(m,m,20))
for (k in 1:20) {
Z = Z^2+C
X[,,k] = exp(-abs(Z))
}
write.gif(X, "Mandelbrot.gif", col=jet.colors, delay=100)
|

Licensing

|
Permission is granted to copy, distribute and/or modify this document under the terms of the GNU Free Documentation License, Version 1.2 or any later version published by the Free Software Foundation; with no Invariant Sections, no Front-Cover Texts, and no Back-Cover Texts. A copy of the license is included in the section entitled GNU Free Documentation License. |
- You are free:
- to share – to copy, distribute and transmit the work
- to remix – to adapt the work
- Under the following conditions:
- attribution – You must give appropriate credit, provide a link to the license, and indicate if changes were made. You may do so in any reasonable manner, but not in any way that suggests the licensor endorses you or your use.
- share alike – If you remix, transform, or build upon the material, you must distribute your contributions under the same or compatible license as the original.
File history
Click on a date/time to view the file as it appeared at that time.
| Date/Time | Thumbnail | Dimensions | User | Comment | |
|---|---|---|---|---|---|
| current | 18:32, 13 June 2007 | | 600 × 600 (1.78 MB) | Jarekt | {{Information |Description=Animation GIF file showing iteration of creating Mandelbrot set image |Source=self-made |Date=06/13/2007 |Author= Jarekt }} Image generated using R language and executing the following code: library(caTools) jet |
File usage
Global file usage
The following other wikis use this file:
- Usage on cs.wikipedia.org
- Usage on en.wikibooks.org
- Usage on fa.wikipedia.org
- Usage on fi.wikipedia.org
- Usage on hi.wikipedia.org
- Usage on hr.wikipedia.org
- Usage on kn.wikipedia.org
- Usage on mn.wikipedia.org
- Usage on pt.wikipedia.org
- Usage on zh.wikipedia.org