
No higher resolution available.
Carbon_cycle-cute_diagram.jpeg (540 × 417 pixels, file size: 52 KB, MIME type: image/jpeg)
| This is a file from the Wikimedia Commons. Information from its description page there is shown below. Commons is a freely licensed media file repository. You can help. |
Summary
| Description |
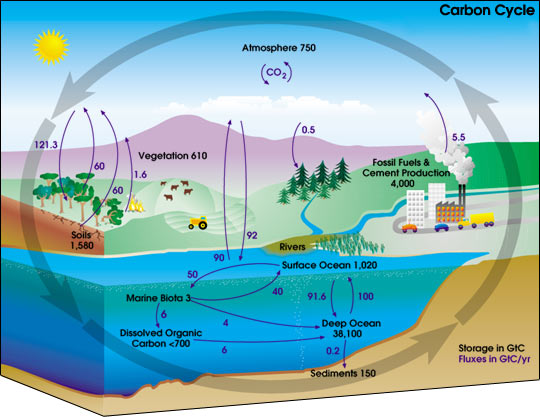
This carbon cycle diagram shows the storage and annual exchange of carbon between the atmosphere, hydrosphere and geosphere in gigatons - or billions of tons - of Carbon (GtC). Burning fossil fuels by people adds about 5.5 GtC of carbon per year into the atmosphere.
|
|||||
| Source | https://earthobservatory.nasa.gov/features/CarbonCycle | |||||
| Author | User Kevin Saff on en.wikipedia | |||||
| Permission (Reusing this file) |
|
|||||
| Other versions |
[] Single-language versions
Derivative works of this file: Originally from en.wikipedia; description page is (was) here * 20:01, 6 May 2004 [[:en:User:Kevin Saff|Kevin Saff]] 540×417 (53,453 bytes) <span class="comment">([[:en:Carbon cycle]], diagram with little cars and things.)</span> File:Carbon cycle-cute diagram-zh-Hans.jpeg |


(Uploaded using CommonsHelper or PushForCommons archive copy at the Wayback Machine)
Licensing
| This file is in the public domain in the United States because it was solely created by NASA. NASA copyright policy states that "NASA material is not protected by copyright unless noted". (See Template:PD-USGov, NASA copyright policy page or JPL Image Use Policy.) | ||
 |
Warnings:
|

|
File:Carbon cycle-cute diagram.svg is a vector version of this file. It should be used in place of this JPEG file when not inferior.
File:Carbon cycle-cute diagram.jpeg → File:Carbon cycle-cute diagram.svg
For more information, see Help:SVG. |
 |
File history
Click on a date/time to view the file as it appeared at that time.
| Date/Time | Thumbnail | Dimensions | User | Comment | |
|---|---|---|---|---|---|
| current | 15:16, 12 September 2006 | | 540 × 417 (52 KB) | Giac83 | {{Information| |Description= This en:carbon cycle diagram shows the storage and yearly changes of the carbon between the atmosphere, en:hydrosphere and en:geosphere in Gigatons - or billion tons - of Carbon (GtC). |
File usage
The following pages on the English Wikipedia use this file (pages on other projects are not listed):
Global file usage
The following other wikis use this file:
- Usage on ar.wikipedia.org
- Usage on el.wikipedia.org