
No higher resolution available.
Box-Plot_mit_Min-Max_Abstand.png (715 × 536 pixels, file size: 16 KB, MIME type: image/png)
| This is a file from the Wikimedia Commons. Information from its description page there is shown below. Commons is a freely licensed media file repository. You can help. |
Summary
| Description |
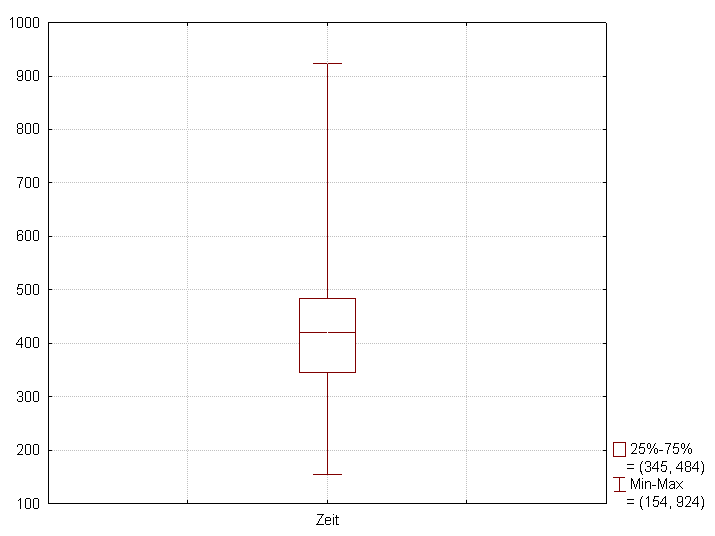
Plot of a box-plot with whiskers to Min and Max of the Data. The plot was created with Statistica v.8.0 |
| Date |
|
| Source |
Own work |
| Author |
Schlurcher |

|
This graph image could be re-created using vector graphics as an SVG file. This has several advantages; see Commons:Media for cleanup for more information. If an SVG form of this image is available, please upload it and afterwards replace this template with
{{vector version available|new image name}}.
It is recommended to name the SVG file “Box-Plot mit Min-Max Abstand.svg”—then the template Vector version available (or Vva) does not need the new image name parameter. |
Licensing
I, the copyright holder of this work, hereby publish it under the following licenses:
This file is licensed under the Creative Commons Attribution 4.0 International license.
- You are free:
- to share – to copy, distribute and transmit the work
- to remix – to adapt the work
- Under the following conditions:
- attribution – You must give appropriate credit, provide a link to the license, and indicate if changes were made. You may do so in any reasonable manner, but not in any way that suggests the licensor endorses you or your use.

|
Permission is granted to copy, distribute and/or modify this document under the terms of the GNU Free Documentation License, Version 1.2 only as published by the Free Software Foundation; with no Invariant Sections, no Front-Cover Texts, and no Back-Cover Texts. A copy of the license is included in the section entitled GNU Free Documentation License. | 1.2 only |
This file is licensed under the Creative Commons Attribution 3.0 Unported license.
- You are free:
- to share – to copy, distribute and transmit the work
- to remix – to adapt the work
- Under the following conditions:
- attribution – You must give appropriate credit, provide a link to the license, and indicate if changes were made. You may do so in any reasonable manner, but not in any way that suggests the licensor endorses you or your use.
You may select the license of your choice.
| Attribution (required by the license) | © Schlurcher / |
Deutsch: Sollten Sie eine andere Form der Namensnennung oder Lizenzierung benötigen, so können Sie sich gerne auf meiner Benutzerseite unter dem Punkt "E-Mail an diesen Benutzer" an mich wenden um weitere Möglichkeiten zu besprechen.
English: If you need an other licence or form of attribution, you can contact me at my discussion page or via e-mail: Click here
Русский: Если Вам нужна другая форма указания авторства или лицензии, Вы можете связаться со мной на моей дискуссионной странице либо по e-mail. |
File history
Click on a date/time to view the file as it appeared at that time.
| Date/Time | Thumbnail | Dimensions | User | Comment | |
|---|---|---|---|---|---|
| current | 14:28, 5 March 2009 | | 715 × 536 (16 KB) | Schlurcher | {{Information |Description={{en|1=Plot of a box-plot with whiskers to Min and Max of the Data. The plot was created with Statistica v.8.0}} {{de|1=Zeichnung eines Box-Plot mit Whiskern, die vom Minimum bis zum Maximum der Daten reichen. Das Diagramm wurde |
File usage
The following pages on the English Wikipedia use this file (pages on other projects are not listed):
Global file usage
The following other wikis use this file:
- Usage on cs.wikipedia.org
- Usage on de.wikipedia.org
- Usage on id.wikipedia.org
- Usage on pt.wikipedia.org
- Usage on uk.wikipedia.org
- Usage on uz.wikipedia.org
- Usage on www.wikidata.org