To install click the Add extension button. That's it.

The source code for the WIKI 2 extension is being checked by specialists of the Mozilla Foundation, Google, and Apple. You could also do it yourself at any point in time.

4,5
Kelly Slayton
Congratulations on this excellent venture… what a great idea!
Alexander Grigorievskiy
I use WIKI 2 every day and almost forgot how the original Wikipedia looks like.
Live Statistics
English Articles
Improved in 24 Hours
Added in 24 Hours
What we do. Every page goes through several hundred of perfecting techniques; in live mode. Quite the same Wikipedia. Just better.
.
Leo
Newton
Brights
Milds

File:Beta distribution pdf.svg

From Wikipedia, the free encyclopedia

Original file(SVG file, nominally 531 × 425 pixels, file size: 80 KB)

Summary

Description
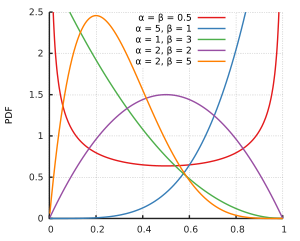
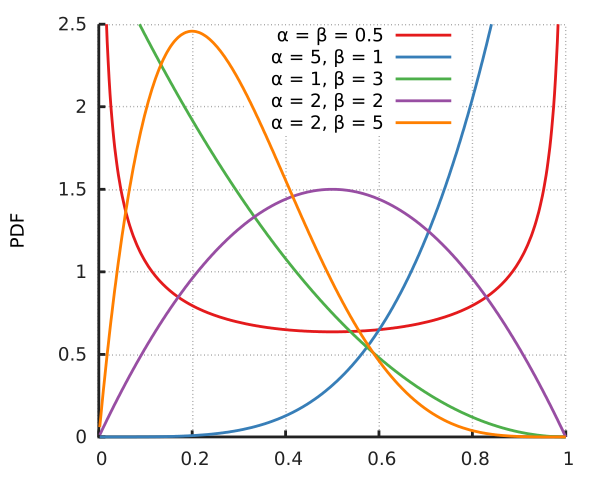
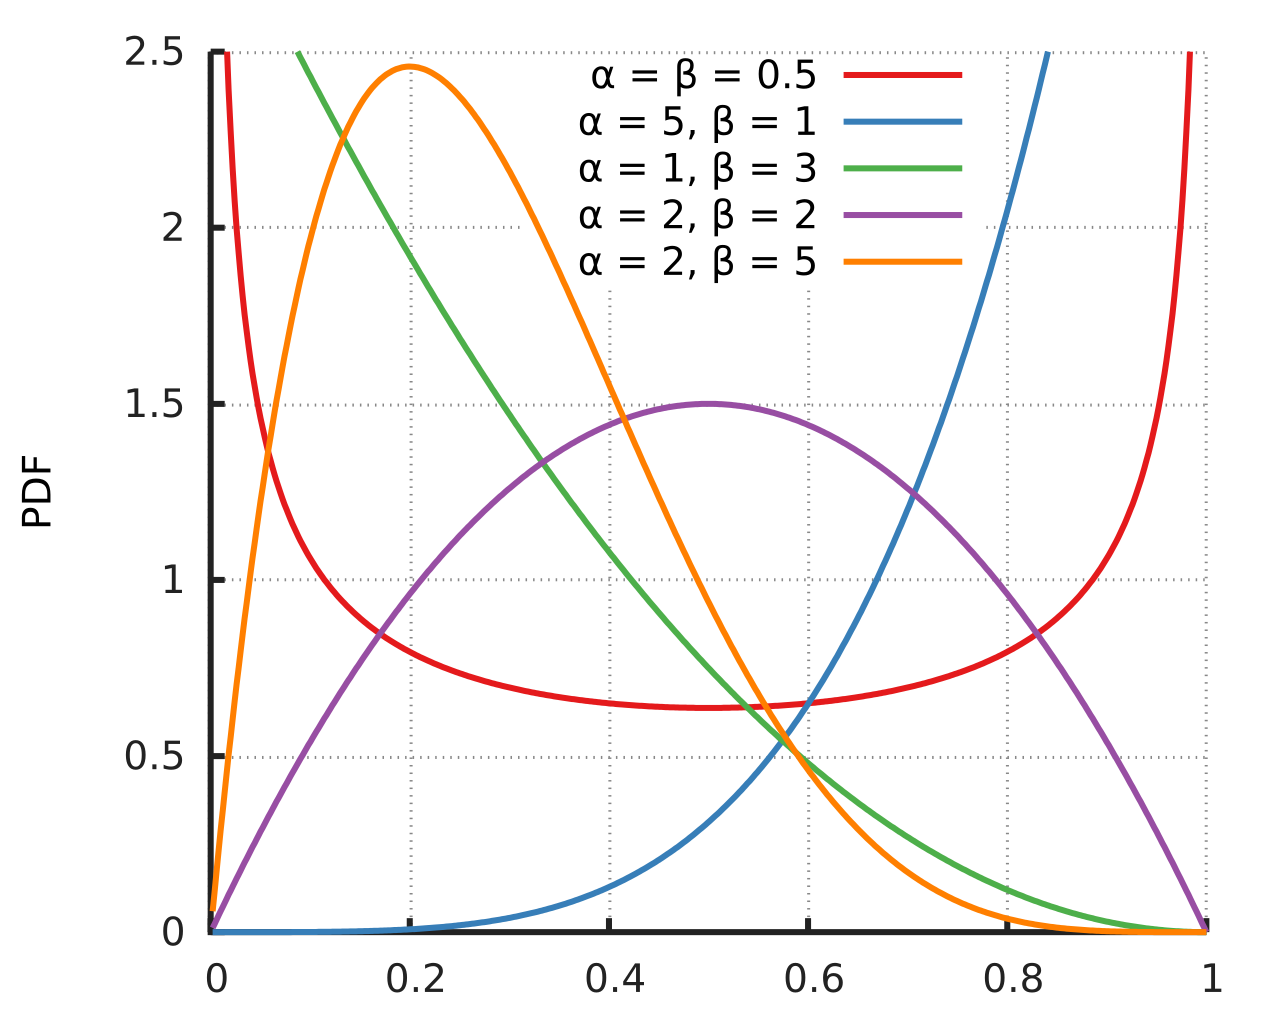
Probability density function for the Beta distribution. Created using Gnuplot.
Date
Source Own work
Author Horas based on the work of Krishnavedala
Other versions File:Beta_distribution_pdf.png
SVG development
InfoField
 
The SVG code is valid.
 
This chart was created with Gnuplot.
 
The file size of this SVG plot may be irrationally large because its text has been converted to paths inhibiting translations.
Source code
InfoField

Gnuplot code

Source code
reset
reset session

out=2
outputpath= "./"
outputfilename="betadistribution"
if(out==1) {
	set terminal qt size 1000,750 font ",14"
}
if(out==2) {
	set terminal pdfcairo size 15cm,12cm  font ",20" linewidth 2
	set output outputpath.outputfilename.".pdf"
}
if(out==3) {
	set terminal pngcairo size 800,600  font ",14"
	set output  outputpath.outputfilename.".png"
}

dbeta(x,a,b) = exp((a-1)*log(x)+(b-1)*log(1-x)-lgamma(a)-lgamma(b)+lgamma(a+b))
pbeta(x,a,b) = ibeta(a,b,x)
f(x,y,z) = dbeta(x,y,z)

set samples 500
 
set xrange [0:1]
set xtics 0.2
set yrange [0:2.5]
set ytics 0.5

#set xlabel "x"
set ylabel "PDF"

set key at .78,2.5

set grid xtics ytics mytics lw 1 lc rgb "#888888" dashtype 3 lt 1
set border 3 back lw 2 lc rgb "#222222"
set tics in nomirror scale 0.75

lww=2
set ls 1 lw lww lc rgb "#e41a1c"
set ls 2 lw lww lc rgb "#377eb8"
set ls 3 lw lww lc rgb "#4daf4a"
set ls 4 lw lww lc rgb "#984ea3"
set ls 5 lw lww lc rgb "#ff7f00"

plot \
    f(x, 0.5,0.5) w l ls 1	title "{/Symbol a} = {/Symbol b} = 0.5", \
    f(x, 5,  1)   w l ls 2	title "{/Symbol a} = 5, {/Symbol b} = 1", \
    f(x, 1,  3)   w l ls 3	title "{/Symbol a} = 1, {/Symbol b} = 3", \
    f(x, 2,  2)   w l ls 4	title "{/Symbol a} = 2, {/Symbol b} = 2", \
    f(x, 2,  5)   w l ls 5	title "{/Symbol a} = 2, {/Symbol b} = 5"

if (out>1) {
	set output
}
if (out == 1) {
	pause -1

Data

Source code
from matplotlib.pyplot import *
from numpy import linspace
from scipy.stats import beta

x = linspace(0,1,75)

fig = figure()
ax = fig.add_subplot(111)
ax.plot(x,beta.pdf(x,0.5,0.5),label=r"$\alpha=\beta=0.5$")
ax.plot(x,beta.pdf(x,5,1),label=r"$\alpha=5, \beta=1$")
ax.plot(x,beta.pdf(x,1,3),label=r"$\alpha=1, \beta=3$")
ax.plot(x,beta.pdf(x,2,2),label=r"$\alpha=2, \beta=2$")
ax.plot(x,beta.pdf(x,2,5),label=r"$\alpha=2, \beta=5$")
ax.grid(True)
ax.minorticks_on()
ax.legend(loc=9)
setp(ax.get_legend().get_texts(),fontsize='small')
ax.set_ylim(0,2.6)
ax.set_xlabel("x")
ax.set_ylabel("PDF")

fig.savefig("Beta_distribution_pdf.svg",bbox_inches="tight",\
	pad_inches=.15)

Licensing

This work is ineligible for copyright and therefore in the public domain because it consists entirely of information that is common property and contains no original authorship.

Captions

Add a one-line explanation of what this file represents

Items portrayed in this file

depicts

14 November 2014

image/svg+xml

de326fe46a16d6d3650e15c3fcb708853472be46

81,527 byte

425 pixel

531 pixel

File history

Click on a date/time to view the file as it appeared at that time.

Date/TimeThumbnailDimensionsUserComment
current13:10, 14 November 2014Thumbnail for version as of 13:10, 14 November 2014531 × 425 (80 KB)Horas{{Information |Description={{en|1=Probability density function for the Beta distribution. Created using the following code: reset reset session out=2 outputpath= "./" outputfilename="betadistribution" if(out==1) {...
21:45, 4 June 2011Thumbnail for version as of 21:45, 4 June 2011639 × 489 (68 KB)Krishnavedala{{Information |Description ={{en|1=Probability density function for the Beta distribution. Created using python with matplotlib, scipy and numpy toolboxes. <syntaxhighlight lang="
The following pages on the English Wikipedia use this file (pages on other projects are not listed):

Global file usage

The following other wikis use this file:

Metadata

Basis of this page is in Wikipedia. Text is available under the CC BY-SA 3.0 Unported License. Non-text media are available under their specified licenses. Wikipedia® is a registered trademark of the Wikimedia Foundation, Inc. WIKI 2 is an independent company and has no affiliation with Wikimedia Foundation.