
_png)
![This image shows how carbon dioxide and other "non-condensing" greenhouse gases sustain the Earth's greenhouse effect. From the public-domain source: "Attribution of individual atmospheric component contributions to the terrestrial greenhouse effect, separated into feedback and forcing categories. Dotted and dashed lines depict the fractional response for single-addition and single-subtraction of individual gases to either an empty or full-component reference atmosphere, respectively. Solid black lines are the scaled averages of the dashed and dotted line fractional response results. The sum of the fractional responses must add up to the total greenhouse effect. The reference model atmosphere is for 1980 conditions. (...) Radiative modeling analyses of the terrestrial greenhouse structure described in a parallel study in the Journal of Geophysical Research (Schmidt et al., 2010) found that water vapor accounts for about 50% of the Earth's greenhouse effect, with clouds contributing 25%, carbon dioxide 20%, and the minor greenhouse gases (GHGs) and aerosols accounting for the remaining 5%, as shown in (this image). The following paragraph is not contained in the paper but was attached to the one above as if the author had included it: see http://pubs.giss.nasa.gov/docs/2010/2010_Schmidt_etal_1.pdf and http://pubs.giss.nasa.gov/abs/sc05400j.html Thus, while the non-condensing greenhouse gases account for only 25% of the total greenhouse effect, it is these non-condensing GHGs that actually control the strength of the terrestrial greenhouse effect since the water vapor and cloud feedback contributions are not self-sustaining and as such, only provide amplification. Because carbon dioxide accounts for 80% of the non-condensing GHG forcing in the current climate atmosphere, atmospheric carbon dioxide therefore qualifies as the principal control knob that governs the temperature of Earth." References: Schmidt, G.A., R. Ruedy, R.L. Miller, and A.A. Lacis (2010), “The attribution of the present-day total greenhouse effect”, in J. Geophys. Res.[1], volume 115, DOI:10.1029/2010JD014287, archived from the original on 2011-10-22, D20106. Web page for paper.](http://upload.wikimedia.org/wikipedia/commons/0/06/Attribution_of_individual_atmospheric_component_contributions_to_the_terrestrial_greenhouse_effect%2C_separated_into_feedback_and_forcing_categories_%28NASA%29.png)
Original file (3,266 × 2,333 pixels, file size: 51 KB, MIME type: image/png)
| This is a file from the Wikimedia Commons. Information from its description page there is shown below. Commons is a freely licensed media file repository. You can help. |
.png)

|
This graph image could be re-created using vector graphics as an SVG file. This has several advantages; see Commons:Media for cleanup for more information. If an SVG form of this image is available, please upload it and afterwards replace this template with
{{vector version available|new image name}}.
It is recommended to name the SVG file “Attribution of individual atmospheric component contributions to the terrestrial greenhouse effect, separated into feedback and forcing categories (NASA).svg”—then the template Vector version available (or Vva) does not need the new image name parameter. |
Summary
| Description |
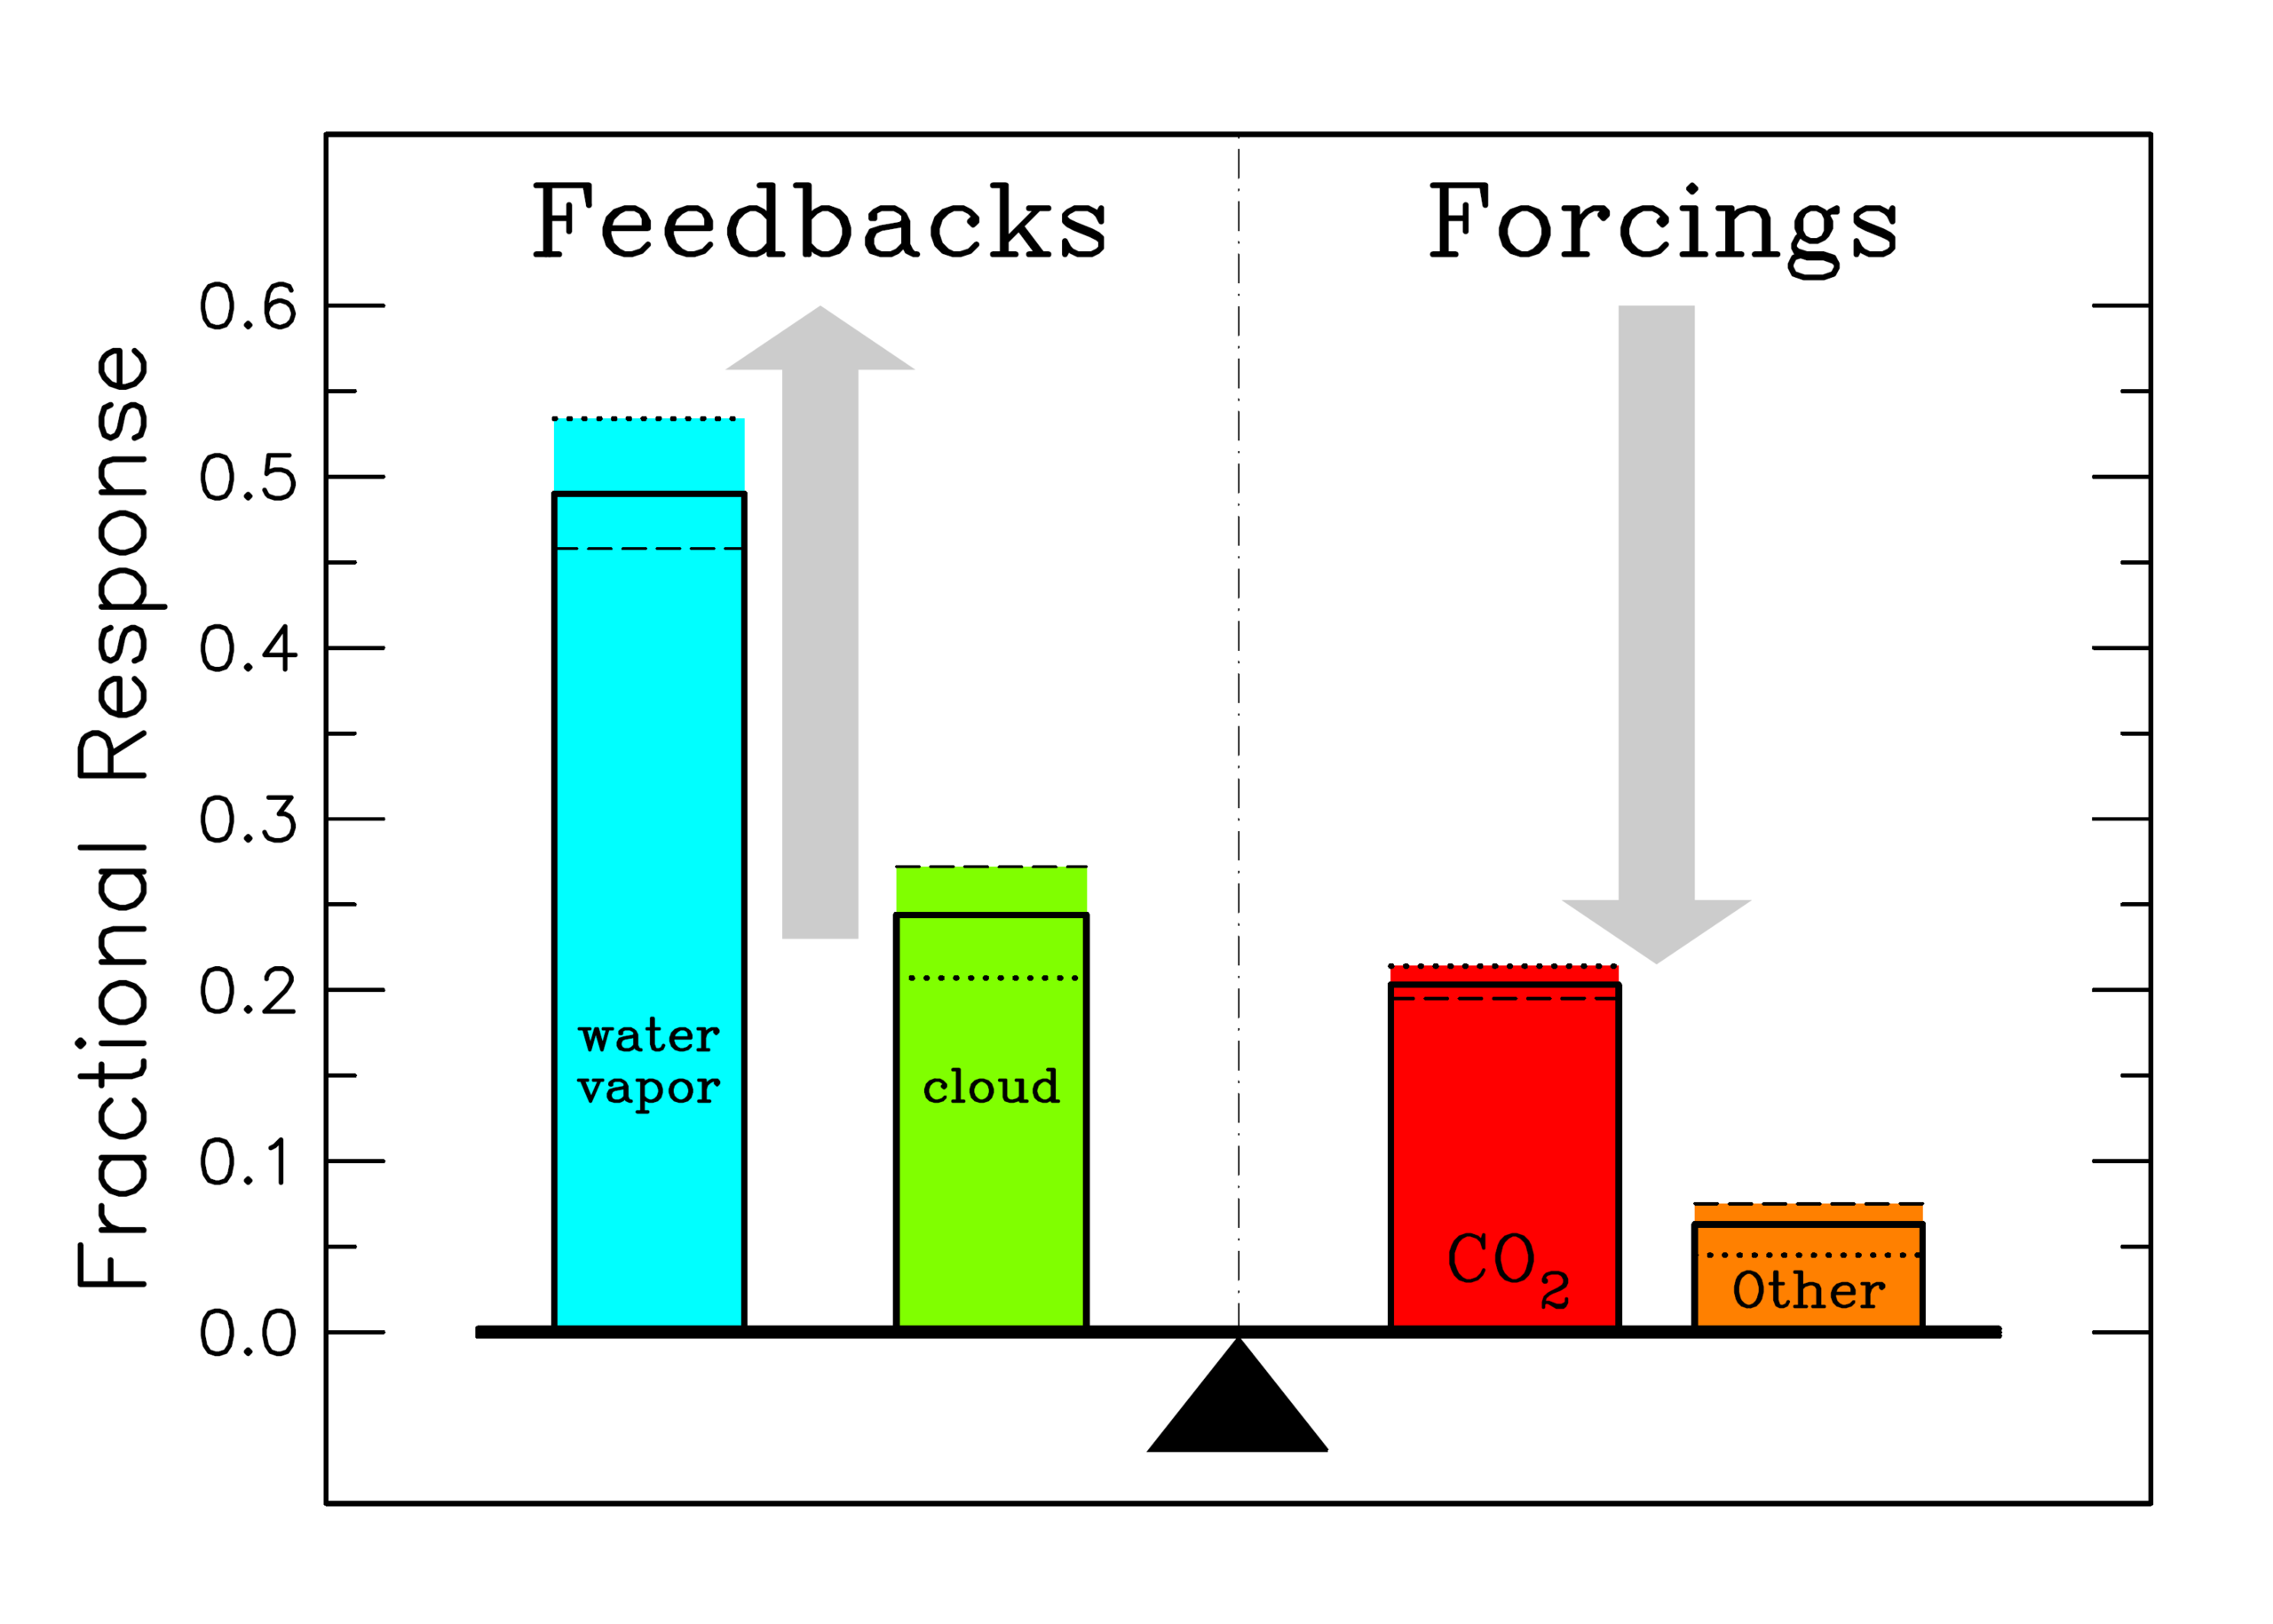
This image shows how carbon dioxide and other "non-condensing" greenhouse gases sustain the Earth's greenhouse effect. From the public-domain source: "Attribution of individual atmospheric component contributions to the terrestrial greenhouse effect, separated into feedback and forcing categories. Dotted and dashed lines depict the fractional response for single-addition and single-subtraction of individual gases to either an empty or full-component reference atmosphere, respectively. Solid black lines are the scaled averages of the dashed and dotted line fractional response results. The sum of the fractional responses must add up to the total greenhouse effect. The reference model atmosphere is for 1980 conditions.
(...) Radiative modeling analyses of the terrestrial greenhouse structure described in a parallel study in the Journal of Geophysical Research (Schmidt et al., 2010) found that water vapor accounts for about 50% of the Earth's greenhouse effect, with clouds contributing 25%, carbon dioxide 20%, and the minor greenhouse gases (GHGs) and aerosols accounting for the remaining 5%, as shown in (this image). The following paragraph is not contained in the paper but was attached to the one above as if the author had included it: see http://pubs.giss.nasa.gov/docs/2010/2010_Schmidt_etal_1.pdf and http://pubs.giss.nasa.gov/abs/sc05400j.html Thus, while the non-condensing greenhouse gases account for only 25% of the total greenhouse effect, it is these non-condensing GHGs that actually control the strength of the terrestrial greenhouse effect since the water vapor and cloud feedback contributions are not self-sustaining and as such, only provide amplification. Because carbon dioxide accounts for 80% of the non-condensing GHG forcing in the current climate atmosphere, atmospheric carbon dioxide therefore qualifies as the principal control knob that governs the temperature of Earth."
References:
|
| Date | |
| Source | NASA GISS: CO2: The Thermostat that Controls Earth's Temperature[2], New York: NASA GISS, (Please provide a date or year), archived from the original on 2013-01-04 |
| Author | Andrew Lacis |
| Other versions | العربيَّة |
-ar.png)
Licensing
| This file is in the public domain in the United States because it was solely created by NASA. NASA copyright policy states that "NASA material is not protected by copyright unless noted". (See Template:PD-USGov, NASA copyright policy page or JPL Image Use Policy.) | ||
 |
Warnings:
|
File history
Click on a date/time to view the file as it appeared at that time.
| Date/Time | Thumbnail | Dimensions | User | Comment | |
|---|---|---|---|---|---|
| current | 10:55, 28 March 2013 | | 3,266 × 2,333 (51 KB) | Enescot | {{Information |Description ={{en|1=This image shows how carbon dioxide and other "non-condensing" greenhouse gases sustain the Earth's greenhouse effect. F... |
File usage
Global file usage
The following other wikis use this file:
- Usage on ar.wikipedia.org
- Usage on es.wikipedia.org
- Usage on pt.wikipedia.org
- Usage on ro.wikipedia.org
- Usage on te.wikipedia.org
.png)