
Size of this preview: 657 × 600 pixels. Other resolutions: 263 × 240 pixels | 526 × 480 pixels | 842 × 768 pixels | 1,122 × 1,024 pixels | 2,244 × 2,048 pixels | 5,473 × 4,995 pixels.
Original file (5,473 × 4,995 pixels, file size: 1.18 MB, MIME type: image/png)
| This is a file from the Wikimedia Commons. Information from its description page there is shown below. Commons is a freely licensed media file repository. You can help. |
Summary
| Description |
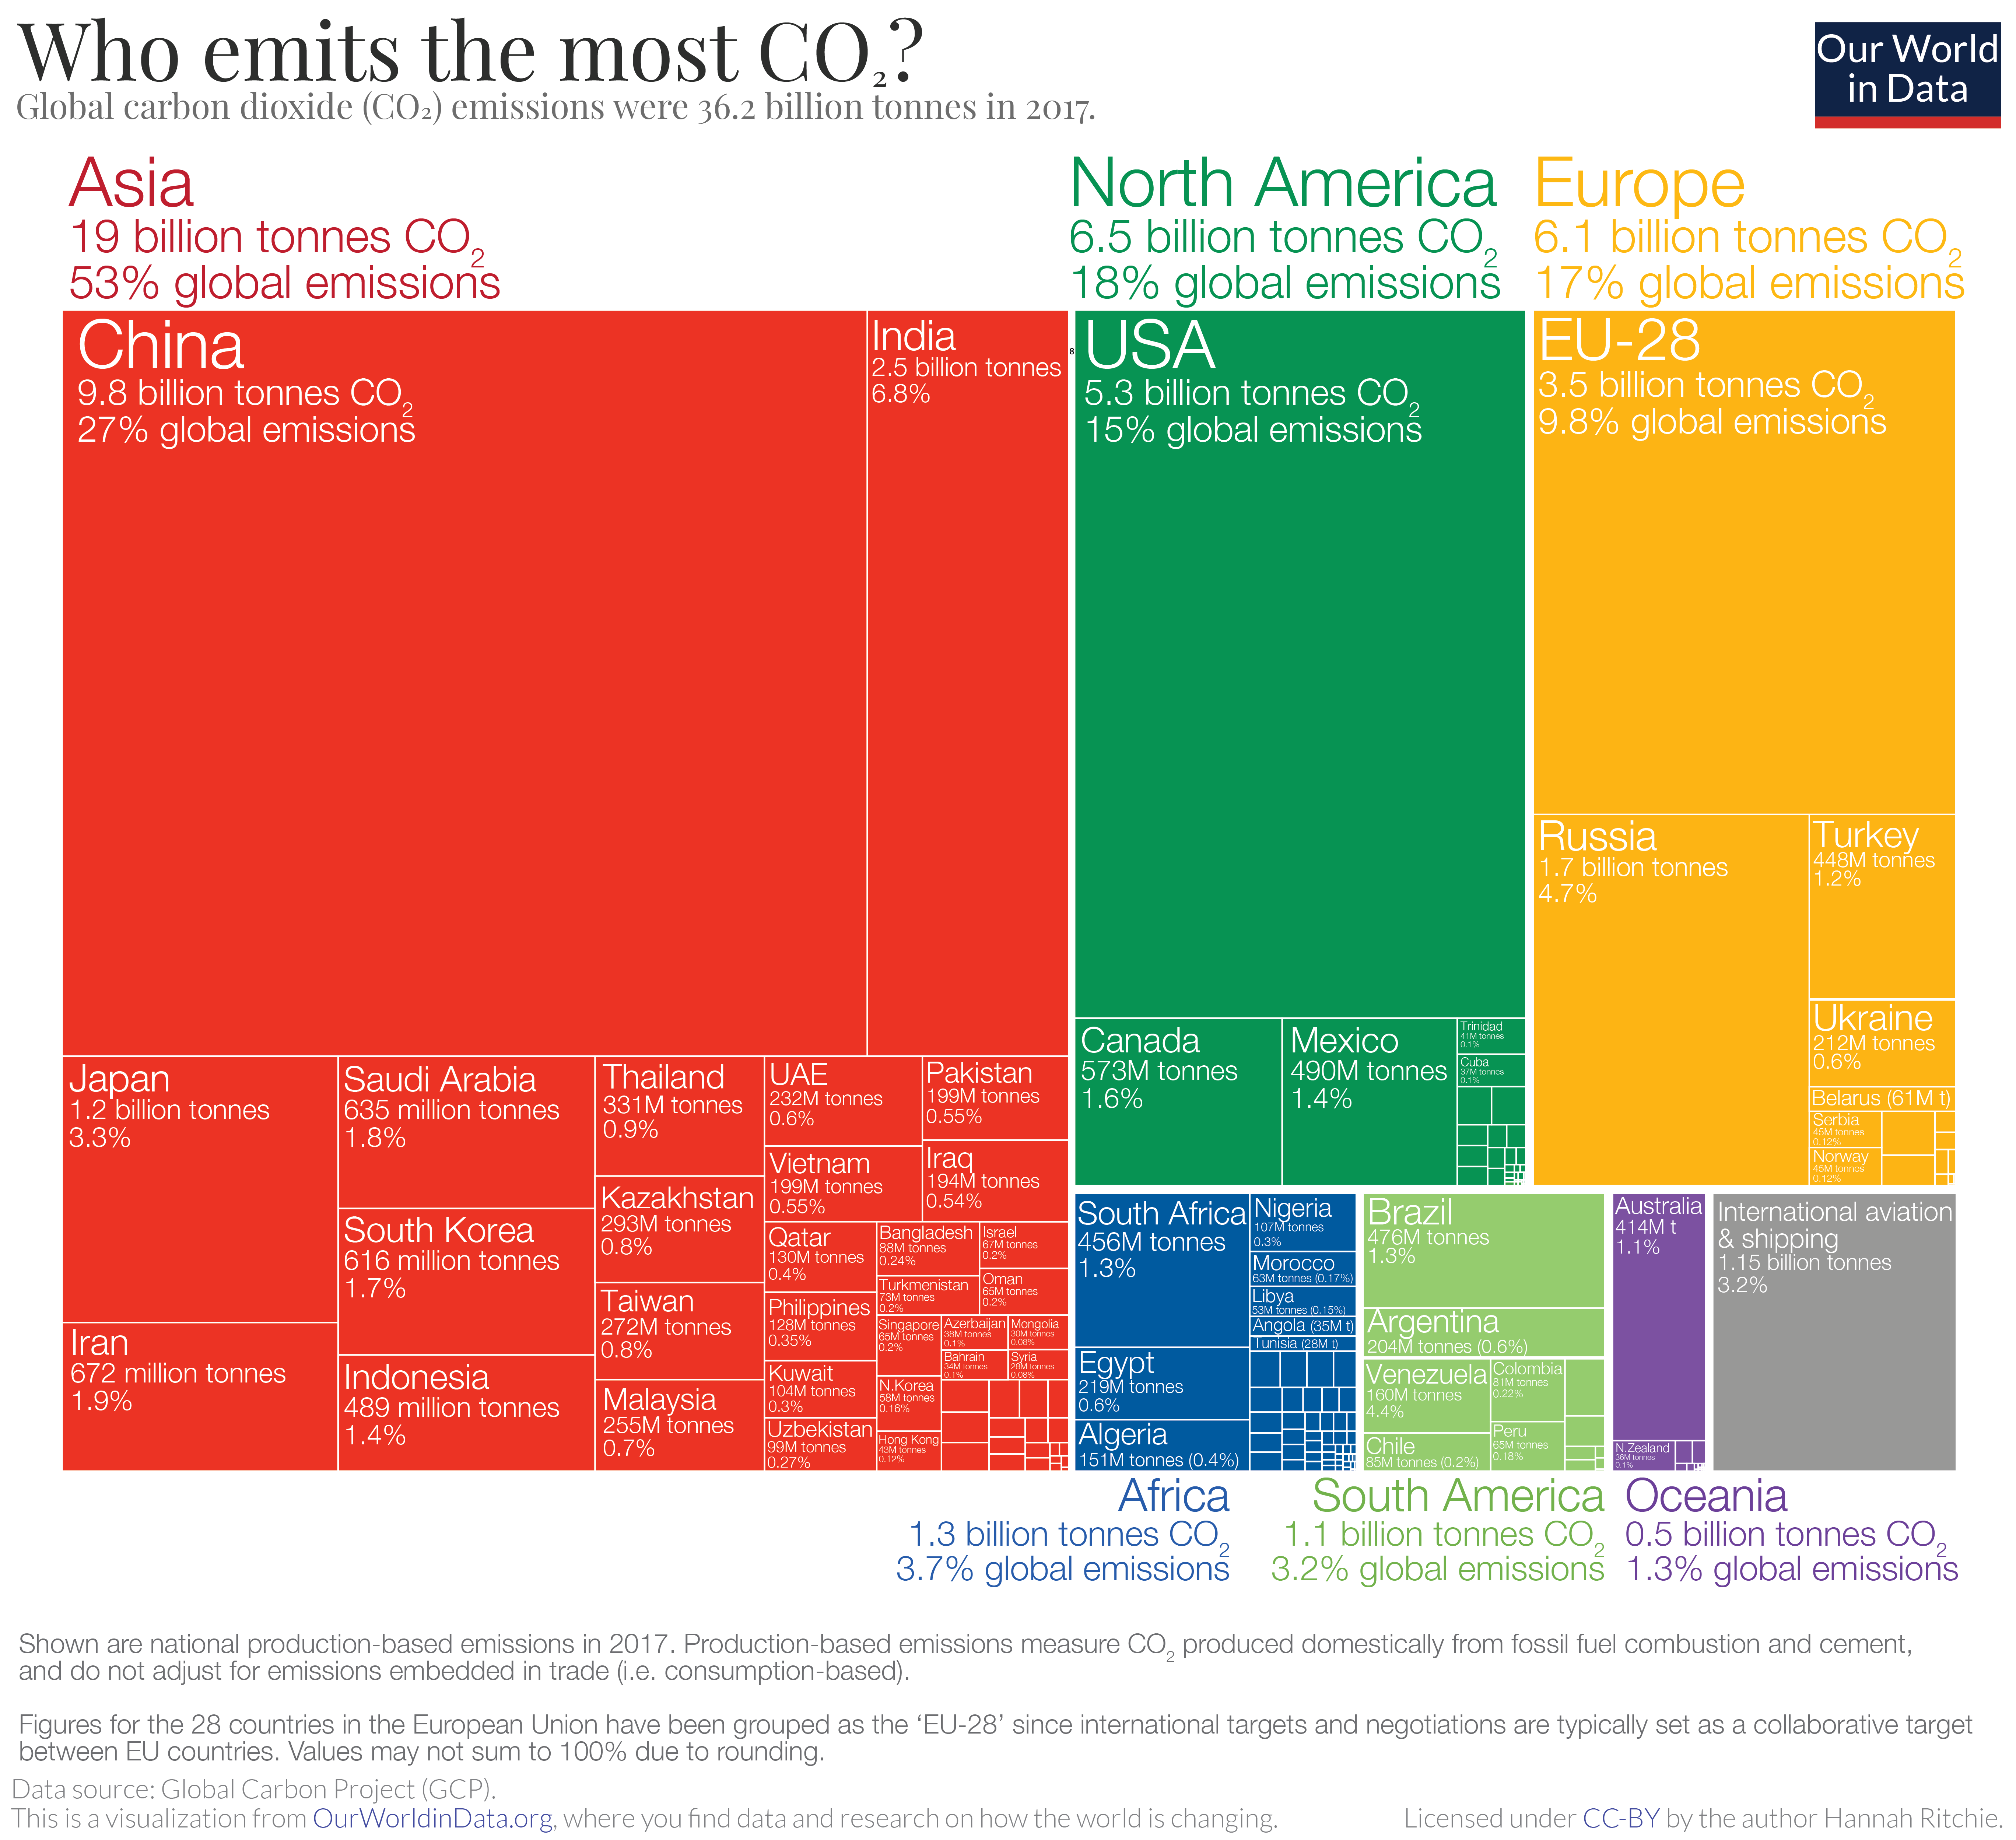
Who emits the most CO2 each year? In the treemap visualization we show annual CO2 emissions by country, and aggregated by region. Treemaps are used to compare entities (such as countries or regions) in relation to others, and relative to the total. Here each inner rectangle represents a country – which are then nested and colored by region. The size of each rectangle corresponds to its annual CO2 emissions in 2017. Combined, all rectangles represent the global total. |
| Date | |
| Source | https://ourworldindata.org/co2-emissions#annual-co2-emissions |
| Author | Hannah Ritchie, Max Roser |
Licensing
This file is licensed under the Creative Commons Attribution 4.0 International license.
- You are free:
- to share – to copy, distribute and transmit the work
- to remix – to adapt the work
- Under the following conditions:
- attribution – You must give appropriate credit, provide a link to the license, and indicate if changes were made. You may do so in any reasonable manner, but not in any way that suggests the licensor endorses you or your use.
File history
Click on a date/time to view the file as it appeared at that time.
| Date/Time | Thumbnail | Dimensions | User | Comment | |
|---|---|---|---|---|---|
| current | 01:06, 28 March 2023 | | 5,473 × 4,995 (1.18 MB) | <bdi>Stoffl32</bdi> | Uploaded a work by Hannah Ritchie, Max Roser from https://ourworldindata.org/co2-emissions#annual-co2-emissions with UploadWizard |
File usage
The following pages on the English Wikipedia use this file (pages on other projects are not listed):
Global file usage
The following other wikis use this file:
- Usage on ro.wikipedia.org
- Usage on sr.wikipedia.org