
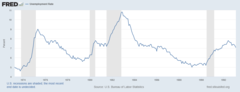
 U.S. unemployment rate | |
| Duration | 1980–1982[1] |
|---|---|
| Cause | tight monetary policy in an effort to fight high inflation percentages worldwide |
| Outcome | skyrocketing unemployment worldwide, increased wealth inequality, increased divorce rates, urban decay, exacerbation of the Savings and loan crisis, wage stagnation, drop in inflation percentages worldwide |
The early 1980s recession was a severe economic recession that affected much of the world between approximately the start of 1980 and 1982.[1][2][3] It is widely considered to have been the most severe recession since World War II until the 2007–2008 financial crisis.[4][5][3]
YouTube Encyclopedic
-
1/5Views:1 079 622951 3961 600 316997 5851 650
-
The Stock Market Crash of 1987 | Cancel Crash
-
Recession, Hyperinflation, and Stagflation: Crash Course Econ #13
-
Ford, Carter, and the Economic Malaise: Crash Course US History #42
-
What causes an economic recession? - Richard Coffin
-
Robert Barro on the Recession
Transcription
Background
The recession had multiple causes including the tightening of monetary policies by the United States and other developed nations.[3] This was exacerbated by the 1979 energy crisis, mostly caused by the Iranian Revolution which saw oil prices rising sharply in 1979 and early 1980. [3] The sharp rise in oil prices pushed the already high rates of inflation in several major advanced countries to new double-digit highs, with countries such as the United States, Canada, West Germany, Italy, the United Kingdom and Japan tightening their monetary policies by increasing interest rates in order to control the inflation.[3] These G7 countries each, in fact, had "double-dip" recessions involving short declines in economic output in parts of 1980 followed by a short period of expansion, in turn, followed by a steeper, longer period of economic contraction starting sometime in 1981 and ending in November 1982.[6] Most of these countries experienced stagflation, a situation of both high inflation rates and high unemployment rates.
Globally, while some countries experienced downturns in economic output in 1980 and/or 1981, the broadest and sharpest worldwide decline of economic activity and the largest increase in unemployment was in 1982, with the World Bank naming the recession the "global recession of 1982".[3] Even after major economies, such as the United States and Japan exited the recession relatively early, many countries were in recession into 1983 and high unemployment would continue to affect most OECD nations until at least 1985.[4] Long-term effects of the early 1980s recession contributed to the Latin American debt crisis, long-lasting slowdowns in the Caribbean and Sub-Saharan African countries,[3] the US savings and loans crisis, and a general adoption of neoliberal economic policies throughout the 1990s.
Impact by country
Canada
The Canadian economy experienced overall weakness from the start of 1980 to the end of 1983, with low yearly real GDP growth rates of 2.1% and 2.6% in 1980 and 1983, respectively, and a steep 3.2% decline in real GDP for 1982.[7] As with other G7 countries, Canada had two separate economic contractions in the early 1980s.[6] These were a shallow drop in GDP and a slowing in employment growth for five months between February and June 1980, and a deeper 17-month contraction in both GDP and employment between July 1981 and October 1982,[8] although both contractions were driven by the same desire of governments to reduce inflation by increasing interest rates.[9] Real Canadian GDP declined by 5% during the 17-month 1981-82 recession with the unemployment rate peaking at 12%.[10] In-between the two downturns, Canada had 12 months of economic growth. With growth between October 1980 and June 1981 being relatively robust with the total GDP and employment in June 1981 actually surpassing their pre-recession peaks[9] and 1981 having a yearly increase in real GDP of 3.5%.[7]
Canada had higher inflation, interest rates, and unemployment than the United States during the early 1980s recession.[11] While inflation accelerated across North America in the late 1970s, it was higher in Canada because of the US decision to switch to a floating exchange rate, which lowered the value of the Canadian dollar to US$0.85 by 1979, which made US imports more expensive for Canadians to purchase.[12] Canada's inflation rate was 10.2% for 1980 overall, rising to 12.5% for 1981 and 10.8% for 1982 before dropping to 5.8% for 1983.[13]
To control its inflation, the US introduced credit controls producing a slump in demand for Canada's housing and auto industry exports in early 1980 thereby triggering the early first portion of the recession in Canada.[9] Most Canadians were also hit hard financially by a steady rise in oil and gas prices during the 1970s, especially their acceleration in 1979 when the worldwide oil supply was disrupted by the Iranian revolution,[3] with the price of oil reaching almost $40 a barrel compared to $3 a barrel at the start of the decade.[12]
The Bank of Canada raised its prime interest rate throughout 1980 and early 1981 in an attempt to rein in inflation, with the deeper second portion of the recession beginning in July 1981.[10] The Bank of Canada's interest rate peaked at 21% in August 1981 and was kept at high levels until spring 1982, but the inflation rate still averaged more than 12% in 1981-82.[10] [12] Alberta, the prime location of Canada's oil industry at the time, experienced a boom in the late 1970s, 1980 and early 1981, with rapid employment growth, attaining, at 76%, the highest percentage of persons aged 15–64 being employed (defined as the "employment ratio") of all the provinces in early 1981.[14] By the start of 1982, however, Alberta's oil boom had ended due to over-expansion and the deep global recession of that year, which caused oil prices to plummet, with Alberta then suffering a drop of 7.2 percentage points in its employment ratio of all the provinces by mid-1983.[12][14] Yukon's mining industry was also hit hard and more than 70,000 of 115,000 miners across the country were out of work by the end of 1982.[11]
Canada's GDP increased markedly in November 1982 officially ending the recession, although employment growth did not resume until December 1982[9] before faltering again in 1983. The average unemployment rates for 1982 and 1983 averaged 11.1% and 12%, respectively, steep rises from 7.6% in 1981.[13] A slowdown in productivity in Canada also emerged during the recession as average output per worker slowed by 1%.[10] The lingering effects of the recession combined with mechanization and companies downsizing to complete internationally, kept Canada's unemployment rates above 10% until 1986.[13] Despite this, Canada's GDP growth rate was among the highest of the OECD countries from 1984 to 1986, although growth was by far strongest in Ontario and Quebec.[11]
Japan
Throughout the 1970s, Japan had the world's third largest gross national product (GNP)—just behind the United States and Soviet Union—and ranked first among major industrial nations in 1990 in per capita GNP at US$23,801, up sharply from US$9,068 in 1980. After the relatively mild economic slump that the Japanese called "the lost decade",in the mid-1980s, Japan's economy began a period of expansion in 1986 that continued until it again entered a recessionary period in 1992. But the property market still never returned to its “pre-boom” levels. [1] The Tokyo stock exchange doubled in 1983 from Y8,800 to Y16,401 in 1986. But the surge that hit its peak of Y26,646 was temporarily halted by “Black Monday” on October 14th, 1987. “Black Monday” was a crash that ended up hitting the US stock market, causing it to plummet.Then by April 1988, the stock reached past its October record breaking peak and hit Y38,915. [2] Japan’s recession was prolonged into the 90s and they were not able to recover from the increased prices until the early 2000s. Where it finally officially ended in 2002.[3]
United Kingdom
Economic impact

Eventually recession hit the United Kingdom at the beginning of the 1980s. That followed a string of crises that had plagued the British economy for most of the 1970s. Consequently, unemployment had gradually increased since the mid-1960s.
When the Conservative Party, led by Margaret Thatcher won the general election of May 1979, and swept James Callaghan's Labour Party from power, the country had just witnessed the Winter of Discontent in which numerous public sector workers had staged strikes. Inflation was about 10% and some 1.5 million people were unemployed, compared to some 1 million in 1974, 580,000 in 1970 and just over 300,000 in 1964.[15] Thatcher set about controlling inflation with monetarist policies and changing trade union legislation in an attempt to reduce the strikes of public-sector workers.[16]
Thatcher's battle against inflation raised the exchange rate, resulting in the closure of many factories, shipyards and coal pits because imports were cheaper and the strong pound made British products more expensive in export markets. Inflation fell below 10% by the turn of 1982, having peaked at 22% in 1980, and by spring 1983, it had fallen to a 15-year low of 4%. Strikes were also at their lowest level since the early 1950s, and wage growth rose to 3.8% by 1983.[17]
However, unemployment reached 12.5% of the workforce by January 1982, a level that had not been seen for some 50 years. The unemployment rate remained similarly high for a number of years afterwards. Northern Ireland was the hardest-hit region, with unemployment standing at nearly 20%. The rate exceeded 15% in much of Scotland and Northern England. By April 1983, Britain became a net importer of goods for the first time in modern times.[dubious ][18] Areas of Tyneside, Yorkshire, Merseyside, South Wales, Western Scotland and the West Midlands were hit hard by the loss of industry and subsequent sharp rise in unemployment. Only in Southeast England did unemployment remain below 10%.[19]
Despite the economic recovery that followed the early 1980s recession, unemployment in the United Kingdom barely fell until the second half of the decade. As late as 1986, unemployment exceeded 3 million,[20] but it fell below that figure the following year.[21] By the end of 1989, it had fallen to 1.6 million.[22]
Social impact
The mass unemployment and social discontent resulting from the recession were widely seen as major factors in widespread rioting across Britain in 1981 in parts of towns and cities including Toxteth, Liverpool, as well as a number of districts of London.[23] In 1985, the economy had been out of recession for three years, but unemployment remained stubbornly high. Another wave of rioting occurred across numerous areas of Britain, including several areas across London. Poor employment opportunities, and social discontent were once again seen as factors in the rioting.[24]
Recovery
In the UK, economic growth was re-established by the end of 1982, but the era of mass unemployment was far from over. By the summer of 1984, unemployment had hit a new record of 3.3 million although the Great Depression had seen a higher percentage of the workforce unemployed. It remained above the 3 million mark until the spring of 1987, when the Lawson Boom, seen as the consequence of tax cuts by Chancellor Nigel Lawson, sparked an economic boom that saw unemployment fall dramatically. By early 1988, it was below 2.5 million; by early 1989, it fell below 2 million. By the end of 1989, it was just over 1.6 million, almost half the figure of three years earlier.[25] However, the unemployment figures did not include benefit claimants who were placed on Employment Training schemes, an adult variant of the controversial Youth Training Scheme, who were paid the same rate of benefit for working full-time hours. Other incentives that aided the British economic recovery after the early 1980s recession included the introduction of enterprise zones on deindustrialised land in which traditional industries were replaced by new industries as well as commercial developments. Businesses were given temporary tax breaks, and exemptions as incentives to set up base in such areas.[26]
United States

US GDP growth in the early 1980s. The short recession at the start of the decade and the following brief period of growth as well as the deeper recession in 1981 and 1982 have led to the period being characterized as a W-shaped recession.
Percent Change From Preceding Period in Real Gross Domestic Product (annualized; seasonally adjusted); Average GDP growth 1947–2009
Source: Bureau of Economic Analysis
Like Canada, the early 1980s recession in the United States technically consisted of two separate downturns, one commencing in January 1980 which yielded to modest growth in July 1980 with a deeper downturn from July 1981 to November 1982.[27][28][29][30] One cause was the Federal Reserve's contractionary monetary policy, which sought to rein in the high inflation.[31] In the wake of the 1973 oil crisis and the 1979 energy crisis, stagflation began to afflict the economy.
Unemployment

Unemployment had risen from 5.1% in January 1974 to a high of 9.0% in May 1975. Although it had gradually declined to 5.6% by May 1979, unemployment began rising again. It jumped sharply to 6.9% in April 1980 and to 7.5% in May 1980. A mild recession from January to July 1980 kept unemployment high, but despite economic recovery, it remained at historically high levels (about 7.5%) until the end of 1981.[32] In mid-1982, Rockford, Illinois, had the highest unemployment of all metro areas, at 25%.[33] In September 1982, Michigan led the nation with 14.5%, Alabama was second with 14.3%, and West Virginia was third with 14.0%. The Youngstown–Warren Metropolitan Area had an 18.7% rate, the highest of all metro areas, and Stamford, Connecticut, had the lowest unemployment, at 3.5%.[34]
The peak of the recession occurred in November and December 1982, when the nationwide unemployment rate was 10.8%, the highest since the Great Depression. In November, West Virginia and Michigan had the highest unemployment with 16.4%, Alabama was in third with 15.3%. South Dakota had the lowest unemployment rate in the nation, with 5.6%. Flint, Michigan, had the highest unemployment rate of all metro areas, with 23.4%.[35] In March 1983, West Virginia's unemployment rate hit 20.1%. In spring 1983, thirty states had double-digit unemployment. When Reagan was re-elected in 1984, the latest unemployment numbers (August 1984) showed that West Virginia still had the highest rate in the nation (13.6%) followed by Mississippi (11.1%) and Alabama (10.9%).[36]
Inflation
Inflation, which had averaged 3.2% annually since World War II had more than doubled after the 1973 oil shock, to a 7.7% annual rate. Inflation reached 9.1% in 1975, the highest rate since 1947. Inflation declined to 5.8% the following year but then edged higher. By 1979, inflation reached a startling 11.3% and in 1980, it soared to 13.5%.[28][37]
A brief recession occurred in 1980. Several key industries, including housing, steel manufacturing, and automobiles, experienced a downturn from which they did not recover until the end of the next recession. Many of the economic sectors that supplied the basic industries were also hit hard.[38]
Each period of high unemployment saw the Federal Reserve increase interest rates to reduce high inflation. Each time, once inflation fell and interest rates were lowered, unemployment slowly fell.[39]
Determined to wring inflation out of the economy, Federal Reserve chairman Paul Volcker slowed the rate of growth of the money supply and raised interest rates. The federal funds rate, which was about 11% in 1979, rose to 20% by June 1981. The prime interest rate, an important economic measure, eventually reached 21.5% in June 1982.[30][40]
Banks
The recession came at a bad time for banks because of a recent wave of deregulation. The Depository Institutions Deregulation and Monetary Control Act of 1980 had phased out a number of restrictions on their financial practices, broadened their lending powers, and raised the deposit insurance limit from $40,000 to $100,000, which caused moral hazard.[41] Banks rushed into real estate lending, speculative lending, and other ventures as the economy soured.

By mid-1982, the number of bank failures was rising steadily. Bank failures reached 42, the highest since the depression, as both the recession and high interest rates took their toll.[42] By the end of the year, the Federal Deposit Insurance Corporation (FDIC) had spent $870 million to purchase bad loans in an effort to keep various banks afloat.[43]
In July 1982, the US Congress enacted the Garn–St. Germain Depository Institutions Act of 1982, which further deregulated banks, savings and loans. The Act authorized banks to begin offering money market accounts in an attempt to encourage deposit in-flows, and it also removed additional statutory restrictions in real estate lending and relaxed loans-to-one-borrower limits. That encouraged a rapid expansion in real estate lending while the real estate market was collapsing, increased the unhealthy competition between banks, savings and loans, and encouraged too many branches to be started.[41]
In 1983, another 50 banks failed. The FDIC listed another 540 banks as "problem banks", on the verge of failure.[43]
In 1984, the Continental Illinois National Bank and Trust Company, the nation's seventh-largest bank (with $45 billion in assets), failed. The bank had first approached failure in July 1982, when the Penn Square Bank, which had partnered with Continental Illinois in a number of high-risk lending ventures, collapsed. However, federal regulators were reassured by Continental Illinois executives that steps were being taken to ensure the bank's financial security. After its collapse, federal regulators were willing to let the bank fail to reduce moral hazard and so other banks would rein in some of their more risky lending practices. Members of Congress and the press, however, felt that Continental Illinois was "too big to fail". In May 1984, federal banking regulators finally offered a $4.5 billion rescue package to Continental Illinois.[41]
The American banking system had been significantly weakened by the severe recession and the effects of deregulation. Had other banks been forced to write off loans to Continental Illinois, institutions like Manufacturer's Hanover Trust Company, Bank of America, and perhaps Citicorp would have become insolvent.[44]
Saving and loan crisis
The recession also significantly exacerbated the savings and loan crisis. In 1980, there were approximately 4590 state and federally chartered savings and loan institutions (S&Ls), with total assets of $616 billion. From 1979, they began losing money because of spiraling interest rates. Net S&L income, which had totaled $781 million in 1980, fell to a loss of $4.6 billion in 1981 and a loss of $4.1 billion in 1982. The tangible net worth for the entire S&L industry was virtually zero.[41]
The Federal Home Loan Bank Board (FHLBB) regulated and inspected S&Ls and administered the Federal Savings and Loan Insurance Corporation (FSLIC), which insured deposits at S&Ls. The FHLBB's enforcement practices were significantly weaker than those of other federal banking agencies. Until the 1980s, savings and loans had limited lending powers and so the FHLBB was a relatively small agency, overseeing a quiet, stable industry. Also, the FHLBB was unable to add to its staff because of stringent limits on the number of personnel that it could hire and the level of compensation it could offer. The limitations were placed on the agency by the Office of Management and Budget and were routinely subject to the political whims of that agency and political appointees in the Executive Office of the President. In financial circles, the FHLBB and FSLIC were called "the doormats of financial regulation".[45]
The FHLBB relied heavily on its persuasive powers and the US states to enforce banking regulations.
One consequence of the FHLBB's lack of enforcement abilities was the promotion of deregulation and of aggressive, expanded lending to forestall insolvency. In November 1980, the FHLBB lowered net worth requirements for federally insured S&Ls from 5% of deposits to 4%. The FHLBB lowered net worth requirements again to 3% in January 1982. Additionally, the agency required S&Ls to meet those requirements only over 20 years. The rule meant that S&Ls less than 20 years old had practically no capital reserve requirements. That encouraged extensive chartering of new S&Ls since a $2 million investment could be leveraged into $1.3 billion in lending.[41][45]

Congressional deregulation exacerbated the S&L crisis. The Economic Recovery Tax Act of 1981 led to a boom in commercial real estate. The passage of the Depository Institutions Deregulation and Monetary Control Act and the Garn–St. Germain Act expanded the authority of federally chartered S&Ls to make acquisition, development, and construction real estate loans, and the statutory limit on loan-to-value ratios was eliminated. The changes allowed S&Ls to make high-risk loans to developers. Beginning in 1982, many S&Ls rapidly shifted away from traditional home mortgage financing and into new, high-risk investment activities like casinos, fast-food franchises, ski resorts, junk bonds, arbitrage schemes, and derivative instruments.[41]
Federal deregulation also encouraged state legislatures to deregulate state-chartered S&Ls. Unfortunately, many of the states that deregulated S&Ls were also soft on supervision and enforcement. In some cases, state-chartered S&Ls had close political ties to elected officials and state regulators, which further weakened oversight.[41][46][47][48]
As the risk exposure of S&Ls expanded, the economy slid into the recession. Soon, hundreds of S&Ls were insolvent. Between 1980 and 1983, 118 S&Ls with $43 billion in assets failed. The Federal Savings and Loan Insurance Corporation, the federal agency which insured the deposits of S&Ls, spent $3.5 billion to make depositors whole again (in comparison, only 143 S&Ls with $4.5 billion in assets had failed in the previous 45 years, costing the FSLIC $306 million).[41] The FSLIC pushed mergers as a way to avoid insolvency. From 1980 to 1982, there were 493 voluntary mergers and 259 forced mergers of savings and loans overseen by the agency. Despite the failures and mergers, there were still 415 S&Ls at the end of 1982 that were insolvent.[45][47][48][49]
Federal action initially caused the problem by allowing institutions to get involved in creating wealth by unhealthy fractional reserve practices, lending out much more money than they could ever afford to pay back out to customers if they came to withdraw their money. That ultimately led to S&Ls' failure. Later, the government's inaction worsened the industry's problems.
Responsibility for handling the S&L crisis lay with the Cabinet Council on Economic Affairs (CCEA), an intergovernmental council located within the Executive Office of the President. At the time, the CCEA was chaired by Treasury Secretary Donald Regan. The CCEA pushed the FHLBB to refrain from re-regulating the S&L industry and adamantly opposed any governmental expenditures to resolve the S&L problem. Furthermore, the Reagan administration did not want to alarm the public by closing a large number of S&Ls. Such actions significantly worsened the S&L crisis.[41]
The S&L crisis lasted well beyond the end of the economic downturn. The crisis was finally quelled by passage of the Financial Institutions Reform, Recovery and Enforcement Act of 1989. The estimated total cost of resolving the S&L crisis was more than $160 billion.[50]
Political fallout

The recession was nearly a year old before President Ronald Reagan stated on October 18, 1981, that the economy was in a "slight recession".[51]
The recession [52][53][54] coupled with budget cuts, which were enacted in 1981 but began to take effect only in 1982, led many voters to believe that Reagan was insensitive to the needs of average citizens and favored the wealthy.[55][56][57]
Pressured to counteract the increased deficit caused by the recession, Reagan agreed to a corporate tax increase in 1982. However, he refused to raise income tax or to cut defense spending. The Tax Equity and Fiscal Responsibility Act of 1982 instituted a three-year, $100 billion tax hike, the largest tax increase since the Second World War.[58]
Recovery

According to Keynesian economists, a combination of deficit spending and the lowering of interest rates would slowly lead to economic recovery.[59] Many economists also insist that the significantly-lower tax rates significantly contributed to the recovery. From a high of 10.8% in December 1982, unemployment gradually improved until it fell to 7.2% on Election Day in 1984.[32] Nearly two million people left the unemployment rolls.[60] Inflation fell from 10.3% in 1981 to 3.2% in 1983.[28][61] Corporate income rose by 29% in the July–September quarter of 1983, compared with the same period in 1982. Some of the most dramatic improvements came in industries that were the hardest hit by the recession, such as paper and forest products, rubber, airlines, and the auto industry.[60]
See also
References
- ^ a b "The Great Inflation". Retrieved 7 January 2024.
- ^ "The Great Inflation". San Jose State University. Retrieved 7 January 2024.
- ^ a b c d e f g h Kose, M. Ayhan; Sugawara, Naotaka; Terrones, Marco E. (2020-02-10), "Global Recessions" (PDF), Policy Research Working Paper, World Bank
- ^ a b Moy, Joyanna (1985). "Recent Trends in Unemployment and the Labor Force: 10 Countries" (PDF). Monthly Labor Review. 108 (8): 9–22. Retrieved 13 April 2011.
- ^ Rubin, Jeff; Buchanan, Peter (October 31, 2008), "What's the Real Cause of the Global Recession?" (PDF), StrategEcon, CIBC World Markets Inc., retrieved February 20, 2020
- ^ a b Boskin, Michael (2011). "Double Dips...or More". Hoover Digest: Research and Opinion on Public Policy (1).
- ^ a b "Canada GDP Growth Rate 1961-2020".
- ^ Bonham, Mark S. "Recession in Canada". The Canadian Encyclopedia.
- ^ a b c d Cross, Philip, and Bergevin, Philippe "Turning Points: Business Cycles in Canada Since 1926" (PDF), C.D. Howe Institute
- ^ a b c d Horstmann, Ig (May 1, 2009). "The Worst Economic Times Since the Great Depression? A Reality Check". Rotman Institute for International Business Blog.
- ^ a b c "Canada-Economy". National Encyclopedia.
- ^ a b c d "New Economic Realities". CBC.
- ^ a b c "Report for Selected Countries and Subjects".
- ^ a b Kneeboen, Ronald, and Gres, Margarita "Trends, Peaks, and Troughs: National and Regional Employment Cycles in Canada" (PDF). The School of Policy Research Research Papers. 6 (21). University of Calgary. July 2013.
- ^ "Unemployment". Politics.co.uk. August 27, 2004. Archived from the original on June 9, 2011. Retrieved November 2, 2010.
- ^ "Thatcher's Economic Policies". Economics Help.
- ^ "How UK incomes have risen (and fallen) since 1948". Telegraph. 2011-03-30. Retrieved 2016-10-06.
- ^ Michael Kitson and Jonathan Michie (June 2014). "THE DEINDUSTRIAL REVOLUTION: THE RISE AND FALL OF UK MANUFACTURING, 1870-2010" (PDF). University of Cambridge. Archived from the original (PDF) on 2019-12-24. Retrieved 2018-08-30.
- ^ "1982: UK unemployment tops three million". BBC News. January 26, 1982.
- ^ Seager, Ashley (August 16, 2006). "20 Years Ago The Dole Queue Hit 3 Million - Today It Is The Workforce That's A Record". The Guardian. London.
- ^ "1987: Thatcher's third victory". BBC News. April 5, 2005.
- ^ "Economics Essays: Unemployment in the UK 2012". Econ.economicshelp.org. 2012-10-16. Retrieved 2016-10-06.
- ^ "Thatcher 'considered arming police' during 1981 riots". BBC News. December 30, 2011.
- ^ "Was Tottenham's riot a cry of rage?". BBC News. August 7, 2011.
- ^ "Lawson Boom of Late 1980s", Economics Help, January 2008.
- ^ "Brierley Hill Area Action Plan Preferred Options Baseline Report - Retail". Archived from the original on 2011-01-13. Retrieved 2010-09-03.
- ^ "1980-82 Early 1980s Recession - Timeline - Slaying the Dragon of Debt - Regional Oral History Office - University of California, Berkeley".
- ^ a b c Paul Krugman, "Did the Federal Reserve Cause the Recession?", The New York Times, April 1, 1991;[verification needed]
- ^ National Bureau of Economic Research, "US Business Cycle Expansions and Contractions" Archived March 10, 2009, at the Wayback Machine, Cambridge, Mass., no date.
- ^ a b Rattner, Steven (5 January 1981). "Federal Reserve Sees Little Growth in '81 With Continued High Rates". The New York Times.
- ^ Congressional Budget Office, "The Prospects for Economic Recovery", February 1982. "The downturn was precipitated by a rise in interest rates to levels that exceeded the record rates recorded a year earlier" (p. xi).
- ^ a b Table 34, U.S. Federal Reserve Board, Monetary Policy Report to the Congress, February 14, 2007.
- ^ Ptashkin, Samantha, "Rockford Unemployment: better off now or in the 1980s?" Archived 2011-07-18 at the Wayback Machine
- ^ "Michigan again sets the pace in unemployment". Lawrence Journal World. 17 Nov 1982. Retrieved 2016-10-06.
- ^ "State's jobless rate trails only Michigan, West Virginia". The Gadsden Times. 19 Jan 1983. Retrieved 2016-10-06.
- ^ "W.Va. ranked No. 2 in latest jobless figures". Williamson Daily News. 17 Oct 1984. Retrieved 2016-10-06.
- ^ "Consumer Price Index for All Urban Consumers (CPI-U): U. S. city average, by expenditure category, August 2014". Bureau of Labor Statistics. 17 September 2014. Retrieved 9 October 2014.
- ^ Michael A. Urquhart, and Marillyn A. Hewson, "Unemployment Continued to Rise in 1982 as Recession Deepened", Monthly Labor Report, 106:2 (February 1983)
- ^ "Federal Funds Rate, Inflation, Unemployment: 1970–1990", Federal Reserve Bank of St. Louis
- ^ Cowan, Edward (5 May 1981). "Bank Lending Rate Set at Record 14% By Federal Reserve". The New York Times.
- ^ a b c d e f g h i Federal Deposit Insurance Corporation, History of the Eighties: Lessons for the Future, Vol. 1. Division of Research and Statistics, December 1997.
- ^ James L. Rowe, Jr., "Regulators See Bank Failures Rising Steadily", The Washington Post, 20 October 1982.
- ^ a b Taylor, Alexander L. (29 August 1983). "Why So Many Banks Go Belly Up". Time. Archived from the original on December 22, 2008.
- ^ Robert A. Eisenbeis; Paul M. Horvitz (1994). "The Role of Forbearance and Its Costs in Handling Troubled and Failed Depository Institutions". In Kaufman, George G. (ed.). Reforming Financial Institutions and Markets in the United States. New York: Springer-Verlag. pp. 49–68. doi:10.1007/978-94-011-1404-2_4. ISBN 978-94-010-4616-9.
- ^ a b c Adams, James Ring (1990). The Big Fix: Inside the S&L Scandal. John Wiley & Sons. p. 40. ISBN 978-0471515357.
- ^ White, Lawrence J. (1992). The S&L Debacle: Public Policy Lessons for Bank and Thrift Regulation. New York: Oxford University Press. ISBN 978-0195074840.
- ^ a b Norman Strunk and Fred Case, Where Deregulation Went Wrong: A Look at the Causes behind Savings and Loan Failures in the 1980s. Washington, D.C.: Savings & Community Bankers of America, 1988. ISBN 0-929097-32-7.
- ^ a b National Commission on Financial Institution Reform, Recovery and Enforcement, "Origin and Causes of the S&L Debacle: A Blueprint for Reform: A Report to the President and Congress of the United States", Washington, D.C.: U.S. Government Printing Office, 1993.
- ^ Lowy, Martin E. (1990). High Rollers: Inside the Savings and Loan Debacle. Praeger. ISBN 978-0275939885.
- ^ U.S. General Accounting Office, Financial Audit: Resolution Trust Corporation's 1995 and 1994 Financial Statements. Washington, D.C.: U.S. Government Printing Office, 1996.
- ^ Fuerbringer, Jonathan (20 October 1981). "Reagan's 'Slight Recession'". The New York Times.
- ^ Meyer, David S. (1990). A Winter of Discontent: The Nuclear Freeze and American Politics. Praeger. p. 59. ISBN 978-0275933050.
- ^ Gilens, Martin (1999). Why Americans Hate Welfare: Race, Media, and the Politics of Antipoverty Policy. Chicago, IL: University of Chicago Press. p. 125. ISBN 978-0226293646.
- ^ Turgeon, Lynn (1996). Bastard Keynesianism: The Evolution of Economic Thinking and Policy-Making Since World War II. Praeger. p. 135. ISBN 978-0313300240.
- ^ Troy, Gil (2005). Morning in America: How Ronald Reagan Invented the 1980s. Princeton University Press. p. 40. ISBN 978-0691096452.
- ^ Gilens, 2000, p. 125ff.
- ^ Heider, Don (2004). Class and News. Lanham, MD: Rowman & Littlefield. p. 50ff. ISBN 9780742527133.
- ^ Green, Joshua. "Reagan's Liberal Legacy." Washington Monthly", January/February 2003.
- ^ Judis, John B. (2009-11-25). "The Case for Deficit Spending | New Republic". The New Republic. Retrieved 2016-10-06.
- ^ a b Alexander, Charles P. (November 28, 1983). "A Lusty, Lopsided Recovery". Time. Archived from the original on December 22, 2008.
- ^ Friedman, Thomas L. (September 17, 1981). "Fed's Policy of Tight Money". The New York Times.
Sources
- Brunner, Karl. "The Recession of 1981/1982 in the Context of Postwar Recessions." Policy Statement and Position Papers. Rochester, N.Y.: Bradley Policy Research Center, William E. Simon Graduate School of Business Administration, University of Rochester. March 1983.
- Day, Kathleen. S&L Hell: How Politics Created a Trillion Dollar Debacle. New York: W.W. Norton and Co., 1993. ISBN 0-393-02982-4
- Guell, Robert C., Issues in Economics Today. New York: McGraw Hill Professional, 2004. ISBN 0-07-287187-3
- Meltzer, Allan H. (2009). A History of the Federal Reserve – Volume 2, Book 2: 1970–1986. Chicago: University of Chicago Press. pp. 1043–1131. ISBN 978-0226213514.
- Silber, William L. (2012). Volcker: The Triumph of Persistence. New York: Bloomsbury Press. pp. 187–237. ISBN 978-1608190706.
- U.S. Federal Reserve Board. Monetary Policy Report to the Congress. Washington, D.C.: U.S. Government Printing Office, February 14, 2007. Accessed May 5, 2007.