
Dukes County | |
|---|---|
| County of Dukes County | |
 County Administration Building at the Martha's Vineyard Airport | |
 Seal | |
 Location within the U.S. state of Massachusetts | |
 Massachusetts's location within the U.S. | |
| Coordinates: 41°24′53″N 70°36′46″W / 41.414841°N 70.612679°W | |
| Country | |
| State | |
| Founded | 1695 |
| Named for | James, Duke of York |
| Seat | Edgartown |
| Largest town | Oak Bluffs |
| Area | |
| • Total | 491 sq mi (1,270 km2) |
| • Land | 103 sq mi (270 km2) |
| • Water | 388 sq mi (1,000 km2) 79% |
| Population (2020) | |
| • Total | 20,600 |
| • Density | 199.6/sq mi (77.1/km2) |
| Time zone | UTC−5 (Eastern) |
| • Summer (DST) | UTC−4 (EDT) |
| Congressional district | 9th |
| Website | www |
Dukes County is a county located in the U.S. state of Massachusetts. As of the 2020 census, the population was 20,600,[1] making it the second-least populous county in Massachusetts. Its county seat is Edgartown.[2]
Dukes County comprises the Vineyard Haven, MA Micropolitan Statistical Area. The county consists of 32 named islands,[3] the largest of which is Martha's Vineyard. It also includes Chappaquiddick Island (sometimes peninsula of the Vineyard), the Elizabeth Islands, including Cuttyhunk, and Nomans Land.
YouTube Encyclopedic
-
1/4Views:10 27337 6351 5282 412
-
Tour Martha's Vineyard Oak Bluffs, Massachusetts
-
Tour Martha's Vineyard Edgartown, Massachusetts
-
Driving To Menemsha From Vineyard Haven, Massachusetts
-
Tour Vineyard Haven Martha's Vineyard, Massachusetts
Transcription
History

The original inhabitants of the islands were Wampanoag, who had several villages. Political jurisdiction over the lands were granted by the English monarchy in overlapping claims to two different British nobles, from which Massachusetts Bay Company settler Thomas Mayhew purchased them in 1641. Mayhew established a colony in his new domain, carefully purchasing land ownership rights from the native inhabitants, and maintaining native governments to continue unimpeded. In 1665, Mayhew's lands were included in a grant to James, Duke of York (later King James II). In 1671, a settlement was arranged, allowing Mayhew to continue to rule while placing his territory under the jurisdiction of the Province of New York.
Dukes County was thus established as Dukes County, New York, on November 1, 1683, and included all of Mayhew's lands – Martha's Vineyard, Nantucket, and the Elizabeth Islands. The county was transferred to Massachusetts on October 7, 1691, and at the same time Nantucket Island was split into the separate Nantucket County, Massachusetts. The 1695 incorporation statute created a county "by the name of Dukes County," as opposed to the standard form "the county of Dukes" which is the reason for the redundancy in the formal name, "County of Dukes County".[4]
Geography
According to the U.S. Census Bureau, the county has a total area of 491 square miles (1,270 km2), of which 103 square miles (270 km2) is land and 388 square miles (1,000 km2) (79%) is water.[5] It is the third-smallest county by land area in Massachusetts.
Named Islands
- Martha's Vineyard
- Chappaquiddick Island, Edgartown
- Skiff’s Island, south of Chappaquiddick[6]
- Ferry Boat Island, Tisbury
- Wood Island, Oak Bluffs
- Brush Island, Oak Bluffs
- Gravel Island, Oak Bluffs
- Sarson Island, Oak Bluffs
- Haystack Island, Oak Bluffs
- Edy’s Island, Chilmark
- Mayhew Island, Chilmark
- Beach Grass Island, Chilmark
- Strawberry Island, Chilmark
- Gull Island, Chilmark
- Great Island, Chilmark
- Nomans Land, Chilmark
- Elizabeth Islands, Gosnold
- Naushon Island
- Nashawena Island
- Pasque Island
- Cuttyhunk Island
- Penikese Island
- Gull Island
- Barlet Island
- Rock Island
- Uncatena Island
- Nonamesset Island
- Veckatimest Island
- Monohansett Island
- Cedar Island
- Bull Island
- Pine Island
- Weepecket Islands
Nearby counties
- Barnstable County, Massachusetts – northeast
- Plymouth County, Massachusetts – north
- Bristol County, Massachusetts – northwest
- Nantucket County, Massachusetts – east
National protected area
Demographics
| Census | Pop. | Note | %± |
|---|---|---|---|
| 1790 | 3,255 | — | |
| 1800 | 3,118 | −4.2% | |
| 1810 | 3,290 | 5.5% | |
| 1820 | 3,292 | 0.1% | |
| 1830 | 3,517 | 6.8% | |
| 1840 | 3,958 | 12.5% | |
| 1850 | 4,540 | 14.7% | |
| 1860 | 4,403 | −3.0% | |
| 1870 | 3,787 | −14.0% | |
| 1880 | 4,300 | 13.5% | |
| 1890 | 4,369 | 1.6% | |
| 1900 | 4,561 | 4.4% | |
| 1910 | 4,504 | −1.2% | |
| 1920 | 4,372 | −2.9% | |
| 1930 | 4,953 | 13.3% | |
| 1940 | 5,669 | 14.5% | |
| 1950 | 5,633 | −0.6% | |
| 1960 | 5,829 | 3.5% | |
| 1970 | 6,117 | 4.9% | |
| 1980 | 8,942 | 46.2% | |
| 1990 | 11,639 | 30.2% | |
| 2000 | 14,987 | 28.8% | |
| 2010 | 16,535 | 10.3% | |
| 2020 | 20,600 | 24.6% | |
| 2023 (est.) | 20,819 | [7] | 1.1% |
| U.S. Decennial Census[8] 1790–1960[9] 1900–1990[10] 1990–2000[11] 2010[12] 2020[13] | |||
2020 census
| Race / Ethnicity | Pop 2010[12] | Pop 2020[13] | % 2010 | % 2020 |
|---|---|---|---|---|
| White alone (NH) | 14,275 | 16,230 | 86.33% | 78.79% |
| Black or African American alone (NH) | 477 | 795 | 2.88% | 3.86% |
| Native American or Alaska Native alone (NH) | 175 | 202 | 1.06% | 0.98% |
| Asian alone (NH) | 123 | 184 | 0.74% | 0.89% |
| Pacific Islander alone (NH) | 4 | 9 | 0.02% | 0.04% |
| Some Other Race alone (NH) | 571 | 701 | 3.45% | 3.40% |
| Mixed Race/Multi-Racial (NH) | 526 | 1,945 | 3.18% | 9.44% |
| Hispanic or Latino (any race) | 384 | 534 | 2.32% | 2.59% |
| Total | 16,535 | 20,600 | 100.00% | 100.00% |
Note: the US Census treats Hispanic/Latino as an ethnic category. This table excludes Latinos from the racial categories and assigns them to a separate category. Hispanics/Latinos can be of any race.
2010 census
At the 2010 census, there were 16,535 people, 7,368 households, and 4,221 families living in the county.[14] The population density was 160.2 inhabitants per square mile (61.9/km2). There were 17,188 housing units at an average density of 166.5 per square mile (64.3/km2).[15] The racial makeup of the county was 87.6% white, 3.1% black or African American, 1.1% American Indian, 0.8% Asian, 0.1% Pacific islander, 3.9% from other races, and 3.4% from two or more races. Those of Hispanic or Latino origin made up 2.3% of the population.[14]
The largest ancestry groups were:[16]
- 18.5% Irish
- 17.1% English
- 11.7% Portuguese
- 10.0% American
- 9.2% German
- 7.6% Italian
- 5.5% French
- 2.9% West Indian
- 2.9% Scottish
- 2.5% Dutch
- 2.3% Scotch-Irish
- 2.1% Swedish
- 2.1% Polish
- 1.9% French Canadian
- 1.4% Russian
- 1.1% Arab
- 1.0% Sub-Saharan African
Of the 7,368 households, 25.9% had children under the age of 18 living with them, 44.1% were married couples living together, 8.9% had a female householder with no husband present, 42.7% were non-families, and 33.4% of households were made up of individuals. The average household size was 2.22 and the average family size was 2.81. The median age was 45.3 years.[14]
The median household income was $62,407 and the median family income was $77,231. Males had a median income of $43,850 versus $41,994 for females. The per capita income for the county was $33,390. About 5.5% of families and 8.6% of the population were below the poverty line, including 4.3% of those under age 18 and 7.2% of those age 65 or over.[17]
2000 census
At the 2000 census there were 14,987 people, 6,421 households, and 3,788 families living in the county. The population density was 144 inhabitants per square mile (56/km2). There were 14,836 housing units at an average density of 143 per square mile (55/km2). The racial makeup of the county was 90.69% White, 2.40% Black or African American, 1.71% Native American, 0.46% Asian, 0.07% Pacific Islander, 1.48% from other races, and 3.19% from two or more races. 1.03% of the population were Hispanic or Latino of any race. 20.4% were of English, 13.3% Irish, 8.6% Portuguese, 6.4% Italian and 5.7% American ancestry, 93.1% spoke English, 3.7% Portuguese and 1.7% Spanish as their first language and 0.285% speak Irish at home.[18] Of the 6,421 households 28.40% had children under the age of 18 living with them, 45.40% were married couples living together, 9.80% had a female householder with no husband present, and 41.00% were non-families. 32.00% of households were one person and 11.10% were one person aged 65 or older. The average household size was 2.30 and the average family size was 2.91.
The age distribution was 22.70% under the age of 18, 5.50% from 18 to 24, 29.60% from 25 to 44, 27.80% from 45 to 64, and 14.40% 65 or older. The median age was 41 years. For every 100 females, there were 95.60 males. For every 100 females age 18 and over, there were 92.10 males.
The median household income was $45,559 and the median family income was $55,018. Males had a median income of $38,945 versus $30,346 for females. The per capita income for the county was $26,472. About 5.00% of families and 7.30% of the population were below the poverty line, including 10.40% of those under age 18 and 5.30% of those age 65 or over.
Real estate
As of the fourth quarter 2021, the median value of homes in Dukes County was $883,820, an increase of 22.3% from the prior year.[19]
Demographic breakdown by town
Income
The ranking of unincorporated communities that are included on the list are reflective if the census designated locations and villages were included as cities or towns. Data is from the 2007–2011 American Community Survey 5-Year Estimates.[20][21][22]
| Rank | Town | Per capita income |
Median household income |
Median family income |
Population | Number of households | |
|---|---|---|---|---|---|---|---|
| 1 | Chilmark | Town | $45,210 | $59,583 | $79,688 | 801 | 302 |
| 2 | Edgartown | Town | $38,083 | $74,214 | $82,583 | 4,034 | 1,466 |
| 3 | West Tisbury | Town | $36,592 | $75,759 | $87,566 | 2,506 | 926 |
| Massachusetts | State | $35,051 | $65,981 | $83,371 | 6,512,227 | 2,522,409 | |
| Dukes County | County | $33,228 | $69,760 | $82,659 | 16,353 | 5,568 | |
| Vineyard Haven | CDP | $30,298 | $77,935 | $92,112 | 2,465 | 652 | |
| 4 | Gosnold | Town | $29,511 | $52,813 | $61,250 | 183 | 63 |
| 5 | Tisbury | Town | $29,384 | $54,762 | $60,521 | 3,914 | 1,290 |
| 6 | Oak Bluffs | Town | $29,117 | $78,890 | $84,846 | 4,449 | 1,429 |
| United States | Country | $27,915 | $52,762 | $64,293 | 306,603,772 | 114,761,359 | |
| 7 | Aquinnah | Town | $25,512 | $82,500 | $106,250 | 466 | 92 |
Religion
| Year | 1980 | 1990 | 2000 | 2010 | ||||
|---|---|---|---|---|---|---|---|---|
| Religion | Congregations | Adherents | Congregations | Adherents | Congregations | Adherents | Congregations | Adherents |
| Catholic Church | 3 | 2,000 | 3 | 5,000 | 3 | 9,951 | 3 | 12,896 |
| Episcopal Church | 2 | 871 | 3 | 562 | 3 | 608 | 3 | 473 |
| United Methodist | 6 | 620 | 6 | 587 | 5 | 524 | 2 | 176 |
| American Baptist | 3 | 279 | 3 | 403 | 3 | 461 | 4 | 456 |
| Regular Baptist | 0 | n/a | 1 | 62 | 1 | 83 | 1 | 90 |
| United Church of Christ | 1 | 110 | 1 | 166 | 1 | 217 | 1 | 165 |
| Unitarian-Universalist | 1 | 83 | 1 | 83 | 1 | 83 | 1 | 74 |
| Assemblies of God | 1 | 5 | 1 | 69 | 2 | 174 | 1 | 160 |
| Friends (Quakers) | 1 | n/a | 1 | 22 | 1 | 52 | 1 | 9 |
| Church of Christ, Scientist | n/a | n/a | 1 | n/a | 1 | n/a | 1 | n/a |
| Congregational | n/a | n/a | 1 | 300 | 1 | 295 | 1 | 331 |
| Jehovah's Witnesses | n/a | n/a | n/a | n/a | n/a | n/a | 1 | n/a |
| Evangelical Christian | 0 | n/a | 0 | n/a | 0 | n/a | 1 | 60 |
| Mormon | n/a | n/a | 1 | 27 | 1 | 49 | 1 | 84 |
| Buddhist | 0 | n/a | 0 | n/a | 0 | n/a | 1 | 72 |
| Jewish | 1 | 138 | 1 | 260 | 1 | 300 | 1 | 923 |
| Ba'hai | 0 | 0 | 0 | 0 | 0 | 5 | 0 | 4 |
| Unaffiliated | 0 | n/a | 0 | n/a | 0 | n/a | 0 | 10,562 |
Politics
| Year | Republican | Democratic | Third party | |||
|---|---|---|---|---|---|---|
| No. | % | No. | % | No. | % | |
| 2020 | 2,631 | 20.56% | 9,914 | 77.47% | 253 | 1.98% |
| 2016 | 2,477 | 21.22% | 8,400 | 71.95% | 797 | 6.83% |
| 2012 | 2,792 | 25.46% | 7,978 | 72.74% | 198 | 1.81% |
| 2008 | 2,442 | 23.14% | 7,913 | 74.98% | 198 | 1.88% |
| 2004 | 2,602 | 26.03% | 7,265 | 72.67% | 130 | 1.30% |
| 2000 | 2,315 | 26.14% | 5,474 | 61.81% | 1,067 | 12.05% |
| 1996 | 1,739 | 22.58% | 5,137 | 66.70% | 826 | 10.72% |
| 1992 | 1,827 | 23.16% | 4,292 | 54.41% | 1,769 | 22.43% |
| 1988 | 2,441 | 34.75% | 4,495 | 63.99% | 89 | 1.27% |
| 1984 | 2,788 | 45.52% | 3,313 | 54.09% | 24 | 0.39% |
| 1980 | 1,809 | 33.52% | 2,370 | 43.91% | 1,218 | 22.57% |
| 1976 | 2,365 | 46.06% | 2,513 | 48.94% | 257 | 5.00% |
| 1972 | 2,312 | 53.32% | 2,001 | 46.15% | 23 | 0.53% |
| 1968 | 1,576 | 49.31% | 1,540 | 48.19% | 80 | 2.50% |
| 1964 | 1,015 | 31.58% | 2,187 | 68.05% | 12 | 0.37% |
| 1960 | 1,998 | 60.80% | 1,282 | 39.01% | 6 | 0.18% |
| 1956 | 2,618 | 82.85% | 541 | 17.12% | 1 | 0.03% |
| 1952 | 2,432 | 76.05% | 760 | 23.76% | 6 | 0.19% |
| 1948 | 1,731 | 69.69% | 720 | 28.99% | 33 | 1.33% |
| 1944 | 1,372 | 61.41% | 861 | 38.54% | 1 | 0.04% |
| 1940 | 1,643 | 61.54% | 1,014 | 37.98% | 13 | 0.49% |
| 1936 | 1,655 | 63.29% | 931 | 35.60% | 29 | 1.11% |
| 1932 | 1,330 | 68.80% | 583 | 30.16% | 20 | 1.03% |
| 1928 | 1,487 | 75.94% | 470 | 24.00% | 1 | 0.05% |
| 1924 | 1,182 | 86.91% | 108 | 7.94% | 70 | 5.15% |
| 1920 | 1,013 | 86.73% | 150 | 12.84% | 5 | 0.43% |
| 1916 | 464 | 58.96% | 309 | 39.26% | 14 | 1.78% |
| 1912 | 269 | 34.75% | 215 | 27.78% | 290 | 37.47% |
| 1908 | 589 | 76.79% | 133 | 17.34% | 45 | 5.87% |
| 1904 | 602 | 80.16% | 120 | 15.98% | 29 | 3.86% |
| 1900 | 617 | 79.10% | 114 | 14.62% | 49 | 6.28% |
| 1896 | 691 | 80.54% | 91 | 10.61% | 76 | 8.86% |
| 1892 | 588 | 66.52% | 238 | 26.92% | 58 | 6.56% |
| 1888 | 570 | 64.19% | 199 | 22.41% | 119 | 13.40% |
| 1884 | 568 | 67.70% | 202 | 24.08% | 69 | 8.22% |
| 1880 | 576 | 76.60% | 174 | 23.14% | 2 | 0.27% |
| 1876 | 399 | 72.81% | 149 | 27.19% | 0 | 0.00% |
| 1872 | 556 | 82.74% | 116 | 17.26% | 0 | 0.00% |
| 1868 | 436 | 80.15% | 108 | 19.85% | 0 | 0.00% |
Like the state of Massachusetts, Dukes County heavily supports the Democratic Party. The last Republican Party candidate to receive over 40% of the county's vote was Ronald Reagan in 1984, and the last Republican to win the county was Richard Nixon in 1972. Before 1964, however, the county was a stronghold of the Republicans, supporting Dwight D Eisenhower in 1956 by an especially large margin well over 50%, and was one of the few counties where William Howard Taft finished ahead of Woodrow Wilson in 1912. (See table).
Voter registration
| Voter registration and party enrollment as of February 2024[24] | |||||
|---|---|---|---|---|---|
| Unenrolled | 9,710 | 58.16% | |||
| Democratic | 5,762 | 34.51% | |||
| Republican | 1,117 | 6.69% | |||
| Libertarian | 42 | 0.25% | |||
| Other parties | 65 | 0.39% | |||
| Total | 16,696 | 100% | |||
Communities
Towns
- Aquinnah (formerly Gay Head)
- Chilmark
- Edgartown (shire town or county seat)
- Gosnold
- Oak Bluffs
- Tisbury
- West Tisbury
Census-designated places
Other villages
Education
School districts include:[25]
K-12:
- Gosnold School District
Secondary:
- Martha's Vineyard School District
Elementary:
- Edgartown School District
- Oak Bluffs School District
- Tisbury School District
- Up-Island Regional School District
See also
- List of Massachusetts locations by per capita income
- Registry of Deeds (Massachusetts)
- National Register of Historic Places listings in Dukes County, Massachusetts
- USS Dukes County (LST-735)
References
- ^ "Dukes County, Massachusetts". United States Census Bureau. Retrieved September 16, 2022.
- ^ "Find a County". National Association of Counties. Archived from the original on July 4, 2012. Retrieved June 7, 2011.
- ^ Cheek, Alexander (January 6, 2023). "Martha's Vineyard Map". Retrieved January 6, 2023.
- ^ Dukes County, MA – An Ancient Heritage Archived May 2, 2006, at the Wayback Machine
- ^ "2010 Census Gazetteer Files". United States Census Bureau. August 22, 2012. Archived from the original on September 14, 2014. Retrieved September 16, 2014.
- ^ "Skiff's Island Is Here Today But Gone Tomorrow". The Vineyard Gazette - Martha's Vineyard News. Retrieved January 22, 2024.
- ^ "Annual Estimates of the Resident Population for Counties: April 1, 2020 to July 1, 2023". United States Census Bureau. Retrieved April 3, 2024.
- ^ "Decennial Census by Decade". US Census Bureau.
- ^ "Historical Census Browser". University of Virginia Library. Archived from the original on August 11, 2012. Retrieved September 16, 2014.
- ^ "Population of Counties by Decennial Census: 1900 to 1990". United States Census Bureau. Retrieved September 16, 2014.
- ^ "Census 2000 PHC-T-4. Ranking Tables for Counties: 1990 and 2000" (PDF). United States Census Bureau. Retrieved September 16, 2014.
- ^ a b "P2 HISPANIC OR LATINO, AND NOT HISPANIC OR LATINO BY RACE - 2010: DEC Redistricting Data (PL 94-171) - Dukes County, Massachusetts". United States Census Bureau.
- ^ a b "P2 HISPANIC OR LATINO, AND NOT HISPANIC OR LATINO BY RACE - 2020: DEC Redistricting Data (PL 94-171) - Dukes County, Massachusetts". United States Census Bureau.
- ^ a b c "DP-1 Profile of General Population and Housing Characteristics: 2010 Demographic Profile Data". United States Census Bureau. Archived from the original on February 13, 2020. Retrieved January 12, 2016.
- ^ "Population, Housing Units, Area, and Density: 2010 – County". United States Census Bureau. Archived from the original on February 13, 2020. Retrieved January 12, 2016.
- ^ "DP02 Selected Social Characteristics in the United States – 2006–2010 American Community Survey 5-Year Estimates". United States Census Bureau. Archived from the original on February 13, 2020. Retrieved January 12, 2016.
- ^ "DP03 SELECTED ECONOMIC CHARACTERISTICS – 2006–2010 American Community Survey 5-Year Estimates". United States Census Bureau. Archived from the original on February 13, 2020. Retrieved January 12, 2016.
- ^ "U.S. Census website". United States Census Bureau. Retrieved January 31, 2008.
- ^ "County Median Home Price". National Association of Realtors. January 4, 2019. Archived from the original on April 15, 2022. Retrieved April 14, 2022.
- ^ "SELECTED ECONOMIC CHARACTERISTICS 2007–2011 American Community Survey 5-Year Estimates". U.S. Census Bureau. Archived from the original on February 12, 2020. Retrieved January 26, 2013.
- ^ "ACS DEMOGRAPHIC AND HOUSING ESTIMATES 2007–2011 American Community Survey 5-Year Estimates". U.S. Census Bureau. Archived from the original on February 12, 2020. Retrieved January 26, 2013.
- ^ "HOUSEHOLDS AND FAMILIES 2007–2011 American Community Survey 5-Year Estimates". U.S. Census Bureau. Archived from the original on February 12, 2020. Retrieved January 26, 2013.
- ^ Leip, David. "Dave Leip's Atlas of U.S. Presidential Elections". uselectionatlas.org. Retrieved August 27, 2018.
- ^ "The Commonwealth of Massachusetts" (PDF). Secretary of the Commonwealth of Massachusetts. February 24, 2024. Retrieved April 9, 2024.
- ^ "2020 CENSUS - SCHOOL DISTRICT REFERENCE MAP: Dukes County, MA" (PDF). U.S. Census Bureau. Retrieved July 22, 2022. - Text list
External links
- Official website
- National Register of Historic Places listing for Dukes Co., Massachusetts
- US Census Bureau map of cities, towns, Native American reservations, and census-designated places
Places adjacent to Dukes County, Massachusetts | ||||||||||||||||
|---|---|---|---|---|---|---|---|---|---|---|---|---|---|---|---|---|
| ||||||||||||||||
Municipalities and communities of Dukes County, Massachusetts, United States | ||
|---|---|---|
| Towns | 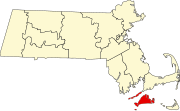 | |
| CDPs | ||
| Other villages | ||
| Indian reservation | ||

| International | |
|---|---|
| National | |
41°22′N 70°42′W / 41.37°N 70.70°W