


Leicester, England is an ethnically and culturally diverse city. It is the thirteenth most populous city in the United Kingdom.

YouTube Encyclopedic
-
1/5Views:84 74911 7454125 115644
-
British People Now Make Up Just 74% Of The UK Population
-
The archaeology of Leicester: The most excavated city in Britain?
-
Chancellor's Distinguished Lecture Series - Professor Sir Ian Diamond
-
Dr Kevin Kay - Did Neolithic people think like archaeologists? Enacting the past at Çatalhöyük
-
Realities and Illusions of Human Migration: A Geographical Perspective - Ronald Skeldon
Transcription
Population
Leicester's total population, according to the 2011 UK census, was 329,839. The population density was 4,494 people per square km.
Ethnicity


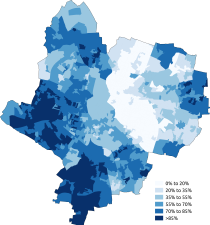
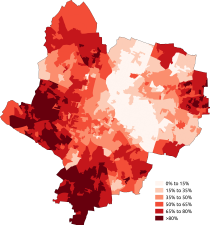
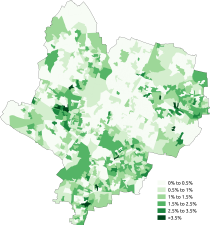
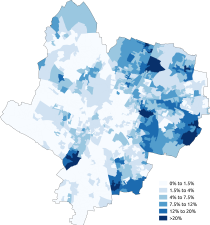
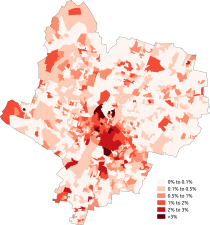
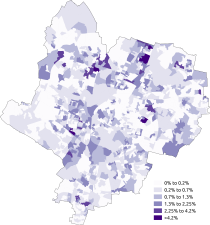
The following table shows the ethnic group of respondents in the 2001 and 2011 censuses in Leicester. The local district has been in a majority-minority state since around 2008[1] and was reported in the 2011 census to be that, with the White British population at 45% of the population of Leicester.[2][3] Asian British residents, especially Indians, have risen since post-war migration to the UK began, famously Asians from Uganda who were expelled in 1972.[2] In 1991, Asians as a broad multi-ethnic group made up nearly a quarter of the city's population but have risen to above a third of the population at 37.1%. Black British people have also risen as a group with the increase mostly coming from Black Africans who have risen from 0.3% of the city's population to nearly 4%.
| Ethnic group | 1961 estimations[4] | 1971 estimations[4] | 1981 estimations[4][5] | 1991[6] | 2001[7] | 2011[8] | 2021[9] | |||||||
|---|---|---|---|---|---|---|---|---|---|---|---|---|---|---|
| Number | % | Number | % | Number | % | Number | % | Number | % | Number | % | Number | % | |
| White: Total | 267,470 | 97.8% | 255,928 | 90% | 224,034 | 79.1% | 193,502 | 71.53% | 178,739 | 63.85% | 166,636 | 50.52% | 150,657 | 40.88% |
| White: British | – | – | – | – | – | – | – | – | 169,456 | 60.54% | 148,629 | 45.06% | 122,395 | 33.21% |
| White: Irish | – | – | – | – | – | – | 4,134 | 1.52% | 3,602 | 1.29% | 2,524 | 0.77% | 1,789 | 0.49% |
| White: Gypsy or Irish Traveller[note 1] | – | – | – | – | – | – | – | – | – | – | 417 | 0.13% | 457 | 0.12% |
| White: Other | – | – | – | – | – | – | – | – | 5,681 | 2.03% | 15,066 | 4.57% | 25,177 | 6.83% |
| White: Roma[note 2] | – | – | – | – | – | – | – | – | – | – | – | – | 839 | 0.23% |
| Asian or Asian British: Total | – | – | – | – | – | – | 67,334 | 24.89% | 85,177 | 30.43% | 122,470 | 37.13% | 159,977 | 43.40% |
| Asian or Asian British: Indian | – | – | – | – | – | – | 60,297 | 22.29% | 72,033 | 25.73% | 93,335 | 28.30% | 126,421 | 34.30% |
| Asian or Asian British: Pakistani | – | – | – | – | – | – | 2,644 | 0.97% | 4,276 | 1.53% | 8,067 | 2.45% | 12,673 | 3.44% |
| Asian or Asian British: Bangladeshi | – | – | – | – | – | – | 1,053 | 0.38% | 1,926 | 0.69% | 3,642 | 1.10% | 7,055 | 1.91% |
| Asian or Asian British: Chinese[note 3] | – | – | – | – | – | – | 770 | 0.28% | 1,426 | 0.51% | 4,245 | 1.29% | 2,481 | 0.67% |
| Asian or Asian British: Other Asian | – | – | – | – | – | – | 2,570 | 0.95% | 5,516 | 1.97% | 13,181 | 4.00% | 11,347 | 3.08% |
| Black or Black British: Total | – | – | – | – | – | – | 6,613 | 2.44% | 8,595 | 3.07% | 20,585 | 6.24% | 28,766 | 7.80% |
| Black or Black British: Caribbean | – | – | – | – | – | – | 4,112 | 1.52% | 4,610 | 1.65% | 4,790 | 1.45% | 5,025 | 1.36% |
| Black or Black British: African | – | – | – | – | – | – | 745 | 0.27% | 3,432 | 1.23% | 12,480 | 3.78% | 21,536 | 5.84% |
| Black or Black British: Other Black | – | – | – | – | – | – | 1,756 | 0.64% | 553 | 0.20% | 3,315 | 1.01% | 2,764 | 0.75% |
| Mixed: Total | – | – | – | – | – | – | – | – | 6,506 | 2.32% | 11,580 | 3.51% | 13,899 | 3.77% |
| Mixed: White and Black Caribbean | – | – | – | – | – | – | – | – | 2,841 | 1.01% | 4,691 | 1.42% | 5,025 | 1.36% |
| Mixed: White and Black African | – | – | – | – | – | – | – | – | 539 | 0.19% | 1,161 | 0.35% | 1,776 | 0.48% |
| Mixed: White and Asian | – | – | – | – | – | – | – | – | 1,908 | 0.68% | 3,388 | 1.03% | 3,659 | 0.99% |
| Mixed: Other Mixed | – | – | – | – | – | – | – | – | 1,218 | 0.44% | 2,340 | 0.71% | 3,439 | 0.75% |
| Other: Total | – | – | – | – | – | – | 3,044 | 1.12% | 904 | 0.32% | 8,568 | 2.60% | 15,272 | 4.14% |
| Other: Arab[note 4] | – | – | – | – | – | – | – | – | – | – | 3,311 | 1.00% | 3,402 | 0.92% |
| Other: Any other ethnic group | – | – | – | – | – | – | 3,044 | 1.12% | 904 | 0.32% | 5,257 | 1.59% | 11,870 | 3.22% |
| Ethnic minority: Total | 6,000 | 2.2% | 28,280 | 10% | 58,966 | 20.8% | 76,991 | 28.48% | 101,182 | 36.15% | 163,203 | 49.48% | 217,914 | 59.12% |
| Total | 273,470 | 100% | 284,208 | 100% | 283,100 | 100% | 270,493 | 100% | 279,921 | 100% | 329,839 | 100% | 368,571 | 100% |
Notes for table above
-
 White
White -
 White-British
 -
 White-Irish
 -
 White-Other
 -
 Asian
Asian -
 Asian-Indian
 -
 Asian-Pakistani
 -
 Asian-Bangladeshi
 -
 Asian-Chinese
 -
 Black
Black -
 Black-African
 -
 Black-Caribbean
 -
 Other-Arab


- Population pyramids of each ethnic group in Leicester
-
 White British

Ethnicity of school pupils
The ethnicity of school pupils within Leicester has been in flux and in a majority-minority state since statistics have been first collected in 2003. For instance, the most profound change can be seen with the White British, who have declined from 45.6% in 2004 to 23.4% in 2022. Asian British school pupils have risen in percentage, going from 37.9% of the areas school pupil population to a near majority (47%). All other groups have grown in size as well. Other White school pupils have risen from 1.7% to 7.8%, Black British school pupils have risen from 6.4% to 10.4% in 2016 but then declined to 9.5% in 2022, Mixed have risen from 5.5% to 7.5% and Other ethnicities have gone from 0.8% to 2.7%.
| Ethnic group | School year[10][11] | |||||||||
|---|---|---|---|---|---|---|---|---|---|---|
| 2004 | 2008 | 2012 | 2015/16 | 2021/2022 | ||||||
| Number | % | Number | % | Number | % | Number | % | Number | % | |
| White: Total | 19,480 | 48.1% | 16,720 | 42.4% | 15,515 | 39% | 16,583 | 36.6% | 18,905 | 31.8% |
| White: British | 18,490 | 45.6% | 15,090 | 38.3% | 13,258 | 33.3% | 13,215 | 29.1% | 13,890 | 23.4% |
| White: Irish | 190 | 133 | 86 | 73 | 65 | |||||
| White: Traveller of Irish heritage | 70 | 35 | 50 | 61 | 47 | |||||
| White: Gypsy/Roma | 30 | 30 | 139 | 235 | 266 | |||||
| White: Other | 700 | 1.7% | 1,432 | 1,978 | 2,999 | 4,637 | 7.8% | |||
| Asian / Asian British: Total | 15,360 | 37.9% | 15,924 | 40.4% | 16,512 | 41.5% | 19,682 | 43.4% | 27,906 | 47% |
| Asian / Asian British: Indian | 12,150 | 30% | 12,267 | 31.1% | 12,049 | 30.3% | 14,179 | 31.3% | 19,855 | 33.4% |
| Asian / Asian British: Pakistani | 1,020 | 1,227 | 1,382 | 1,724 | 2,557 | |||||
| Asian / Asian British: Bangladeshi | 560 | 638 | 826 | 994 | 1,617 | |||||
| Asian / Asian British: Chinese | 80 | 79 | 80 | 113 | 169 | |||||
| Asian / Asian British: Other Asians | 1,550 | 3.8% | 1,713 | 2,175 | 2,672 | 3,708 | 6.2% | |||
| Black / Black British: Total | 2,610 | 6.4% | 3,450 | 8.7% | 4,050 | 10.2% | 4,726 | 10.4% | 5,680 | 9.5% |
| Black: Caribbean | 590 | 534 | 505 | 500 | 454 | |||||
| Black: African | 1,860 | 4.6% | 2,576 | 3,130 | 3,589 | 4,390 | 7.4% | |||
| Black: Other Blacks | 160 | 337 | 415 | 637 | 836 | |||||
| Mixed / British Mixed | 2,230 | 5.5% | 2,440 | 6.2% | 2,730 | 6.9% | 3,082 | 6.8% | 4,457 | 7.5% |
| Other: Total | 310 | 0.8% | 534 | 1.4% | 650 | 1.6% | 910 | 2% | 1,618 | 2.7% |
| Unclassified | 570 | 1.4% | 152 | 0.4% | 312 | 0.8% | 384 | 0.8% | 833 | 1.4% |
| Total: | 40,540 | 100% | 39,430 | 100% | 39,765 | 100% | 45,367 | 100% | 59,399 | 100% |
Ethnicity of births
| Ethnic Group | 1981 estimates[12] | 2021[13] | ||
|---|---|---|---|---|
| Number | % | Number | % | |
| White: Total | – | 66% | 1,362 | 32.6% |
| White: British | – | – | 897 | 21.5% |
| White: Other | – | – | 465 | 11.1% |
| Asian / Asian British: Total | – | – | 1,858 | 44.6% |
| Asian / Asian British: Indian | – | – | 1,384 | 33.2% |
| Asian / Asian British: Pakistani | – | – | 176 | 4.2% |
| Asian / Asian British: Bangladeshi | – | – | 111 | 2.7% |
| Asian / Asian British: Other Asians | – | – | 187 | 4.5% |
| Black / Black British: Total | – | – | 324 | 7.7% |
| Black: Caribbean | – | – | 27 | 0.6% |
| Black: African | – | – | 258 | 6.2% |
| Black: Other Blacks | – | – | 39 | 0.9% |
| Mixed / British Mixed | – | – | 331 | 7.9% |
| Other: Total | – | – | 130 | 3.1% |
| Not Stated | – | – | 167 | 4.0% |
| Non-White: Total (not including Not stated) | – | 33% | 2,643 | 63.3% |
| Total: | – | 100% | 4,172 | 100% |
Country of birth

| Country of Birth | Year | |||||||||||
|---|---|---|---|---|---|---|---|---|---|---|---|---|
| 1971[14] | 1981[15] | 1991[16] | 2001[17] | 2011[18] | 2021[19] | |||||||
| Number | % | Number | % | Number | % | Number | % | Number | % | Number | % | |
| 242,255 | 87.4% | 223,681 | 81% | 217,656 | 80.4% | 215,455 | 77% | 218,996 | 66.4% | 217,078 | 58.9% | |
| 234,551 | 84.6% | 216,729 | 78.5% | 212,010 | 78.4% | 214,403 | 65% | 213,555 | 57.9% | |||
| 4,006 | 3,708 | 2,854 | 2,330 | 1821 | 0.49% | |||||||
| 2,243 | 1,947 | 1,726 | 1,380 | 1078 | 0.29% | |||||||
| 1,455 | - | 1,019 | 781 | 590 | 0.16% | |||||||
| 1,297 | 47 | 84 | 102 | 467 | 0.13% | |||||||
| Europe (non-UK) | 9,015 | 3.3% | 7,472 | 2.7% | 6,180 | 2.3% | 7,563 | 2.7% | 19,689 | 6% | 31,880 | 8.6% |
| 4,807 | 3,890 | 3,099 | 2,486 | 1,933 | 1,240 | 0.34% | ||||||
| Other EEC/EU | 1,532 | 0.6% | 1,750 | 0.6% | 3,021 | 1.1% | 15,927 | 4.8% | ||||
| Other Europe | 4,208 | 2,050 | 1,331 | 2,056 | 1,829 | 31,880 | 8.6% | |||||
| Asia and Middle East | 12,567 | 4.5% | 20,112 | 7.3% | 23,623 | 8.7% | 30,501 | 10.9% | 55,108 | 16.7% | 79,372 | 21.5% |
| 11,365 | 4.1% | 18,238 | 6.6% | 20,837 | 7.7% | 24,677 | 59,842 | 16.2% | ||||
| 758 | 912 | 1,162 | 1,854 | 4,989 | 1.4% | |||||||
| 397 | 686 | 1,051 | 3,233 | 0.9% | ||||||||
| Far East | 444 | 565 | 657 | 1,751 | ||||||||
| Middle East | - | 281 | 771 | |||||||||
| Other | 4 | |||||||||||
| Africa | 7,088 | 2.6% | 19,082 | 6.9% | 18,327 | 6.8% | 22,056 | 7.9% | 31,983 | 9.7% | 33,542 | 9.1% |
| North America and Caribbean | 2,870 | 1% | 2,550 | 0.9% | 2,909 | 1% | 3,545 | 2,825 | ||||
| South America | 169 | |||||||||||
| Oceania | - | 539 | 516 | 447 | ||||||||
| Other: New Commonwealth[n 1] | 444 | 493 | ||||||||||
| Other: Old Commonwealth[n 2] | 402 | 628 | 455 | |||||||||
| Other: | 2548 | 2,226 | 645 | 2 | ||||||||
| Total | 277,189 | 100% | 276,244 | 100% | 270,525 | 100% | 279,921 | 100% | 329,839 | 100% | 368,570 | 100% |
Languages
The most common main languages spoken in Leicester according to the 2011 census are shown below.[20] There were around over 70 languages or dialects spoken in the city in 2011.[2]
| Rank | Language | Usual residents aged 3+ | Proportion |
|---|---|---|---|
| 1 | English | 228,295 | 72.47% |
| 2 | Gujarati | 36,347 | 11.54% |
| 3 | Punjabi | 7,560 | 2.40% |
| 4 | Polish | 6,192 | 1.97% |
| 5 | Urdu | 3,376 | 1.07% |
| 6 | Somali | 3,331 | 1.06% |
| 7 | Arabic | 2,516 | 0.80% |
| 8 | Bengali | 1,808 | 0.57% |
| 9 | Portuguese | 1,750 | 0.56% |
| 10 | Kurdish | 1,520 | 0.48% |
| 11 | Tamil | 1,498 | 0.48% |
| 12 | Hindi | 1,095 | 0.35% |
| 13 | Persian | 1,021 | 0.32% |
| 14 | Slovak | 878 | 0.28% |
| 15 | French | 849 | 0.27% |
| 16 | Shona | 801 | 0.25% |
| 17 | Turkish | 584 | 0.19% |
| 18 | Greek | 546 | 0.17% |
| 19 | Swahili/Kiswahili | 533 | 0.17% |
| 20 | Tagalog/Filipino | 496 | 0.16% |
| Other | 14,015 | 4.45% |
Religion
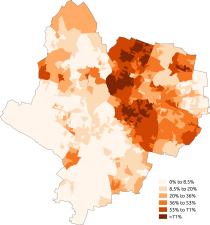
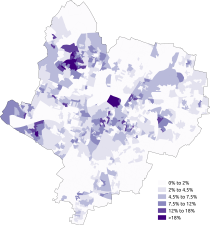
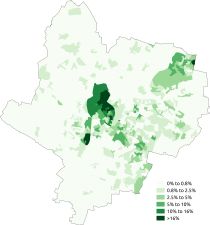
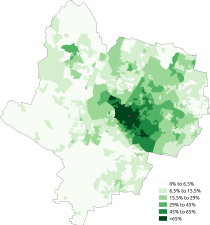
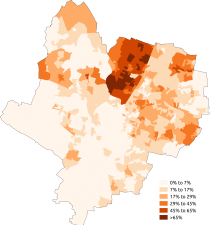
The following table shows the religion of respondents in the 2001 and 2011 censuses in Leicester. In 2012, almost 240 individual faith groups were reported to being practised in Leicester.[2]
| Religion | 2001[21] | 2011[22] | 2021 | |||
|---|---|---|---|---|---|---|
| Number | % | Number | % | Number | % | |
| Christian | 125,187 | 44.72% | 106,872 | 32.40% | 91,161 | 24.73% |
| Buddhist | 638 | 0.23% | 1,224 | 0.37% | 1,181 | 0.32% |
| Hindu | 41,248 | 14.74% | 50,087 | 15.19% | 65,821 | 17.86% |
| Jewish | 417 | 0.15% | 295 | 0.09% | 326 | 0.09% |
| Muslim | 30,885 | 11.03% | 61,440 | 18.63% | 86,443 | 23.45% |
| Sikh | 11,796 | 4.21% | 14,457 | 4.38% | 16,451 | 4.46% |
| Other religion | 1,179 | 0.42% | 1,839 | 0.56% | 2,075 | 0.56% |
| No religion | 48,789 | 17.43% | 75,280 | 22.82% | 84,607 | 22.96% |
| Religion not stated | 19,782 | 7.07% | 18,345 | 5.56% | 20,509 | 5.56% |
| Total | 279,921 | 100.00% | 329,839 | 100.00% | 368,574 | 100.00% |
-
 Christianity
 -
 Islam
Islam -
 Judaism
 -
 Hinduism
 -
 Sikhism
 -
 Buddhism
 -
 Other religion
 -
 No religion


See also
- Demography of the United Kingdom
- Demography of England
- Demography of London
- Demography of Birmingham
- Demography of Greater Manchester
- List of English cities by population
- List of English districts by population
- List of English districts and their ethnic composition
- List of English districts by area
- List of English districts by population density
Notes
- ^ Used as main option for when no other options are given, for example in 1971. This group contains all for Canada, Australia and New Zealand
- ^ Used as a conglomerate for New Commonwealth for when there are no other options as for example in 1971. This group contains all for remenents of the British Empire after 1945 (if not already indicated).
References
- ^ Herbert, Ian (11 September 2007). "Leicester to be first city where white people are minority". The Independent. Retrieved 12 November 2022.
- ^ a b c d "A City of Diversity - Story of Leicester". storyofleicester.info. Retrieved 12 November 2022.
- ^ "Census 2011: Leicester 'most ethnically diverse' in region". BBC News. 12 November 2022. Retrieved 12 November 2022.
- ^ a b c McCarthy, Liam (2021-06-07). "The National Front and the BNP in Leicester and Leicestershire". doi:10.25392/leicester.data.14685870.v2.
{{cite journal}}: Cite journal requires|journal=(help) - ^ Equality, Commission for Racial (1985). "Ethnic minorities in Britain: statistical information on the pattern of settlement". Commission for Racial Equality: Table 2.2.
- ^ Data is taken from United Kingdom Casweb Data services of the United Kingdom 1991 Census on Ethnic Data for England, Scotland and Wales (Table 6)
- ^ "Office of National Statistics; 2001 Census Key Statistics". webarchive.nationalarchives.gov.uk. Retrieved 2021-09-07.
- ^ "2011 Census: Ethnic Group, local authorities in England and Wales". webarchive.nationalarchives.gov.uk. Retrieved 2021-12-15.
- ^ "Ethnic group - Office for National Statistics". www.ons.gov.uk. Retrieved 2022-12-03.
- ^ "School and pupil characteristics". webarchive.nationalarchives.gov.uk. Retrieved 2022-11-08.
- ^ "Schools, pupils and their characteristics, Academic Year 2021/22". explore-education-statistics.service.gov.uk. Retrieved 2022-09-09.
- ^ Coleman, David (1983-01-01). "Some problems of data for the demographic study of immigration and of immigrant and minority populations in Britain". Ethnic and Racial Studies. 6 (1): 103–110. doi:10.1080/01419870.1983.9993401. ISSN 0141-9870.
- ^ "Live births by ethnicity and local authority, 2020 to 2021 - Office for National Statistics". www.ons.gov.uk. Retrieved 2023-05-12.
- ^ Taken from Casweb UK Data Service from the 1971 UK wide Census. SAS08 of Country of Birth of England.
- ^ Taken from Casweb UK Data Service from the 1981 UK wide Census. Table 4 of Country of Birth in Scotland.
- ^ Data taken from 1991 census data query on NOMIS
- ^ Census 2001 Key Statistics – Local Authorities KS05 Country of birth, Accessed 19 December 2022
- ^ 2011 Census: KS202EW National identity, local authorities in England and Wales, Accessed 19 December 2022
- ^ "Demography and migration data, England and Wales - Office for National Statistics". www.ons.gov.uk. Retrieved 2022-12-19.
- ^ "Download:local authorities: county / unitary". NOMIS. Retrieved 17 June 2015.
- ^ "2001 census - theme tables". Retrieved 17 June 2015.
- ^ "Download:local authorities: county / unitary". NOMIS. Retrieved 17 June 2015.