

The demography of Birmingham, England, is analysed by the Office for National Statistics and data produced for each of the wards that make up the city, and the overall city itself, which is the largest city proper in England as well as the core of the third most populous urban area, the West Midlands conurbation.[1]
Population
| Year | Pop. | ±% |
|---|---|---|
| 1538 | 1,300 | — |
| 1650 | 5,472 | +320.9% |
| 1700 | 15,032 | +174.7% |
| 1731 | 23,286 | +54.9% |
| 1778 | 42,250 | +81.4% |
| 1785 | 52,250 | +23.7% |
| 1801 | 73,670 | +41.0% |
| 1811 | 85,753 | +16.4% |
| 1821 | 106,722 | +24.5% |
| 1831 | 146,986 | +37.7% |
| 1841 | 182,922 | +24.4% |
| 1851 | 232,638 | +27.2% |
| 1861 | 296,076 | +27.3% |
| 1871 | 343,787 | +16.1% |
| 1881 | 400,774 | +16.6% |
| 1891 | 478,113 | +19.3% |
| 1901 | 522,204 | +9.2% |
| 1911 | 525,833 | +0.7% |
| 1921 | 919,444 | +74.9% |
| 1931 | 1,002,603 | +9.0% |
| 1939 | 995,039 | −0.8% |
| 1951 | 1,112,685 | +11.8% |
| 1961 | 1,107,187 | −0.5% |
| 1971 | 1,098,654 | −0.8% |
| 1981 | 996,365 | −9.3% |
| 1991 | 1,005,764 | +0.9% |
| 2001 | 977,091 | −2.9% |
| 2011 | 1,073,045 | +9.8% |
| 2021 | 1,142,494 | +6.5% |
| [2][3][4][5] | ||

Birmingham city's total population was 977,099 in 2001. The 2005 estimate for the population of the district of Birmingham was 1,001,200. This is the first time the population has broken the 1,000,000 barrier since 1996.[7] This was a population increase of 0.9% (8,800) from 2004, higher than the 0.6% for the United Kingdom as a whole and 0.7% for England. It is believed to have been caused as a result of increased numbers of births, increased migration and a decrease in deaths in the district.[7] The population of Birmingham is predicted to increase, though it cannot be predicted at certainty due to fluctuations in previous years in migration. The population in Birmingham is predicted to increase by 12.2% (121,500) from 992,100 in 2003 to 1,113,600 in 2028. This is an increase of around 4,000 - 5,000 each year until 2028.[8]
The mid-year population estimates from previous years have showed a general decrease in the population of Birmingham from 1982 to 2002, before beginning to increase again up to 2005, with the increase from 2004 to 2005 being the largest population increase recorded. Though, in total, the overall decline in the population of Birmingham has been by just over 1%. The dependent population (0-14 and 65+) has declined since 2001 as the working population (15-64) has increased.[7]
The ward with the lowest population following the boundary readjustments of 2004 was Ladywood with 14,801.[9] Prior to the boundary readjustments, it had a population of 23,789.[10] The ward with the highest population following the boundary readjustments of 2004 was Sparkbrook with a population of 31,485, which is an increase from 28,311 prior to the boundary adjustments.[11]
Age
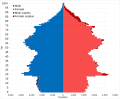
Birmingham has a young population compared to England as a whole. The mid-year population estimates of 2005 estimate that Birmingham has a younger age structure compared to England, with a higher proportion of the population of Birmingham being under the age of 34, and lower proportion being above the age of 35, than England.[7][12] In the 20 to 24 year age group, the proportion in Birmingham is about 2% above the national figure.[13]
23.4% of people were aged under 16, 57.7% were aged between 16 and 59, while 18.9% were aged over 60. The average age was 36, compared with 38.6 years for England.[13]
The district of Ladywood was found to have the lowest proportion of people who are 60 years and over than all other districts. Sutton Coldfield district had the highest proportion of people aged 60 years and over. Hodge Hill was found to have the highest population of people from the age of 0 to 15 whilst the districts of Edgbaston and Sutton Coldfield had the lowest.[9]
Population density
The population density is 3,649 people per square km compared to the 377.2 people per square km for England. The district of Hall Green had the most persons per acre at 55.22. Sutton Coldfield had the lowest number of persons per acre at 15.47, a difference of 39.75.[14]
Gender
Females represented 51.6% of the population whilst males represented 48.4%. These percentages are above and below the national, regional and county average respectively.[14] However, the 2005 mid-year estimates recorded that there were more males in the city up to the 35-39 age group. 66% of the population of Birmingham that were aged 80 or over were women, and the population of women who were aged 80 or over was 5% of the Birmingham total, as opposed to 3% for males.[7]
The district of Ladywood had the highest percentage of males in its population at 49.7%, whilst Northfield had the lowest at 47.45%. The ward of Ladywood was the only ward which percentage of males exceeded 50%, with a figure of 50.74%. Shard End had the lowest male population percentage at 46.68%.[14]
Ethnicity

The following table shows the ethnic group of respondents in estimations for 1951, 1961, 1966, 1971, 1981 and in the 1991 to 2021 censuses in Birmingham.
| Ethnic Group | 1951 estimations[15] | 1961 estimations[16] | 1966 estimations[16] | 1971 estimations[17] | 1981 estimations[18] | 1991[19][20] | 2001[21] | 2011[22] | 2021[23] | |||||||||
|---|---|---|---|---|---|---|---|---|---|---|---|---|---|---|---|---|---|---|
| Number | % | Number | % | Number | % | Number | % | Number | % | Number | % | Number | % | Number | % | Number | % | |
| White: Total | – | <99% | 1,079,018 | 97.6% | 1,014,350 | 95.3% | 921,819 | 90.9% | 834,616 | 84.8% | 754,274 | 78.48% | 687,406 | 70.35% | 621,636 | 57.93% | 556,608 | 48.7% |
| White: British | – | – | – | – | – | – | – | – | – | – | – | – | 641,345 | 65.64% | 570,217 | 53.14% | 491,211 | 42.9% |
| White: Irish | – | – | – | – | – | – | – | – | – | – | 38,290 | 3.98% | 31,467 | 3.22% | 22,021 | 2.05% | 16,964 | 1.5% |
| White: Gypsy or Irish Traveller[note 1] | – | – | – | – | – | – | – | – | – | – | – | – | – | – | 408 | 0.04% | 686 | 0.1% |
| White: Roma | – | – | – | – | – | – | – | – | – | – | – | – | – | – | – | – | 1,833 | 0.2% |
| White: Other | – | – | – | – | – | – | – | – | – | – | – | – | 14,594 | 1.49% | 28,990 | 2.70% | 45,914 | 4.0% |
| Asian or Asian British: Total | – | – | – | – | – | – | – | – | – | – | 138,867 | 14.44% | 195,794 | 20.04% | 285,640 | 26.62% | 355,384 | 31% |
| Asian or Asian British: Indian | – | – | – | – | – | – | – | – | – | – | 51,075 | 5.31% | 55,749 | 5.71% | 64,621 | 6.02% | 66,519 | 5.8% |
| Asian or Asian British: Pakistani | – | – | – | – | – | – | – | – | – | – | 66,085 | 6.87% | 104,017 | 10.65% | 144,627 | 13.48% | 195,102 | 17.0% |
| Asian or Asian British: Bangladeshi | – | – | – | – | – | – | – | – | – | – | 12,739 | 1.32% | 20,836 | 2.13% | 32,532 | 3.03% | 48,232 | 4.2% |
| Asian or Asian British: Chinese[note 2] | – | – | – | – | – | – | – | – | – | – | 3,315 | 0.34% | 5,106 | 0.52% | 12,712 | 1.18% | 12,487 | 1.1% |
| Asian or Asian British: Other Asian | – | – | – | – | – | – | – | – | – | – | 5,653 | 0.58% | 10,086 | 1.03% | 31,148 | 2.90% | 33,044 | 2.9% |
| Black or Black British: Total | – | – | – | – | – | – | – | – | – | – | 56,376 | 5.86% | 59,832 | 6.12% | 96,360 | 8.98% | 125,760 | 10.9% |
| Black or Black British: African | – | – | – | – | – | – | – | – | – | – | 2,803 | 0.29% | 6,206 | 0.64% | 29,991 | 2.79% | 66,822 | 5.8% |
| Black or Black British: Caribbean | – | – | – | – | – | – | – | – | – | – | 44,770 | 4.65% | 47,831 | 4.90% | 47,641 | 4.44% | 44,718 | 3.9% |
| Black or Black British: Other Black | – | – | – | – | – | – | – | – | – | – | 8,803 | 0.91% | 5,795 | 0.59% | 18,728 | 1.75% | 14,220 | 1.2% |
| Mixed: Total | – | – | – | – | – | – | – | – | – | – | – | – | 27,946 | 2.86% | 47,605 | 4.44% | 55,205 | 4.8% |
| Mixed: White and Black Caribbean | – | – | – | – | – | – | – | – | – | – | – | – | 15,644 | 1.60% | 24,720 | 2.30% | 25,119 | 2.2% |
| Mixed: White and Black African | – | – | – | – | – | – | – | – | – | – | – | – | 1,446 | 0.15% | 3,223 | 0.30% | 4,680 | 0.4% |
| Mixed: White and Asian | – | – | – | – | – | – | – | – | – | – | – | – | 6,307 | 0.65% | 11,186 | 1.04% | 13,130 | 1.1% |
| Mixed: Other Mixed | – | – | – | – | – | – | – | – | – | – | – | – | 4,549 | 0.47% | 8,476 | 0.79% | 12,276 | 1.1% |
| Other: Total | – | – | – | – | – | – | – | – | – | – | 11,524 | 1.19% | 6,109 | 0.63% | 21,804 | 2.03% | 51,965 | 4.6% |
| Other: Arab[note 1] | – | – | – | – | – | – | – | – | – | – | – | – | – | – | 10,910 | 1.02% | 19,196 | 1.7% |
| Other: Any other ethnic group | – | – | – | – | – | – | – | – | – | – | 11,524 | 1.19% | 6,109 | 0.63% | 10,894 | 1.02% | 32,769 | 2.9% |
| Ethnic minority: Total | – | >1% | 28,169 | 2.4% | 49,870 | 4.7% | 92,466 | 9.1% | 149,301 | 15.2% | 206,767 | 21.52% | 289,681 | 29.65% | 451,409 | 42.07% | 588,314 | 51.3% |
| Total | 1,112,685 | 100% | 1,107,187 | 100% | 1,064,220 | 100% | 1,014,285 | 100% | 983,917 | 100% | 961,041 | 100% | 977,087 | 100% | 1,073,045 | 100% | 1,144,922 | 100% |
Notes for table above
- Demographic distribution of ethnicities in the 2021 census in Birmingham
-
 White (48.7%)
 -
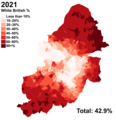 White British (42.9%)
 -
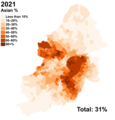 Asian (31%)
 -
 Black (10.9%)


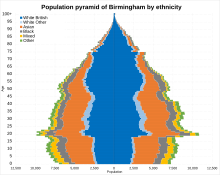
- Population pyramids of each ethnic group in Birmingham
-
 White British

Detailed
The following table shows the 20 largest ethnic groups as identified by the residents of Birmingham in the 2021 census.[24]
| Detailed ethnicity | ||
|---|---|---|
| Ethnic category | Ethnicity | Population |
| White | English, Welsh, Scottish, Northern Irish or British | 491,179 |
| Asian | Pakistani or British Pakistani | 195,102 |
| Asian | Indian or British Indian | 66,519 |
| Asian | Bangladeshi or British Bangladeshi | 48,232 |
| Black | Caribbean | 44,673 |
| Black | African (unspecified) | 25,161 |
| Mixed/Multiple | White and Black Caribbean | 25,119 |
| Other | Arab | 19,196 |
| White | Irish | 16,971 |
| Black | Somali | 16,964 |
| Mixed/Multiple | White and Asian (unspecified) | 13,130 |
| Asian | Chinese | 12,487 |
| Black | British | 9,411 |
| White | Polish | 8,407 |
| Asian | Kashmiri | 8,224 |
| White | Romanian | 7,364 |
| White | European Mixed | 7,138 |
| Black | Nigerian | 5,764 |
| Asian | Afghan | 5,293 |
| Other | Sikh | 4,842 |
These detailed ethnicities are based on the self-designation entries used in UK ethnicity classifications. Of the White ethnicities, after European Mixed (pop. 7,138) shown in the table above, the next largest were White unspecified (2,539), Other Eastern European (2,301), and Roma (1,833). After Afghan (5,293), the next largest in the Asian ethnicities include Filipino (2,311), Other/unspecified (1,778), Vietnamese (1,681) and Sri Lankan (1,672); there was also a population of 2,138 Iranians in the Asian category, however a significant number (1,857) self-identified under the Other category, instead of Asian. Similarly, there were 1,297 Sikhs who identified under Asian, but a larger number of 4,842 identified as part of Other.[24]
The next largest entries of the Black ethnicity group, after Nigerian (5,764), were Eritrean (3,020), Other/unspecified (2,467), Somalilander (2,261) and Ghanaian (2,229). In the Other ethnic category, the largest groups after Sikh (4,842) were Kashmiri (4,086), Kurdish (3,540), and 'Any other ethnic group' (2,360).[24]
Ethnicity of school pupils
| Ethnic group | School year[25][26] | |||||||||||
|---|---|---|---|---|---|---|---|---|---|---|---|---|
| 1971 estimations[17] | 2004 | 2008 | 2012 | 2015/16 | 2021/2022 | |||||||
| Number | % | Number | % | Number | % | Number | % | Number | % | Number | % | |
| White: Total | – | 84.9% | 80,070 | 52.6% | 68,580 | 46.1% | 60,585 | 39.8% | 60,674 | 35.9% | 65,246 | 31.6% |
| White: British | – | – | 75,010 | 49.3% | 63,923 | 43% | 55,856 | 36.7% | 53,490 | 31.7% | 55,476 | 26.9% |
| White: Irish | – | – | 2,010 | 1,609 | 1,018 | 753 | 508 | |||||
| White: Traveller of Irish heritage | – | – | 40 | 35 | 32 | 38 | 36 | |||||
| White: Gypsy/Roma | – | – | 20 | 24 | 119 | 733 | 1,048 | 0.5% | ||||
| White: Other | – | – | 2,990 | 2,979 | 3,558 | 5,660 | 8,178 | 4.0% | ||||
| Asian / Asian British: Total | – | – | 45,390 | 29.8% | 50,696 | 34.1% | 56,754 | 37.3% | 64,096 | 38% | 77,890 | 37.7% |
| Asian / Asian British: Indian | – | – | 9,440 | 8,884 | 8,724 | 9,224 | 10,798 | 5.2% | ||||
| Asian / Asian British: Pakistani | – | – | 27,530 | 18.1% | 32,121 | 37,209 | 42,108 | 24.9% | 49,901 | 24.2% | ||
| Asian / Asian British: Bangladeshi | – | – | 5,890 | 6,858 | 8,214 | 9,484 | 12,124 | 5.9% | ||||
| Asian / Asian British: Chinese | – | – | 550 | 568 | 605 | 829 | 1,540 | 0.7% | ||||
| Asian / Asian British: Other Asians | – | – | 1,980 | 2,265 | 2,002 | 2,451 | 3,527 | 1.7% | ||||
| Black / Black British: Total | – | – | 13,470 | 8.8% | 15,410 | 10.4% | 17,455 | 11.5% | 20,825 | 12.3% | 26,015 | 12.6% |
| Black: Caribbean | – | – | 8,510 | 7,706 | 7,455 | 6,916 | 6,515 | 3.2% | ||||
| Black: African | – | – | 3,580 | 2.4% | 6,173 | 8,274 | 11,727 | 16,903 | 8.2% | |||
| Black: Other Blacks | – | – | 1,390 | 1,528 | 1,727 | 2,182 | 2,597 | 1.3% | ||||
| Mixed / British Mixed | – | – | 8,890 | 5.8% | 9,190 | 6.2% | 10,550 | 6.9% | 13,054 | 7.7% | 19,950 | 9.7% |
| Other: Total | – | – | 2,500 | 1.6% | 3,593 | 2.4% | 5,235 | 3.4% | 7,742 | 4.6% | 11,964 | 5.8% |
| Unclassified | – | – | 1,930 | 1.3% | 444 | 0.3% | 1,591 | 1.5% | 2,420 | 1.4% | 5,304 | 2.6% |
| Ethnic minority: Total | 18,549 | 15.1% | 72,180 | 47.4% | 79,333 | 53.9% | 91,585 | 60.2% | 108,137 | 64.1% | 141,123 | 68.4% |
| Total: | – | 100% | 152,210 | 100% | 148,640 | 100% | 152,170 | 100% | 168,811 | 100% | 206,369 | 100% |
- Ethnicity of births
| Ethnic Group | 1981 estimates[27] | 2021[28] | ||
|---|---|---|---|---|
| Number | % | Number | % | |
| White: Total | – | 75% | 5,058 | 34.9% |
| White: British | – | – | 4,029 | 27.8% |
| White: Other | – | – | 1,029 | 7.1% |
| Asian / Asian British: Total | – | – | 5,595 | 38.6% |
| Asian / Asian British: Indian | – | – | 759 | 5.2% |
| Asian / Asian British: Pakistani | – | – | 3,417 | 23.6% |
| Asian / Asian British: Bangladeshi | – | – | 708 | 4.9% |
| Asian / Asian British: Other Asians | – | – | 711 | 4.9% |
| Black / Black British: Total | – | – | 1,735 | 12% |
| Black: Caribbean | – | – | 419 | 2.9% |
| Black: African | – | – | 1,128 | 7.8% |
| Black: Other Blacks | – | – | 188 | 1.3% |
| Mixed / British Mixed | – | – | 1,455 | 10.1% |
| Other: Total | – | – | 578 | 4.0% |
| Not stated | – | – | 55 | 0.4% |
| Non-White: Total (not including Not stated) | – | 25% | 9,363 | 64.7% |
| Total: | – | 100% | 14,476 | 100% |
Country of birth

| Country of birth | Year | |||||||||||||||
|---|---|---|---|---|---|---|---|---|---|---|---|---|---|---|---|---|
| 1951[29] | 1961[29] | 1971[29] | 1981[30] | 1991[31] | 2001[32] | 2011[33] | 2021[34] | |||||||||
| Number | % | Number | % | Number | % | Number | % | Number | % | Number | % | Number | % | Number | % | |
| 1,054,806 | 94.9% | 1,011,316 | 91.3% | 883,610 | 87.1% | 857,032 | 86% | 823,351 | 85.7% | 815,837 | 83.4% | 834,732 | 77.8% | 838,959 | 73.3% | |
| Foreign born | 56,946 | 5.1% | 95,865 | 8.7% | 131,060 | 12.9% | 139,331 | 14% | 137,728 | 14.3% | 161,250 | 16.6% | 238,313 | 22.2% | 305,960 | 26.7% |
| Total | 1,111,752 | 100% | 1,107,181 | 100% | 1,014,670 | 100% | 996,363 | 100% | 961,079 | 100% | 977,087 | 100% | 1,073,045 | 100% | 1,144,919 | 100% |
National identity
Of Birmingham's population of 1,144,924 (2021 census), a large majority of 721,108 had a solely 'British' identity, while 119,732 had an English identity, and 110,753 had both 'English and British' identities only. 2,826 residents had a Welsh identity and 1,199 had 'Welsh and British'. 155,501 residents had a non-UK identity, while 27,015 had both a UK and non-UK identity.[24]
Languages
The most common main languages spoken in Birmingham according to the 2011 census are shown below.[35]
| Rank | Language | Usual residents aged 3+ | Proportion |
|---|---|---|---|
| 1 | English | 866,833 | 84.70% |
| 2 | Urdu | 29,403 | 2.87% |
| 3 | Punjabi | 21,166 | 2.07% |
| 4 | Bengali (with Sylheti and Chatgaya) | 14,718 | 1.44% |
| 5 | Pakistani Pahari (with Mirpuri and Potwari) | 10,827 | 1.06% |
| 6 | Polish | 8,952 | 0.87% |
| 7 | Somali | 8,139 | 0.80% |
| 8 | Arabic | 6,921 | 0.68% |
| 9 | Pashto | 6,123 | 0.60% |
| 10 | Gujarati | 4,871 | 0.48% |
| 11 | Persian | 3,031 | 0.30% |
| 12 | French | 2,558 | 0.25% |
| 13 | Hindi | 1,540 | 0.15% |
| 14 | Romanian | 1,233 | 0.12% |
| 15 | Cantonese Chinese | 1,198 | 0.12% |
| 16 | Tagalog/Filipino | 1,186 | 0.12% |
| 17 | Portuguese | 1,127 | 0.11% |
| 18 | Tigrinya | 1,074 | 0.10% |
| 19 | German | 1,009 | 0.10% |
| 20 | Tamil | 999 | 0.10% |
| Other | 30,478 | 2.98% |
It's worth bearing in mind that according to another study that references 2011 census data, Polish becomes the second most popular language, behind Punjabi, within the West Midlands Region, of which Birmingham is the largest constituent.[36]
Religion
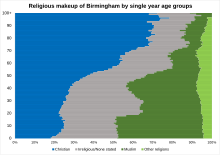

In 2001, the main religion in Birmingham was Christianity, as 59.1% (577,783) of the population were Christians. The second largest religion was Islam, adhered to by 14.3%. Meanwhile, 12.4% of the population had no religion.[37] 8.39% (81,959) did not state their religion, above the national average of 7.7%.[38][37]
Birmingham's percentage of Christians is below the national, regional and county average. The percentage of Muslims in Birmingham is above the national, regional and county average, as are the Buddhist (0.3%) and Hindu (1.98%) percentages. The Sikh percentage, 2.93%, is higher than the national and regional percentage, yet below the county figure. The percentage of Jewish population in Birmingham (0.24%) is higher than the regional and county average yet almost half that of the national average.[38]
There were only 21 out of 354 local authorities in England where the proportion of self-described Christians was lower than that of Birmingham. There were only six authorities with a higher percentage of Muslims. Birmingham's total Muslim population of 140,033 was the highest of any local authority area.[37]
The majority of people classifying themselves in one of the White or Black ethnic groups said that they were Christian. At the same time, 29.6% (1,840) Black Africans and 10.8% (1,581) people from the White 'Other' ethnic group said they were Muslim. Over 90% of people in the Bangladeshi and Pakistani groups said they were Muslim. Indian people in the main, said they were Sikh (47.9%) or Hindu (32.7%) . Over 50% of Chinese people said that they had no religion and 18.3% were Buddhist. There were 42.6% (2,605) people from the 'Other' ethnic group who said they were Muslim and 26.6% (1,622) who said they were Christian.[37]

The majority of Christians lived in the north, east and south of Birmingham, on the outskirts of the city, with far fewer living in inner-city areas. 51.7% of Birmingham's Hindu population lived in six wards of the city; Handsworth Wood (2,461), Springfield Sparkhill, Sparkrbook, Small Heath, Alum Rock, Ward End, Saltley, Bordesley Green, Washwood Heath, Stechford (2,023), Erdington, Bromford Lozells and East Handsworth (1,761), Soho (1,699), Hall Green (1,224) and Sparkbrook (845). Almost 65% of Birmingham's Jewish population lived within five wards of Birmingham; Edgbaston (586), Selly Oak (361), Moseley and Kings Heath (321), Bournville (131) and Erdington (104). 71.7% of Birmingham's Muslim population lived in seven wards of Birmingham; Sparkbrook, Sparkhill, Small Heath, Alum Rock, Ward End, Saltley, (19,372), Bordesley Green (18,629), Washwood Heath Stechford, (16,847), Springfield (13,461), Aston (12,381), Lozells and East Handsworth (10,853) and Nechells Erdington, Bromford (8,822), all inner-city wards. The majority of Sikhs were found to live in the west and south east of the city. The ward with the highest proportion of Buddhists was Edgbaston at 1.4% (257).[37]
The following table shows the religion of respondents in estimations for 1991 and in the 2001, 2011 and 2021 censuses in Birmingham.
| Religion | 1991 estimations[39] | 2001[40] | 2011[41] | 2021[42] | ||||
|---|---|---|---|---|---|---|---|---|
| Number | % | Number | % | Number | % | Number | % | |
| Christian | – | – | 577,783 | 59.13% | 494,358 | 46.07% | 389,406 | 34.0% |
| Buddhist | – | – | 2,977 | 0.30% | 4,780 | 0.45% | 4,340 | 0.4% |
| Hindu | – | – | 19,358 | 1.98% | 22,362 | 2.08% | 21,997 | 1.9% |
| Jewish | – | – | 2,343 | 0.24% | 2,205 | 0.21% | 1,687 | 0.1% |
| Muslim | 80,461 | 8% | 140,033 | 14.33% | 234,411 | 21.85% | 341,811 | 29.9% |
| Sikh | – | – | 28,592 | 2.93% | 32,376 | 3.02% | 33,126 | 2.9% |
| Other religion | – | – | 2,501 | 0.26% | 5,646 | 0.53% | 6,367 | 0.6% |
| No religion | – | – | 121,541 | 12.44% | 206,821 | 19.27% | 276,327 | 24.1% |
| Religion not stated | – | – | 81,959 | 8.39% | 70,086 | 6.53% | 69,856 | 6.1% |
| Total | 1,005,764 | 100% | 977,087 | 100.00% | 1,073,045 | 100.00% | 1,144,917 | 100.00% |
-
 Christianity
 -
 Islam
Islam -
 Judaism
 -
 Hinduism
 -
 Sikhism
 -
 Buddhism
 -
 Other religion
 -
 No religion


Sexual orientation
Of all usual residents aged 16 or over (889,624) in the 2021 census, 779,053 of these identified as 'Straight or Heterosexual'. 11,968 identified as 'Gay or Lesbian', 11,258 identified as 'Bisexual', and 3,580 identified as any other orientation. 83,765 did not answer.[24]
Income and industry
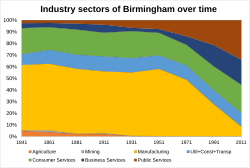
The majority of Birmingham works in the service industry, with manufacturing which used to take 50% of jobs collapsing in proportion of industrial sector in the latter half of the 20th century.
Health
219,427 residents in Birmingham were said to be in 'Not Good Health' (2021 census).[24]
Obesity
29% of the adult population are classified as obese while the European average is 14%. A quarter of Birmingham's 11- and 12-year-olds are considered obese.[citation needed]
Education
Housing
The following table shows the accommodation type of all usual residents in households in Birmingham (2021 census).[24]
| Accommodation type | Population |
|---|---|
| Whole house or bungalow | 927,835 |
| Whole house or bungalow: Detached | 141,217 |
| Whole house or bungalow: Semi-detached | 436,846 |
| Whole house or bungalow: Terraced | 349,772 |
| Flat, maisonette or apartment | 189,335 |
| A caravan or other mobile or temporary structure | 677 |
Tenure
Of 423,456 households as of 2021, a majority of 226,657 owned their home (of which 114,967 owned outright and 111,690 owned with a mortgage or loan or shared ownership). 196,799 households rented their home (of which 99,499 rented socially and 97,300 rented privatally or live rent-free).[24]
| Tenure | 1981[43] | 1991[44] | 2001[45] | 2011[46] | 2021[47] | |||||
|---|---|---|---|---|---|---|---|---|---|---|
| Number | % | Number | % | Number | % | Number | % | Number | % | |
| Owned | 187,754 | 52.6% | 224,804 | 232,771 | 230,556 | 56.1% | 226,657 | 53.5% | ||
| Owned: outright | 83,277 | 106,437 | 110,356 | 118,611 | ||||||
| Owned: with a mortgage or loan | 141,527 | 129,772 | 120,200 | 108,046 | ||||||
| Privately renting | 31,093 | 8.7% | 29,495 | 46,154 | 73,405 | 95,719 | 22.6% | |||
| Lives rent free | 7,183 | 1,580 | ||||||||
| Social renting | 137,963 | 38.7% | 119,738 | 108,429 | 99,592 | 99,499 | 23.5% | |||
| Total | 356,810 | 100% | 374,037 | 100% | 390,792 | 100% | 410,736 | 100% | 423,455 | 100% |
Household composition
Of 423,456 households, 133,225 were one-person households, 243,037 were single family households, and 47,195 were other types of households.[24]
See also
- Demographics of the West Midlands
- Religion in Birmingham
- Religion in England
- Demographics of the United Kingdom
- Demographics of England
- Demographics of London
- Demographics of Greater Manchester
- List of English cities by population
- List of English districts by population
- List of English districts and their ethnic composition
- List of English districts by area
- List of English districts by population density
References
- ^ "100 Largest Cities and Towns in the UK by Population". The Geographist. 4 May 2019. Retrieved 23 June 2022.
- ^ Spencer, Andrew. "Population of Birmingham". Bham.de. Archived from the original on 18 July 2011. Retrieved 6 November 2010.
- ^ "Historic population of Birmingham". Birmingham City Council. Archived from the original on 29 June 2011. Retrieved 6 November 2010.
- ^ "Birmingham MB/CB: Historical statistics – Population". A Vision of Britain through Time. University of Portsmouth. 2009. Retrieved 6 November 2010.
- ^ "Birmingham". Office for National Statistics. Retrieved 6 November 2010.
- ^ "A Vision of Britain through time, Population Statistics, University of Portsmouth, Birmingham District through time: Total Population". Retrieved 15 July 2013.
- ^ a b c d e Council, Birmingham City. "News and media | Birmingham City Council". www.birmingham.gov.uk.
- ^ Council, Birmingham City. "News and media | Birmingham City Council". www.birmingham.gov.uk.
- ^ a b Council, Birmingham City. "News and media | Birmingham City Council". www.birmingham.gov.uk.
- ^ Council, Birmingham City. "Ladywood constituency". www.birmingham.gov.uk.
- ^ Council, Birmingham City. "News and media | Birmingham City Council". www.birmingham.gov.uk.
- ^ Council, Birmingham City. "News and media | Birmingham City Council". www.birmingham.gov.uk.
- ^ a b "Birmingham City Council: Census 2001 - About Birmingham". Archived from the original on 9 June 2008.
- ^ a b c Council, Birmingham City. "News and media | Birmingham City Council". www.birmingham.gov.uk.
- ^ Lindsey, Lydia (2002). "The Split-Labor Phenomenon: Its Impact on West Indian Workers as a Marginal Working Class in Birmingham, England, 1948-1962". The Journal of African American History. 87: 119–145. doi:10.1086/JAAHv87n1p119. ISSN 1548-1867. JSTOR 1562495. S2CID 224834766.
- ^ a b Jones, Philip N. (1970). "Some Aspects of the Changing Distribution of Coloured Immigrants in Birmingham, 1961-66". Transactions of the Institute of British Geographers (50): 199–219. doi:10.2307/621354. ISSN 0020-2754. JSTOR 621354.
- ^ a b Woods, R. I. (April 1977). "A note on the future demographic structure of the coloured population of Birmingham, England". Journal of Biosocial Science. 9 (2): 239–250. doi:10.1017/S0021932000011019. ISSN 1469-7599. PMID 853051. S2CID 36135111.
- ^ Equality, Commission for Racial (1985). "Ethnic minorities in Britain: statistical information on the pattern of settlement". Commission for Racial Equality: Table 2.2.
- ^ As UK Census data post 2001 is unavailable through the ONS website, it has been recommended to use archival census collection websites to obtain data. Data is taken from United Kingdom Casweb Data services of the United Kingdom 1991 Census on Ethnic Data for England. (Table 6)
- ^ Office of Population Censuses and Surveys; General Register Office for Scotland; Registrar General for Northern Ireland (1997): 1991 Census aggregate data. UK Data Service (Edition: 1997). DOI: http://dx.doi.org/10.5257/census/aggregate-1991-1 This information is licensed under the terms of the Open Government Licence
- ^ "2001 census - theme tables". NOMIS. Retrieved 5 September 2014.
- ^ "QS201EW - Ethnic group". NOMIS. Retrieved 8 August 2015.
- ^ "Ethnic group - Office for National Statistics". www.ons.gov.uk. Retrieved 29 November 2022.
- ^ a b c d e f g h i "Birmingham Local Authority - Census 2021 Ethnicity dataset".
- ^ "School and pupil characteristics". webarchive.nationalarchives.gov.uk. Archived from the original on 31 October 2012. Retrieved 8 November 2022.
{{cite web}}: CS1 maint: bot: original URL status unknown (link) - ^ "Schools, pupils and their characteristics, Academic Year 2021/22". explore-education-statistics.service.gov.uk. Retrieved 9 September 2022.
- ^ Coleman, David (1 January 1983). "Some problems of data for the demographic study of immigration and of immigrant and minority populations in Britain". Ethnic and Racial Studies. 6 (1): 103–110. doi:10.1080/01419870.1983.9993401. ISSN 0141-9870.
- ^ "Live births by ethnicity and local authority, 2020 to 2021 - Office for National Statistics". www.ons.gov.uk. Retrieved 12 May 2023.
- ^ a b c Woods, Robert (October 1979). "Ethnic segregation in Birmingham in the 1960s and 1970s". Ethnic and Racial Studies. 2 (4): 455–476. doi:10.1080/01419870.1979.9993279. ISSN 0141-9870.
- ^ "1981 census - small area statistics - Nomis - Official Census and Labour Market Statistics". www.nomisweb.co.uk. Retrieved 23 June 2023.
- ^ "1991 census - local base statistics - Nomis - Official Census and Labour Market Statistics". www.nomisweb.co.uk. Retrieved 23 June 2023.
- ^ "KS005 - Country of birth - Nomis - Official Census and Labour Market Statistics". www.nomisweb.co.uk. Retrieved 23 June 2023.
- ^ "QS203EW (Country of birth (detailed)) - Nomis - Official Census and Labour Market Statistics". www.nomisweb.co.uk. Retrieved 23 June 2023.
- ^ "TS004 - Country of birth - Nomis - Official Census and Labour Market Statistics". www.nomisweb.co.uk. Retrieved 22 April 2023.
- ^ "Download:local authorities: county / unitary". NOMIS. Retrieved 5 September 2014.
- ^ "West Midlands: Census Profile".
- ^ a b c d e Council, Birmingham City. "News and media | Birmingham City Council". www.birmingham.gov.uk.
- ^ a b Council, Birmingham City. "News and media | Birmingham City Council". www.birmingham.gov.uk.
- ^ Smith, Barbara M D (July 1998). "Managing a Conurbation: Birmingham and its Region". Urban Studies. 35 (8): 1393–1394. doi:10.1080/0042098984420. S2CID 221012355. ProQuest 236282558.
- ^ "2001 census - theme tables". Retrieved 5 September 2014.
- ^ "Download:local authorities: county / unitary". NOMIS. Retrieved 2 September 2014.
- ^ "Religion, England and Wales: Census 2021". Retrieved 29 November 2022.
- ^ "1981 census - small area statistics - Nomis - Official Census and Labour Market Statistics". www.nomisweb.co.uk. Retrieved 21 December 2023.
- ^ "1991 census - local base statistics".
- ^ "KS018 - Tenure - Nomis - Official Census and Labour Market Statistics". www.nomisweb.co.uk. Retrieved 21 December 2023.
- ^ "KS402EW (Tenure) - Nomis - Official Census and Labour Market Statistics". www.nomisweb.co.uk. Retrieved 21 December 2023.
- ^ "TS054 - Tenure - Nomis - Official Census and Labour Market Statistics". www.nomisweb.co.uk. Retrieved 21 December 2023.
| History |  | |
|---|---|---|
| Geography | ||
| Government | ||
| Culture | ||