
| Demographics of Ukraine | |
|---|---|
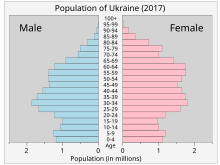
 Ukraine population pyramid on 1 January 2021. | |
| Population | Including Russian occupied territory: 41,130,432 Excluding Russian occupied territory: 36,744,636 |
| Growth rate | −6.6 |
| Birth rate | 8.6 |
| Death rate | 15.2 |
| Life expectancy | 71.76 years |
| • male | 66.69 |
| • female | 76.72 |
| Fertility rate | 0.7 |
| Infant mortality rate | 7.0 deaths/1,000 |
| Net migration rate | −5.4 migrant(s)/1,000 population (2015) |
| Age structure | |
| 0–14 years | |
| 15–64 years | |
| 65 and over | |
| Sex ratio | |
| At birth | 1.06 male(s)/female |
| Under 15 | 1.06 male(s)/female |
| 15–64 years | 0.92 male(s)/female |
| 65 and over | 0.51 male(s)/female |
| Nationality | |
| Nationality | noun: Ukrainian(s) adjective: Ukrainian |
| Major ethnic | Ukrainians (77.8%) 2001 |
| Minor ethnic | Russians (17.3%) 2001, Other (4.9%) 2001 |
| Language | |
| Official | Ukrainian |
| Spoken | Ukrainian, Russian, others |

According to the United Nations, Ukraine has a population of 36,744,636 as of 2023.[5] In July 2023, Reuters reported that due to the refugee outpouring into Western Europe, the population of Kyiv-controlled areas may have decreased to as low as 28 million.[6] This is a steep decline from 2020, when it had a population of almost 42 million people.[7] This is in large part due to the ongoing Ukrainian refugee crisis and loss of territory caused by Russia's invasion of Ukraine. The most recent (and only) census of a post-Soviet Ukraine occurred over 20 years ago, in 2001. Thus, much of the information presented here could be inaccurate and/or outdated.
YouTube Encyclopedic
-
1/5Views:23 051454 78799489 996333 524
-
Ukraine - Changing of Population Pyramid & Demographics (1950-2100)
-
Inside Russia's Looming Demographics Crisis
-
“We are dying out here”: Study hears Ukrainian voices on depopulation crisis
-
Europe's Population Crisis Is About To Explode, Demographics Collapse is Here. End of EU?
-
Why Major European Countries Are Dying
Transcription
History
The majority of the historical information is sourced from Demoscope.ru.[8]
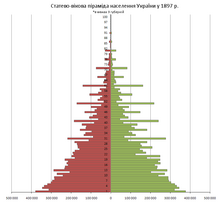
The territory of Ukraine has varied greatly in history. Western Ukraine, west of the Zbruch river, until 1939 was for most of the time part of the Kingdom of Galicia and later the Polish Republic. Detailed information for those territories is missing, for more information see Demographics of Poland. Crimea changed hands as well; in 1897 it was a part of the Taurida Governorate, but after the October Revolution became part of the Russian SFSR, and in 1954 was brought under the administration of the Ukrainian SSR. The territory of Budjak (southern Bessarabia) became a part of the Ukrainian SSR in June 1940.
There were roughly four million Ukrainians at the end of the 17th century.[9]
The censuses of 1926 through 1989 were taken in the Ukrainian SSR. The census of 1897 is taken from the statistics of nine governorates that were in the territory of today's Ukraine. The statistics of the 1906 records are taken from www.statoids.com which provides a broad degree of historical explanation on the situation in Imperial Russia. The census statistics of 1931 were estimated by Professor Zenon Kuzela.[10] His calculations are as of 1 January 1931. The Encyclopedia of Ukraine mentions Kuzela as one of the only ethnographic sources available, due to a lack of an official census.[11][12]
Famines and migration
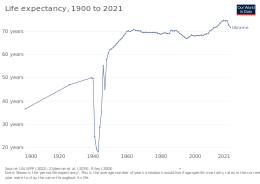
The famines of the 1930s, followed by the devastation of World War II, created a demographic disaster. Life expectancy at birth fell to a level as low as ten years for females and seven for males in 1933 and plateaued around 25 for females and 15 for males in the period 1941–44.[13] According to The Oxford companion to World War II, "Over 7 million inhabitants of Ukraine, more than one-sixth of the pre-war population, were killed during the Second World War."[14]

Significant migration took place in the first years of Ukrainian independence. More than one million people moved into Ukraine in 1991–92, mostly from the other former Soviet republics. In total, between 1991 and 2004, 2.2 million immigrated to Ukraine (of these, 2 million came from the other former Soviet Union states), and 2.5 million emigrated from Ukraine (of these, 1.9 million moved to other former Soviet Union republics).[15] As of 2015, immigrants constituted an estimated 11.4% of the total population, or 4.8 million people.[16] In 2006, there were an estimated 1.2 million Canadians of Ukrainian ancestry,[17] giving Canada the world's third-largest Ukrainian population behind Ukraine itself and Russia. There are also large Ukrainian diaspora communities in Russia, Poland, the United States, Brazil, Kazakhstan, and Argentina.
Since about 2015, there has been a growing number of Ukrainians working in the European Union, particularly Poland. Eurostat reported that 662,000 Ukrainians received EU residence permits in 2017, with 585,439 being to Poland. In 2019, World Bank statistics show that money remittances back to Ukraine have roughly doubled from 2015 to 2018, and are worth about 4% of GDP.[18][19] The Ukrainian authorities only records its citizens who apply for foreign citizenship, not those who apply for foreign residency[20]
After the start of the Russian invasion of Ukraine, eight million people fled during the ensuing Ukrainian refugee crisis, Europe's biggest refugee crisis since World War II. Most have gone to Central Europe.
Population decline

According to estimations of the State Statistics Service of Ukraine, the population of Ukraine (excluding Crimea) on 1 May 2021 was 41,442,615.[1]
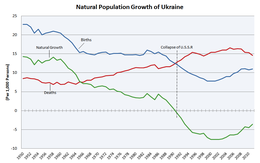
The country's population has been declining since the 1990s because of a high emigration rate, coupled with high death rates and low birth rates. The population has been shrinking by an average of over 300,000 annually since 1993.
In 2007, the country's rate of population decline was the fourth highest in the world.[23] During the years 2008 to 2010, more than 1.5 million children were born in Ukraine, compared to fewer than 1.2 million during 1999–2001. In 2008, Ukraine posted record-breaking birth rates since its 1991 independence. Infant mortality rates have also dropped from 10.4 deaths to 8.3 per 1,000 children under one year of age, making it lower than 153 countries.[24]
In 2019 the government ran an electronic census using multiple sources, including mobile phone and pension data, and estimated that Ukraine's population, excluding Crimea and parts of the Donbas, to be 37.3 million. About 20 million were of active working age.[25][26]
The Russian invasion considerably deepened the country's demographic crisis. A July 2023 study by the Vienna Institute for International Economic Studies stated that "[r]egardless of how long the war lasts and whether or not there is further military escalation, Ukraine is unlikely to recover demographically from the consequences of the war. Even in 2040 it will have only about 35 million inhabitants, around 20% fewer than before the war (2021: 42.8 million) and the decline in the working-age population is likely to be the most severe and far-reaching." The study took different scenarios, from a "best case" (end of the war in 2023 without much further escalation) to a "worst case" (end of the war in 2025 with further escalation) into account. Flight from war affects especially the southern and eastern regions and especially educated women of child-bearing age and their children. With an estimate of more than 20% of refugees not returning, study author Maryna Tverdostup concludes that this will lead to long-term shrinking and will significantly impair the conditions for reconstruction.[27]
Fertility and natalist policies
The current birth rate in Ukraine, as of 2020[update], is 8.1 live births/1,000 population, and the death rate is 14.7 deaths/1,000 population.[4]
The phenomenon of lowest-low fertility, defined as total fertility below 1.3, is emerging throughout Europe and is attributed by many to postponement of the initiation of childbearing. Ukraine, where total fertility (a very low 1.1 in 2001), was one of the world's lowest, shows that there is more than one pathway to lowest-low fertility. Although Ukraine has undergone immense political and economic transformations during 1991–2004, it has maintained a young age at first birth and nearly universal childbearing. Analysis of official national statistics and the Ukrainian Reproductive Health Survey show that fertility declined to very low levels without a transition to a later pattern of childbearing. Findings from focus group interviews suggest explanations of the early fertility pattern. These findings include the persistence of traditional norms for childbearing and the roles of men and women, concerns about medical complications and infertility at a later age, and the link between early fertility and early marriage.[28] Ukraine subsequently has one of the oldest populations in the world, with the average age of 40.8 years.[29]
To help mitigate the declining population, the government continues to increase child support payments. Thus it provides one-time payments of 12,250 hryvnias for the first child, 25,000 hryvnias for the second and 50,000 hryvnias for the third and fourth, along with monthly payments of 154 hryvnias per child.[30][31] The demographic trend was showing signs of improvement, as the birth rate was steadily growing from 2001 to 2013.[32] Net population growth over the first nine months of 2007 was registered in five provinces of the country (out of 24), and population shrinkage was showing signs of stabilising nationwide. In 2007 the highest birth rates were in the western oblasts.[33] In 2008, Ukraine emerged from lowest-low fertility, and the upward trend has continued to 2012, with the population still decreasing but at a pace that was slowing year to year. If early 2010s trends were continuing, the population of Ukraine could have returned to positive growth later in the same decade. Similar trends were seen in Russia and Belarus as well, who experienced population growth in the 2010's. In 2014 the strong decline in births was re-established, with 2018 having fewer than half the number of births as in 1989. (see demographic tables) In 2020 the number of births decreased to 293,000, reaching levels not seen even in the late 90s and early 2000s when the number of births started to increase.
Due to mass emigration and destruction of property caused by Russian Invasion of Ukraine, the country's birth rate has declined significantly, and was 28% lower in the first six months of 2023 compared to the same period in 2021.[34] However, there could very well be a small, but meaningful increase in births, with the fertility rate possibly increasing to 1.60 children per women, even higher than the peak of 1.53 seen in 2012.[35]
Population

Life expectancy
- total population: 71.37
 years
years - male: 66.34 years
- female: 76.22 years (2013 official)
Average life expectancy at birth of the total population.[36]
| Period | Life expectancy in Years |
|---|---|
| 1950–1955 | 61.83 |
| 1955–1960 | |
| 1960–1965 | |
| 1965–1970 | |
| 1970–1975 | |
| 1975–1980 | |
| 1980–1985 | |
| 1985–1990 | |
| 1990–1995 | |
| 1995–2000 | |
| 2000–2005 | |
| 2005–2010 | |
| 2010–2015 |
Total fertility rate
- 1.12
 children born/woman (2000)
- 1.44 children born/woman (2010)
- 1.22 children born/women (2020)
Vital statistics
Notable events in Ukraine demography:
- 1932-33 – South Soviet Famine in Ukrainian Soviet Socialist Republic
- 1939 – Addition of western regions to Ukraine with the End of the Second Polish Republic due to German–Soviet invasion of Poland at the beginning of Second World War
- 1991 – Independence from the USSR
- 2004-2005 – Orange Revolution
- 2014 – Annexation of Crimea by the Russian Federation
- 2022 – Russian invasion of Ukraine
Ukrainian provinces of the Russian Empire
The figures below refer to the nine governorates of the Russian Empire (Volhynia, Katerynoslav, Kyiv, Podilia, Poltava, Tauryda, Kharkiv, Kherson and Chernihiv) with a Ukrainian majority.[40]
| Average population | Live births | Deaths | Natural change | Crude birth rate (per 1,000) | Crude death rate (per 1,000) | Natural change (per 1,000) | Total fertility rates | |
|---|---|---|---|---|---|---|---|---|
| 1900 | 24,969,000 | 1,203,334 | 660,723 | 542,611 | 48.2 | 26.5 | 21.7 | |
| 1901 | 25,505,000 | 1,123,519 | 657,883 | 465,636 | 44.1 | 25.8 | 18.3 | |
| 1902 | 25,935,000 | 1,207,512 | 681,580 | 525,932 | 46.6 | 26.3 | 20.3 | |
| 1903 | 26,449,000 | 1,188,404 | 663,067 | 525,337 | 44.9 | 25.1 | 19.9 | |
| 1904 | 26,961,000 | 1,228,116 | 682,068 | 546,048 | 45.6 | 25.3 | 20.3 | |
| 1905 | 27,210,000 | 1,160,308 | 779,107 | 381,201 | 41.1 | 27.6 | 14.0 | |
| 1906 | 27,949,000 | 1,225,951 | 724,045 | 501,906 | 43.9 | 25.9 | 18.0 | |
| 1907 | 28,418,000 | 1,279,027 | 701,451 | 577,576 | 45.0 | 24.7 | 20.3 | |
| 1908 | 29,069,000 | 1,232,862 | 692,624 | 540,238 | 42.4 | 23.8 | 18.6 | |
| 1909 | 29,700,000 | 1,226,155 | 744,818 | 481,337 | 41.3 | 25.1 | 16.2 | |
| 1910 | 30,297,000 | 1,225,658 | 839,491 | 386,167 | 40.5 | 27.7 | 12.7 | |
| 1911 | 30,858,000 | 1,240,985 | 670,742 | 570,243 | 40.2 | 21.7 | 18.5 | |
| 1912 | 30,580,000 | 1,245,358 | 654,157 | 591,201 | 40.7 | 21.4 | 19.3 | |
| 1913 | 31,142,000 | 1,222,277 | 715,924 | 506,353 | 39.2 | 23.0 | 16.3 | 6.00 |
| 1914 | 30,973,000 | 1,240,114 | 716,875 | 523,239 | 40.0 | 23.1 | 16.9 |
Between WWI and WWII
| [41] | Average population | Live births | Deaths | Natural change | Crude birth rate (per 1,000) | Crude death rate (per 1,000) | Natural change (per 1,000) | Fertility rates | Life Expectancy (male) | Life Expectancy (female) |
|---|---|---|---|---|---|---|---|---|---|---|
| 1924 | 27,400,000 | 1,211,000 | 484,880 | 726,120 | 43.3 | 17.3 | 25.9 | |||
| 1925 | 28,000,000 | 1,246,000 | 531,819 | 714,181 | 43.4 | 18.5 | 24.9 | 5.39 | ||
| 1926 | 28,700,000 | 1,258,000 | 518,656 | 739,344 | 42.5 | 17.5 | 25.0 | |||
| 1927 | 29,589,000 | 1,228,000 | 579,000 | 649,000 | 40.6 | 19.1 | 21.5 | 43.3 | 46.8 | |
| 1928 | 30,251,000 | 1,178,000 | 575,000 | 603,000 | 38.1 | 18.6 | 19.5 | 44.6 | 48.7 | |
| 1929 | 30,894,000 | 1,115,000 | 585,000 | 530,000 | 35.5 | 18.6 | 16.9 | 42.8 | 46.7 | |
| 1930 | 31,436,000 | 1,053,000 | 580,000 | 473,000 | 33.0 | 18.2 | 14.8 | 42.5 | 46.9 | |
| 1931 | 31,882,000 | 1,001,000 | 553,000 | 448,000 | 31.0 | 17.1 | 13.9 | 43.5 | 47.9 | |
| 1932 | 32,342,000 | 801,000 | 746,000 | 55,000 | 24.7 | 23.0 | 1.7 | 34.5 | 39.4 | |
| 1933 | 32,456,000 | 564,000 | 2,104,000 | -1,540,000 | 17.4 | 64.8 | -47.4 | |||
| 1934 | 30,916,000 | 562,000 | 508,000 | 54,000 | 18.1 | 16.4 | 1.7 | 37.6 | 42.1 | |
| 1935 | 31,006,000 | 770,000 | 381,000 | 389,000 | 24.5 | 12.1 | 12.4 | 46.3 | 52.7 | |
| 1936 | 31,423,000 | 905,000 | 403,000 | 502,000 | 28.3 | 12.6 | 15.7 | 47.6 | 53.0 | |
| 1937 | 31,957,000 | 1,227,000 | 450,000 | 777,000 | 37.5 | 13.7 | 23.7 | 46.2 | 51.9 | |
| 1938 | 32,742,000 | 1,123,000 | 451,000 | 672,000 | 33.6 | 13.5 | 20.1 | 47.9 | 52.7 | |
| 1939 | 33,425,000 | 1,080,000 | 412,600 | 667,400 | 31.7 | 12.1 | 19.6 | 47.7 | 52.5 | |
| 1940(b) | 40,649,000 | 1,243,000 | 30.6 | 3.80 | 47.4 | 52.4 |
(a) Information is given for Ukraine's territory within its old boundaries up to 17 September 1939 (b) Information is given for Ukraine's territory within its present-day boundaries, after the Soviet annexation of Eastern Galicia and Volhynia in September 1939
After WWII
Source: State Statistics Service of Ukraine[42]
| Average population |
Live births | Deaths | Natural change | Crude birth rate (per 1,000) | Crude death rate (per 1,000) | Natural change (per 1,000) | Fertility rates | Urban fertility | Rural fertility | Abortions, reported | |
|---|---|---|---|---|---|---|---|---|---|---|---|
| 1945 | 435,230 | ||||||||||
| 1946 | 753,493 | ||||||||||
| 1947 | 712,994 | ||||||||||
| 1948 | 757,783 | ||||||||||
| 1949 | 911,641 | ||||||||||
| 1950 | 36,905,000 | 844,585 | 315,300 | 529,300 | 22.9 | 8.5 | 14.3 | 2.81 | |||
| 1951 | 37,569,000 | 858,052 | 327,500 | 530,600 | 22.8 | 8.7 | 14.1 | 2.76 | |||
| 1952 | 38,141,000 | 846,434 | 325,700 | 520,700 | 22.2 | 8.5 | 13.7 | 2.64 | |||
| 1953 | 38,678,000 | 795,652 | 326,800 | 468,900 | 20.6 | 8.4 | 12.1 | 2.41 | |||
| 1954 | 39,131,000 | 845,128 | 318,500 | 526,600 | 21.6 | 8.1 | 13.5 | 2.48 | |||
| 1955 | 39,506,000 | 792,696 | 296,200 | 496,500 | 20.1 | 7.5 | 12.6 | 2.70 | |||
| 1956 | 40,082,000 | 822,569 | 293,000 | 529,600 | 20.5 | 7.3 | 13.2 | 2.29 | |||
| 1957 | 40,800,000 | 847,781 | 304,800 | 543,000 | 20.8 | 7.5 | 13.3 | 2.29 | |||
| 1958 | 41,512,000 | 873,483 | 286,700 | 586,800 | 21.0 | 6.9 | 14.1 | 2.30 | |||
| 1959 | 42,155,000 | 880,552 | 316,800 | 563,800 | 20.9 | 7.5 | 13.4 | 2.29 | |||
| 1960 | 42,469,000 | 878,768 | 296,171 | 582,597 | 20.7 | 7.0 | 13.7 | 2.24 | |||
| 1961 | 43,097,000 | 843,482 | 304,346 | 539,136 | 19.6 | 7.1 | 12.5 | 2.17 | |||
| 1962 | 43,559,000 | 823,151 | 331,454 | 491,697 | 18.9 | 7.6 | 11.3 | 2.14 | |||
| 1963 | 44,088,000 | 794,969 | 323,556 | 471,413 | 17.9 | 7.3 | 10.6 | 2.06 | |||
| 1964 | 44,664,000 | 741,668 | 315,340 | 426,328 | 16.5 | 7.0 | 9.5 | 1.96 | |||
| 1965 | 45,133,000 | 692,153 | 342,717 | 349,436 | 15.3 | 7.6 | 7.7 | 1.99 | |||
| 1966 | 45,548,000 | 713,492 | 344,850 | 368,642 | 15.6 | 7.5 | 8.1 | 2.02 | |||
| 1967 | 45,997,000 | 699,381 | 368,573 | 330,808 | 15.1 | 8.0 | 7.2 | 2.01 | |||
| 1968 | 46,408,000 | 693,064 | 374,440 | 318,624 | 14.9 | 8.0 | 6.9 | 1.99 | |||
| 1969 | 46,778,000 | 687,991 | 404,151 | 283,840 | 14.7 | 8.6 | 6.1 | 2.04 | |||
| 1970 | 47,127,000 | 719,213 | 418,679 | 300,534 | 15.2 | 8.9 | 6.4 | 2.10 | 1,130,315 | ||
| 1971 | 47,507,000 | 736,691 | 424,717 | 311,974 | 15.4 | 8.9 | 6.6 | 2.12 | |||
| 1972 | 47,903,000 | 745,696 | 443,038 | 302,658 | 15.5 | 9.2 | 6.3 | 2.08 | |||
| 1973 | 48,274,000 | 719,560 | 449,351 | 270,209 | 14.9 | 9.3 | 5.6 | 2.04 | |||
| 1974 | 48,571,000 | 736,616 | 455,970 | 280,646 | 15.1 | 9.4 | 5.8 | 2.04 | |||
| 1975 | 48,881,000 | 738,857 | 489,550 | 249,307 | 15.1 | 10.0 | 5.1 | 2.02 | 1,110,223 | ||
| 1976 | 49,151,000 | 747,069 | 500,584 | 246,485 | 15.2 | 10.2 | 5.0 | 1.99 | |||
| 1977 | 49,388,000 | 726,217 | 517,967 | 208,250 | 14.7 | 10.5 | 4.2 | 1.94 | |||
| 1978 | 49,578,000 | 732,187 | 529,681 | 202,506 | 14.7 | 10.7 | 4.1 | 1.96 | |||
| 1979 | 49,755,000 | 735,188 | 552,019 | 183,169 | 14.7 | 11.1 | 3.7 | 1.96 | |||
| 1980 | 50,044,000 | 742,489 | 568,243 | 174,246 | 14.8 | 11.4 | 3.5 | 1.95 | 1,197,000 | ||
| 1981 | 50,222,000 | 733,183 | 568,789 | 164,394 | 14.6 | 11.3 | 3.3 | 1.93 | 1,112,734 | ||
| 1982 | 50,388,000 | 745,591 | 568,231 | 177,360 | 14.8 | 11.3 | 3.5 | 1.94 | 1,131,437 | ||
| 1983 | 50,573,000 | 807,111 | 583,496 | 223,615 | 16.0 | 11.6 | 4.4 | 2.11 | 1,125,686 | ||
| 1984 | 50,768,000 | 792,035 | 610,338 | 181,697 | 15.6 | 12.0 | 3.6 | 2.08 | 1,127,627 | ||
| 1985 | 50,941,000 | 762,775 | 617,548 | 145,227 | 15.0 | 12.1 | 2.9 | 2.02 | 1,179,000 | ||
| 1986 | 51,143,000 | 792,574 | 565,150 | 227,424 | 15.5 | 11.1 | 4.4 | 2.13 | 1,166,039 | ||
| 1987 | 51,373,000 | 760,851 | 586,387 | 174,464 | 14.8 | 11.4 | 3.4 | 2.07 | 1,168,136 | ||
| 1988 | 51,593,000 | 744,056 | 600,725 | 143,331 | 14.4 | 11.6 | 2.8 | 2.04 | 1,080,029 | ||
| 1989 | 51,770,000 | 690,981 | 600,590 | 90,391 | 13.3 | 11.6 | 1.7 | 1.92 | 1.78 | 2.33 | 1,058,414 |
| 1990 | 51,838,500 | 657,202 | 629,602 | 27,600 | 12.7 | 12.1 | 0.5 | 1.84 | 1.69 | 2.27 | 1,019,038 |
| 1991 | 51,944,400 | 630,813 | 669,960 | -39,147 | 12.1 | 12.9 | -0.8 | 1.78 | 1.60 | 2.29 | 957,022 |
| 1992 | 52,056,600 | 596,785 | 697,110 | -100,325 | 11.4 | 13.4 | -1.9 | 1.67 | 1.48 | 2.23 | 932,272 |
| 1993 | 52,244,100 | 557,467 | 741,662 | -184,195 | 10.7 | 14.2 | -3.5 | 1.56 | 1.37 | 2.08 | 860,996 |
| 1994 | 52,114,400 | 521,545 | 764,669 | -243,124 | 10.0 | 14.7 | -4.7 | 1.47 | 1.28 | 1.98 | 798,538 |
| 1995 | 51,728,400 | 492,861 | 792,587 | -299,726 | 9.6 | 15.4 | -5.8 | 1.40 | 1.21 | 1.88 | 740,172 |
| 1996 | 51,297,100 | 467,211 | 776,717 | -309,506 | 9.2 | 15.2 | -6.0 | 1.34 | 1.16 | 1.79 | 687,035 |
| 1997 | 50,818,400 | 442,581 | 754,151 | -311,570 | 8.7 | 14.9 | -6.1 | 1.27 | 1.10 | 1.70 | 596,740 |
| 1998 | 50,370,800 | 419,238 | 719,954 | -300,716 | 8.4 | 14.4 | -6.0 | 1.21 | 1.05 | 1.64 | 525,329 |
| 1999 | 49,918,100 | 389,208 | 739,170 | -349,962 | 7.8 | 14.9 | -7.0 | 1.13 | 0.97 | 1.53 | 495,760 |
| 2000 | 49,429,800 | 385,126 | 758,082 | -372,956 | 7.8 | 15.4 | -7.6 | 1.12 | 0.97 | 1.51 | 434,223 |
| 2001 | 48,923,200 | 376,478 | 745,952 | -369,474 | 7.7 | 15.3 | -7.6 | 1.08 | 0.95 | 1.41 | 369,750 |
| 2002 | 48,457,102 | 390,688 | 754,911 | -364,223 | 8.1 | 15.7 | -7.6 | 1.10 | 0.97 | 1.43 | 345,967 |
| 2003 | 48,003,463 | 408,589 | 765,408 | -356,819 | 8.5 | 16.0 | -7.4 | 1.17 | 1.07 | 1.45 | 315,835 |
| 2004 | 47,622,434 | 427,259 | 761,261 | -334,002 | 9.0 | 16.0 | -7.0 | 1.22 | 1.13 | 1.46 | 289,065 |
| 2005 | 47,280,817 | 426,086 | 781,961 | -355,875 | 9.0 | 16.6 | -7.5 | 1.21 | 1.12 | 1.46 | 263,950 |
| 2006 | 46,929,525 | 460,368 | 758,092 | -297,724 | 9.8 | 16.2 | -6.3 | 1.31 | 1.21 | 1.59 | 229,618 |
| 2007 | 46,646,046 | 472,657 | 762,877 | -290,220 | 10.2 | 16.4 | -6.2 | 1.35 | 1.24 | 1.63 | 210,454 |
| 2008 | 46,372,664 | 510,589 | 754,460 | -243,871 | 11.0 | 16.3 | -5.3 | 1.46 | 1.35 | 1.75 | 217,413 |
| 2009 | 46,143,714 | 512,525 | 706,739 | -194,214 | 11.1 | 15.3 | -4.2 | 1.47 | 1.35 | 1.78 | 194,845 |
| 2010 | 45,962,947 | 497,689 | 698,235 | -200,546 | 10.8 | 15.2 | -4.4 | 1.44 | 1.31 | 1.77 | 176,774 |
| 2011 | 45,778,534 | 502,595 | 664,588 | -161,993 | 11.0 | 14.5 | -3.5 | 1.46 | 1.32 | 1.80 | 169,131 |
| 2012 | 45,633,637 | 520,705 | 663,139 | -142,434 | 11.4 | 14.5 | -3.1 | 1.53 | 1.39 | 1.87 | 153,147 |
| 2013 | 45,553,047 | 503,657 | 662,368 | -158,711 | 11.1 | 14.6 | -3.5 | 1.51 | 1.37 | 1.83 | 147,736 |
| 2014 | 45,426,249 | 465,882 | 632,296 | -166,414 | 10.3 | 14.0 | -3.7 | 1.50 | 1.35 | 1.83 | 116,104 |
| 2015 | 42,929,298 | 411,781 | 594,796 | -183,015 | 9.6 | 13.9 | -4.3 | 1.51 | 1.39 | 1.71 | 106,357 |
| 2016 | 42,760,516 | 397,037 | 583,631 | -186,594 | 9.3 | 13.6 | -4.3 | 1.47 | 1.36 | 1.64 | 101,121 |
| 2017 | 42,584,542 | 363,987 | 574,123 | -210,136 | 8.5 | 13.5 | -5.0 | 1.37 | 1.28 | 1.52 | 94,665 |
| 2018 | 42,386,403 | 335,874 | 587,665 | -251,791 | 7.9 | 13.9 | -6.0 | 1.30 | 1.22 | 1.43 | 46,552 |
| 2019 | 42,153,201 | 308,817 | 581,114 | -272,297 | 7.3 | 13.8 | -6.5 | 1.23 | 1.16 | 1.34 | 74,606 |
| 2020 | 41,902,416 | 293,457 | 616,835 | -323,378 | 7.0 | 14.7 | -7.7 | 1.22 | 1.13 | 1.36 | |
| 2021 | 41,167,336 | 271,983 | 714,263 | -442,280 | 6.6 | 17.4 | -10.8 | 1.16 | 1.08 | 1.29 | |
| 2022[43] | 35,100,000(e) | 209,400 | 541,739 | -332,339 | 6.0 | 15.4 | -9.4 | ||||
| 2023 | 34,744,634 | 187,387 | 496,200 | -308,813 | 5.4 | 15.2 | -9.8 | 1.00 |
| Urban live births | Urban deaths | Urban natural change | Urban crude birth rate (per 1,000) | Urban crude death rate (per 1,000) | Urban natural change (per 1,000) | Rural live births | Rural deaths | Rural natural change | Rural crude birth rate (per 1,000) | Rural crude death rate (per 1,000) | Rural natural change (per 1,000) | |
|---|---|---|---|---|---|---|---|---|---|---|---|---|
| 1990 | 442,869 | 357,114 | 85,755 | 12.7 | 10.2 | 2.5 | 214,333 | 272,488 | −58,155 | 12.7 | 16.1 | −3.4 |
| 1991 | 419,205 | 380,988 | 38,217 | 11.9 | 10.8 | 1.1 | 211,608 | 288,972 | −77,364 | 12.6 | 17.2 | −4.6 |
| 1992 | 387,696 | 401,849 | −14,153 | 11.0 | 11.4 | −0.4 | 209,089 | 295,261 | −86,172 | 12.5 | 17.6 | −5.1 |
| 1993 | 356,833 | 432,462 | −75,629 | 10.1 | 12.2 | −2.1 | 200,634 | 309,200 | −108,566 | 12.0 | 18.5 | −6.5 |
| 1994 | 328,522 | 450,823 | −122,301 | 9.3 | 12.8 | −3.5 | 193,023 | 313,846 | −120,823 | 11.6 | 18.8 | −7.2 |
| 1995 | 308,408 | 476,434 | −168,026 | 8.8 | 13.6 | −4.8 | 184,453 | 316,153 | −131,700 | 11.1 | 19.1 | −8.0 |
| 1996 | 291,121 | 460,805 | −169,684 | 8.4 | 13.3 | −4.9 | 176,090 | 315,912 | −139,822 | 10.7 | 19.2 | −8.5 |
| 1997 | 274,961 | 444,446 | −169,485 | 8.0 | 13.0 | −5.0 | 167,620 | 309,705 | −142,085 | 10.2 | 18.9 | −8.7 |
| 1998 | 258,724 | 425,521 | −166,797 | 7.6 | 12.6 | −5.0 | 160,514 | 294,433 | −133,919 | 9.9 | 18.1 | −8.2 |
| 1999 | 239,408 | 439,986 | −200,578 | 7.1 | 13.1 | −6.0 | 149,800 | 299,184 | −149,384 | 9.3 | 18.5 | −9.2 |
| 2000 | 238,014 | 457,069 | −219,055 | 7.2 | 13.8 | −6.6 | 147,112 | 301,013 | −153,901 | 9.2 | 18.8 | −9.6 |
| 2001 | 237,228 | 450,329 | −213,101 | 7.2 | 13.8 | −6.6 | 139,250 | 295,623 | −156,373 | 8.7 | 18.6 | −9.9 |
| 2002 | 248,877 | 454,406 | −205,529 | 7.7 | 14.0 | −6.3 | 141,811 | 300,505 | −158,694 | 9.0 | 19.1 | −10.1 |
| 2003 | 266,415 | 459,965 | −193,550 | 8.3 | 14.3 | −6.0 | 142,174 | 305,443 | −163,269 | 9.1 | 19.6 | −10.5 |
| 2004 | 284,361 | 460,492 | −176,131 | 8.9 | 14.4 | −5.5 | 142,898 | 300,769 | −157,871 | 9.3 | 19.6 | −10.3 |
| 2005 | 284,257 | 471,561 | −187,304 | 8.9 | 14.8 | −5.9 | 141,829 | 310,400 | −168,571 | 9.4 | 20.5 | −11.1 |
| 2006 | 306,635 | 461,774 | −155,139 | 9.6 | 14.5 | −4.9 | 153,733 | 296,318 | −142,585 | 10.3 | 19.8 | −9.5 |
| 2007 | 314,065 | 466,253 | −152,188 | 9.9 | 14.7 | −4.8 | 158,592 | 296,624 | −138,032 | 10.7 | 20.1 | −9.4 |
| 2008 | 340,594 | 462,897 | −122,303 | 10.8 | 14.6 | −3.8 | 169,995 | 291,563 | −121,568 | 11.6 | 19.9 | −8.3 |
| 2009 | 339,497 | 432,294 | −92,797 | 10.8 | 13.7 | −2.9 | 173,028 | 274,445 | −101,417 | 11.9 | 18.9 | −7.0 |
| 2010 | 326,587 | 431,130 | −104,543 | 10.4 | 13.7 | −3.3 | 171,102 | 267,105 | −96,003 | 11.9 | 18.6 | −6.7 |
| 2011 | 328,934 | 411,025 | −82,091 | 10.5 | 13.1 | −2.6 | 173,661 | 253,563 | −79,902 | 12.1 | 17.7 | −5.6 |
| 2012 | 341,599 | 411,787 | −70,188 | 10.9 | 13.1 | −2.2 | 179,106 | 251,352 | −72,246 | 12.6 | 17.7 | −5.1 |
| 2013 | 330,284 | 412,553 | −82,269 | 10.5 | 13.2 | −2.7 | 173,373 | 249,815 | −76,442 | 12.3 | 17.7 | −5.4 |
| 2014 | 304,190 | 391,739 | −87,549 | 10.2 | 13.2 | −3.0 | 161,692 | 240,557 | −78,865 | 12.2 | 18.1 | −5.9 |
| 2015 | 266,082 | 358,749 | −92,667 | 10.4 | 13.2 | −2.8 | 145,699 | 236,047 | −90,348 | 11.3 | 18.0 | −6.7 |
| 2016 | 258,688 | 354,634 | −95,946 | 10.0 | 13.2 | −3.2 | 138,349 | 228,997 | −90,648 | 10.8 | 17.6 | −6.8 |
| 2017 | 237,874 | 350,549 | −112,675 | 9.2 | 13.0 | −3.8 | 126,113 | 223,574 | −97,461 | 9.9 | 17.3 | −7.4 |
| 2018 | 220,102 | 363,732 | −143,630 | 8.5 | 13.4 | −4.9 | 115,772 | 223,933 | −108,161 | 9.2 | 17.5 | −8.3 |
| 2019 | 202,646 | 362,660 | −160,014 | 7.9 | 13.4 | −5.5 | 106,171 | 218,454 | −112,283 | 8.5 | 17.2 | −8.7 |
Note: Data excludes Crimea starting in 2014.[44]
Current vital statistics
| Period | Live births | Deaths | Natural increase |
|---|---|---|---|
| January 2021 | 21,931 | 57,721 | −35,790 |
| January 2022 | 18,062 | 57,248 | −39,186 |
| Difference |
Note: Russia occupied and later annexed the Crimean Peninsula in 2014. The annexation is internationally recognized only by a small number of nations. The Ukrainian statistics Service can no longer provide accurate data on Crimea in the post-2014 period. Therefore, starting from 2014, the territories of the Autonomous Republic of Crimea and the city of Sevastopol are not included in the Demographics of Ukraine, but instead are included to the Demographics of Russia. All data from State Statistics Service of Ukraine.
Structure of the population
| Age Group | Male | Female | Total | % |
|---|---|---|---|---|
| Total | 19 195 376 | 22 223 341 | 41 418 717 | 100 |
| 0–4 | 871 807 | 817 549 | 1 689 356 | 4.08 |
| 5–9 | 1 184 223 | 1 113 485 | 2 297 708 | 5.55 |
| 10–14 | 1 179 905 | 1 112 800 | 2 292 705 | 5.54 |
| 15–19 | 978 279 | 923 149 | 1 901 428 | 4.59 |
| 20–24 | 1 029 297 | 969 836 | 1 999 133 | 4.83 |
| 25–29 | 1 323 862 | 1 255 946 | 2 579 808 | 6.23 |
| 30–34 | 1 705 251 | 1 646 672 | 3 351 923 | 8.09 |
| 35–39 | 1 758 922 | 1 739 010 | 3 497 932 | 8.45 |
| 40–44 | 1 533 807 | 1 583 673 | 3 117 480 | 7.53 |
| 45–49 | 1 420 874 | 1 541 601 | 2 962 475 | 7.15 |
| 50–54 | 1 269 395 | 1 447 927 | 2 717 322 | 6.56 |
| 55–59 | 1 285 999 | 1 603 824 | 2 889 823 | 6.98 |
| 60–64 | 1 225 350 | 1 685 084 | 2 910 434 | 7.03 |
| 65-69 | 921 671 | 1 454 610 | 2 376 281 | 5.74 |
| 70-74 | 656 532 | 1 190 134 | 1 846 666 | 4.46 |
| 75-79 | 323 037 | 740 699 | 1 063 736 | 2.57 |
| 80-84 | 335 863 | 874 371 | 1 210 234 | 2.92 |
| 85-89 | 113 869 | 308 482 | 422 351 | 1.02 |
| 90-94 | 54 945 | 164 392 | 219 337 | 0.53 |
| 95-99 | 15 892 | 37 973 | 53 865 | 0.13 |
| 100+ | 6 596 | 12 124 | 18 720 | 0.05 |
| Age group | Male | Female | Total | Percent |
| 0–14 | 3 235 935 | 3 043 834 | 6 279 769 | 15.16 |
| 15–64 | 13 531 036 | 14 396 722 | 27 927 758 | 67.43 |
| 65+ | 2 428 405 | 4 782 785 | 7 211 190 | 17.41 |
Regional data
Population by oblast

| Name of Oblast | Population as of Dec 2021 |
|---|---|
| 4,062,839 | |
| 3,100,320 | |
| 2,952,577 | |
| 2,602,207 | |
| 2,480,137 | |
| 2,352,648 | |
| 2,104,531 | |
| 1,795,099 | |
| 1,640,876 | |
| 1,511,574 | |
| 1,354,444 | |
| 1,352,973 | |
| 1,245,491 | |
| 1,230,507 | |
| 1,180,638 | |
| 1,162,439 | |
| 1,142,599 | |
| 1,093,492 | |
| 1,037,237 | |
| 1,022,625 | |
| 1,022,107 | |
| 1,002,923 | |
| 961,054 | |
| 905,715 | |
| 891,054 | |
| 41,208,106 |
Birth data by oblast
Note: Recent data for Donetsk and Luhansk Oblasts has been affected by the war in Donbas, and may only include births within the government-held parts of the oblasts.[46]
| Number of births by oblast for January–November | Birth/2016 | Birth/2015 | Death/2016 | Death/2015 |
|---|---|---|---|---|
| 33416 |
32382 |
27772 |
27767 | |
| 28473 |
30620 |
47934 |
49258 | |
| 25708 |
25007 |
29247 |
30010 | |
| 24246 |
25182 |
30479 |
31512 | |
| 21992 |
22864 |
38502 |
38965 | |
| 17772 |
15608 |
33464 |
36883 | |
| 17559 |
18485 |
25623 |
26046 | |
| 14862 |
15525 |
13880 |
14164 | |
| 14454 |
14809 |
13261 |
13426 | |
| 14430 |
15140 |
25533 |
25657 | |
| 14153 |
15126 |
22521 |
23237 | |
| 13547 |
14412 |
15616 |
16144 | |
| 12047 |
12307 |
12311 |
12602 | |
| 11958 |
12526 |
18301 |
19085 | |
| 11793 |
12768 |
18097 |
18702 | |
| 11503 |
12381 |
22084 |
22440 | |
| 9904 |
10626 |
15834 |
16316 | |
| 9877 |
10476 |
14891 |
15055 | |
| 9721 |
10560 |
18437 |
18315 | |
| 9461 |
9851 |
10399 |
10738 | |
| 9177 |
9912 |
13584 |
13962 | |
| 8189 |
8662 |
14810 |
14809 | |
| 8169 |
8959 |
16982 |
17322 | |
| 7816 |
8359 |
17515 |
18199 | |
| 5960 |
4978 |
12689 |
13401 |
| Number of births by oblast | Birth/2014 | Birth/2013 | Birth/2012 | Birth/2011 | Death/2014 | Death/2013 | Death/2012 | Death/2011 |
|---|---|---|---|---|---|---|---|---|
| 36497 |
36134 |
37087 |
36116 |
52722 |
51134 |
51486 |
52106 | |
| 35595 |
41034 |
42839 |
41720 |
71799 |
69345 |
70496 |
71042 | |
| 34821 |
33305 |
33887 |
32068 |
29992 |
28003 |
27840 |
27050 | |
| 30270 |
29542 |
30220 |
28904 |
32450 |
31666 |
31667 |
31162 | |
| 29465 |
29075 |
30384 |
29225 |
34155 |
33523 |
33648 |
33688 | |
| 27690 |
26700 |
27244 |
26317 |
41891 |
39465 |
40130 |
40079 | |
| 20900 |
20511 |
20966 |
20083 |
28264 |
27198 |
27161 |
26847 | |
| 18713 |
18134 |
18882 |
18198 |
27773 |
26498 |
26406 |
27033 | |
| 18377 |
18490 |
18968 |
18460 |
14808 |
14801 |
14813 |
14588 | |
| 17547 |
17437 |
18339 |
17894 |
25567 |
25453 |
25158 |
25376 | |
| 17169 |
17445 |
18316 |
17697 |
14714 |
14556 |
14302 |
14168 | |
| 16886 |
16716 |
17101 |
16497 |
17670 |
17358 |
16801 |
16657 | |
| 15115 |
15001 |
15486 |
15154 |
21185 |
20859 |
20685 |
20417 | |
| 14668 |
14700 |
15346 |
14620 |
13748 |
13666 |
13710 |
13842 | |
| 14631 |
14548 |
14881 |
14492 |
20408 |
20581 |
20362 |
20116 | |
| 14504 |
14296 |
14635 |
14167 |
24784 |
24358 |
24223 |
24384 | |
| 13076 |
13043 |
13515 |
13029 |
17750 |
17353 |
17277 |
17441 | |
| 12351 |
12100 |
12798 |
12473 |
20800 |
20477 |
20667 |
20848 | |
| 12308 |
12300 |
12643 |
12085 |
16141 |
16048 |
15904 |
15828 | |
| 11717 |
11807 |
12202 |
11964 |
15180 |
14682 |
14838 |
14829 | |
| 11679 |
11465 |
11592 |
11281 |
11619 |
11520 |
11321 |
11192 | |
| 11442 |
20531 |
21743 |
21320 |
22755 |
35822 |
36316 |
37256 | |
| 10576 |
10562 |
11029 |
10578 |
16716 |
16513 |
16521 |
16697 | |
| 10344 |
10411 |
11093 |
10473 |
19452 |
19219 |
19002 |
18833 | |
| 9552 |
9852 |
10222 |
10134 |
20324 |
19909 |
20208 |
20179 |
| Birth rate by oblast | Birth/2014 | Birth/2013 | Birth/2012 | Birth/2011 | Death/2014 | Death/2013 | Death/2012 | Death/2011 |
|---|---|---|---|---|---|---|---|---|
| 14.8 |
15.1 |
15.9 |
15.3 |
12.7 |
12.6 |
12.4 |
12.3 | |
| 14.6 |
14.7 |
15.1 |
14.8 |
11.8 |
11.8 |
11.8 |
11.7 | |
| 14.1 |
14.1 |
14.8 |
14.1 |
13.2 |
13.1 |
13.2 |
13.3 | |
| 12.9 |
12.6 |
12.8 |
12.5 |
12.8 |
12.7 |
12.5 |
12.4 | |
| 12.3 |
12.1 |
12.7 |
12.2 |
14.3 |
14.0 |
14.1 |
14.1 | |
| 12.2 |
12.1 |
12.4 |
12.0 |
12.8 |
12.6 |
12.2 |
12.1 | |
| 12.1 |
11.9 |
12.2 |
11.7 |
16.4 |
15.8 |
15.8 |
15.6 | |
| 12.1 |
11.7 |
12.0 |
11.4 |
10.4 |
9.8 |
9.8 |
9.6 | |
| 12.0 |
11.9 |
12.2 |
11.9 |
16.8 |
16.5 |
16.3 |
16.0 | |
| 11.9 |
11.6 |
11.9 |
11.4 |
12.8 |
12.4 |
12.5 |
12.3 | |
| 11.5 |
11.4 |
11.7 |
11.1 |
15.1 |
14.9 |
14.7 |
14.6 | |
| 11.2 |
11.1 |
11.5 |
11.0 |
15.2 |
14.8 |
14.7 |
14.8 | |
| 11.2 |
11.1 |
11.3 |
11.0 |
15.6 |
15.7 |
15.5 |
15.2 | |
| 11.1 |
11.0 |
11.2 |
10.9 |
16.0 |
15.5 |
15.5 |
15.7 | |
| 10.9 |
10.8 |
11.2 |
10.9 |
15.9 |
15.7 |
15.4 |
15.5 | |
| 10.9 |
11.0 |
11.3 |
11.1 |
14.2 |
13.7 |
13.8 |
13.7 | |
| 10.8 |
10.7 |
11.0 |
10.5 |
17.0 |
16.7 |
16.5 |
16.6 | |
| 10.6 |
10.2 |
10.6 |
10.1 |
15.7 |
14.9 |
14.8 |
15.0 | |
| 10.1 |
9.8 |
9.9 |
9.6 |
15.3 |
14.4 |
14.6 |
14.6 | |
| 10.0 |
9.8 |
9.9 |
9.5 |
17.1 |
16.7 |
16.5 |
16.4 | |
| 9.8 |
9.6 |
10.1 |
9.8 |
16.5 |
16.2 |
16.2 |
16.3 | |
| 9.2 |
9.2 |
9.7 |
9.1 |
17.2 |
16.9 |
16.6 |
16.3 | |
| 9.0 |
9.2 |
9.4 |
9.3 |
19.2 |
18.6 |
18.7 |
18.5 | |
| 8.2 |
9.4 |
9.8 |
9.5 |
16.6 |
15.9 |
16.1 |
16.1 | |
| 5.1 |
9.1 |
9.6 |
9.3 |
10.2 |
15.9 |
16.0 |
16.3 |
Year in review 2013
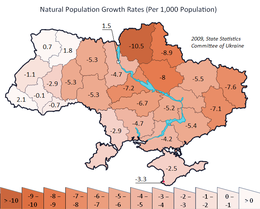
Compared to 2012, amount of attrition increased by 16,278 persons, or 3.1 to 3.5 persons per 1,000 inhabitants real. Natural decrease was observed in 23 oblasts of the country, while natural increases were recorded only in the capital Kyiv, Zakarpattya, Rivne and Volyn oblast (respectively 5,302, 3,689, 2,889 and 1,034 people).
Some regions registered a low natural decline, such as Chernivtsi, Ivano-Frankivsk, Sevastopol, Lviv, Ternopil, Crimea, Kherson and Odesa (respectively, −55, −642, −863, −2,124, −2,875, −2,974, −3,748 and −4,448 people). The largest declines were recorded in Donetsk, Luhansk, Dnipro, Kharkiv, Poltava and Chernihiv (respectively −28,311, −15,291, −15,007, −12,765, −10,062 and −10,057), regions which have in common a low birth rate and high mortality of a large urban population and a strong rural population aging.
Net migration rate
-5.4 migrant(s)/1,000 population (2015).
Infant mortality rate
- 9.1
 deaths/1,000 infants live births for 4,564 deaths. (2010)
 - 9.0 deaths/1,000 infants live births for 4,511 deaths. (2011)
- 8.4 deaths/1,000 infants live births for 4,371 deaths. (2012)
- 8.0 deaths/1,000 infants live births for 4,030 deaths. (2013)
- 8.9
 deaths/1,000 infants live births for 2,193 death for January–June 2011
 - 8.6 deaths/1,000 infants live births for 2,190 death for January–June 2012
- 7.8 deaths/1,000 infants live births for 1,993 deaths for January–June 2013[47]
| Infant mortality by oblast | Death/2012 | Death/2011 | Death/2010 | Death/2009 |
|---|---|---|---|---|
| 540 |
473 |
497 |
533 | |
| 370 |
343 |
347 |
329 | |
| 267 |
268 |
263 |
280 | |
| 262 |
255 |
233 |
244 | |
| 233 |
272 |
266 |
238 | |
| 203 |
234 |
243 |
252 | |
| 168 |
195 |
199 |
238 | |
| 166 |
186 |
148 |
149 | |
| 165 |
188 |
199 |
252 | |
| 154 |
169 |
182 |
174 | |
| 147 |
156 |
158 |
164 | |
| 134 |
89 |
109 |
174 | |
| 124 |
134 |
135 |
127 | |
| 122 |
101 |
125 |
132 | |
| 119 |
143 |
140 |
146 | |
| 109 |
145 |
170 |
157 | |
| 106 |
116 |
123 |
118 | |
| 103 |
139 |
112 |
119 | |
| 100 |
120 |
116 |
136 | |
| 97 |
97 |
104 |
112 | |
| 97 |
96 |
98 |
93 | |
| 94 |
80 |
82 |
103 | |
| 92 |
96 |
90 |
91 | |
| 85 |
86 |
87 |
105 | |
| 76 |
78 |
97 |
91 |
| Infant mortality per 1,000 by Oblast | Death/2012 | Death/2011 | Death/2010 | Death/2009 |
|---|---|---|---|---|
| 12.7 |
11.4 |
12.0 |
12.3 | |
| 10.0 |
9.5 |
9.7 |
8.8 | |
| 9.6 |
8.1 |
10.0 |
10.5 | |
| 9.4 |
13.2 |
10.6 |
10.9 | |
| 9.2 |
7.9 |
8.1 |
9.9 | |
| 9.1 |
10.4 |
8.4 |
8.3 | |
| 9.0 |
6.2 |
7.5 |
11.8 | |
| 8.9 |
10.6 |
10.9 |
13.1 | |
| 8.8 |
9.2 |
9.2 |
9.7 | |
| 8.2 |
9.3 |
10.1 |
9.4 | |
| 8.1 |
8.9 |
9.2 |
9.4 | |
| 8.0 |
9.9 |
9.4 |
11.0 | |
| 8.0 |
8.9 |
9.1 |
8.5 | |
| 8.0 |
8.5 |
8.2 |
8.2 | |
| 8.0 |
8.0 |
8.2 |
7.5 | |
| 7.8 |
9.4 |
9.2 |
8.0 | |
| 7.8 |
8.0 |
7.3 |
7.5 | |
| 7.6 |
8.8 |
9.4 |
11.6 | |
| 7.5 |
8.9 |
9.2 |
9.3 | |
| 7.3 |
7.5 |
8.1 |
8.5 | |
| 7.0 |
7.9 |
8.2 |
7.7 | |
| 6.9 |
7.5 |
9.3 |
8.5 | |
| 6.4 |
8.8 |
10.3 |
9.1 | |
| 5.8 |
6.1 |
6.1 |
7.1 | |
| 5.7 |
7.2 |
7.0 |
7.1 |
Total fertility rate by oblast
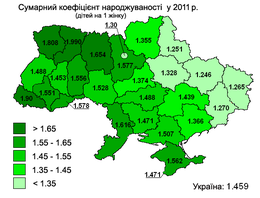
Although none of the oblasts in 2013 has recorded a higher fertility rate 2.10 children per woman. However, the rate has been in rural areas in the Rivne Oblast (2.50) and the Volyn Oblast (2.20). While a very close generational renewal rate was achieved in the Odesa Oblast (2.04), Zakarpattia Oblast (2.00), Mykolaiv Oblast (1.95), Chernivtsi Oblast (1.93) and Zhytomyr Oblast (1.91) weaker when they have been recorded in the Luhansk oblast (1.41), Sumy oblast (1.47) and Cherkasy Oblast (1.53).
The fertility rate of the highest urban areas were recorded in the Zakarpattia Oblast (1.80), the city of Sevastopol (1.57), Volyn Oblast (1.56), Kyiv Oblast (1.56) and the Rivne Oblast (1.54). The lowest rates were recorded in the Sumy Oblast (1.23), Kharkiv Oblast (1.26), Cherkasy Oblast (1.28), Chernihiv Oblast (1.28), Chernivtsi Oblast (1.28), Luhansk oblast (1.28), Poltava oblast (1.29), Donetsk oblast (1.29) and Zaporizhzhia Oblast (1.32).
| Children born per woman by oblast | Total fertility rate/2020 | Total fertility rate/2012 | Total fertility rate/2011 | Total fertility rate/2010 |
|---|---|---|---|---|
| 1.54 |
2.08 |
1.99 |
1.93 | |
| 1.60 |
1.95 |
1.90 |
1.83 | |
| 1.51 |
1.92 |
1.81 |
1.85 | |
| 1.20 |
1.71 |
1.65 |
1.61 | |
| 1.34 |
1.71 |
1.62 |
1.58 | |
| 1.18 |
1.67 |
1.58 |
1.58 | |
| 1.30 |
1.64 |
1.58 |
1.53 | |
| 1.26 |
1.62 |
1.56 |
1.55 | |
| 1.27 |
1.63 |
1.55 |
1.58 | |
| 1.20 |
1.61 |
1.51 |
1.51 | |
| 1.10 |
1.61 |
1.51 |
1.50 | |
| 1.24 |
1.58 |
1.49 |
1.50 | |
| 1.11 |
1.57 |
1.47 |
1.44 | |
| 1.20 |
1.59 |
1.53 |
1.50 | |
| 1.22 |
1.53 |
1.46 |
1.45 | |
| 1.09 |
1.52 |
1.44 |
1.43 | |
| 1.13 |
1.50 |
1.45 |
1.46 | |
| 1.03 |
1.46 |
1.37 |
1.34 | |
| 1.04 |
1.41 |
1.33 |
1.34 | |
| 1.01 |
1.43 |
1.37 |
1.36 | |
| 1.02 |
1.40 |
1.36 |
1.36 | |
| 1.44 |
1.38 |
1.29 |
1.30 | |
| 1.34 |
1.27 |
1.26 | ||
| 0.98 |
1.32 |
1.25 |
1.24 | |
| 0.93 |
1.36 |
1.25 |
1.23 | |
| 1.33 |
1.27 |
1.23 |
Other demographics statistics

Demographic statistics according to the World Population Review in 2019.[48]
- One birth every 1 minute
- One death every 48 seconds
- Net loss of one person every 2 minutes
- One net migrant every 30 minutes
Demographic statistics according to the CIA World Factbook, unless otherwise indicated.[29]
- Age structure:
- 0-14 years: 15.95% (male 3,609,386 /female 3,400,349)
- 15-24 years: 9.57% (male 2,156,338 /female 2,047,821)
- 25-54 years: 44.03% (male 9,522,108 /female 9,831,924)
- 55-64 years: 13.96% (male 2,638,173 /female 3,499,718)
- 65 years and over: 16.49% (male 2,433,718 /female 4,812,764) (2018 est.)
- 0-14 years: 15.76% (male 3,571,358/female 3,366,380)
- 15-24 years: 9.86% (male 2,226,142/female 2,114,853)
- 25-54 years: 44.29% (male 9,579,149/female 9,921,387)
- 55-64 years: 13.8% (male 2,605,849/female 3,469,246)
- 65 years and over: 16.3% (male 2,409,049/female 4,770,461) (2017 est.)
- 0–14 years: 15.1% = 6,449,171 (2015 official.)
- 15–64 years: 69.3% = 29,634,710
- 65 years and over: 15.6% = 6,675,780
- 0–14 years: 14.8% = 6,989,802
- 15–64 years: 69.2% = 32,603,475
- 65 years and over: 16.0% = 7,507,185 (2005 official.)
- 0–14 years: 21.6% = 11,101,469
- 15–64 years: 66.7% = 34,320,742
- 65 years and over: 11.7% = 6,022,934 (1989 official.)
- Median age
- total: 40.8 years. Country comparison to the world: 47th
- male: 37.7 years
- female: 43.9 years (2018 est.)
- total: 40.6 years
- male: 37.4 years
- female: 43.7 years (2017 est.)
- total: 39.8 years
- male: 39.7 years
- female: 40.1 years (2014 official)
- total: 39.7 years
- male: 39.5 years
- female: 40.1 years (2013 official)
- total: 34.8 years
- male: 31.9 years
- female: 37.7 years (1989 official)
- Birth rate
- 10.1 births/1,000 population (2018 est.) Country comparison to the world: 190th
- 10.3 births/1,000 population (2017 est.)
- Death rate
- 14.3 deaths/1,000 population (2018 est.) Country comparison to the world: 6th
- 14.4 deaths/1,000 population (2017 est.)
- Total fertility rate
- 1.55 children born/woman (2018 est.) Country comparison to the world: 190th
- 1.54 children born/woman (2017 est.)
- Net migration rate
- 4.6 migrant(s)/1,000 population (2018 est.) Country comparison to the world: 29th
- 0 migrant(s)/1,000 population (2017 est.)
- Mother's mean age at first birth
- 24.9 years (2014 est.)
- Population growth rate
- 0.04% (2018 est.) Country comparison to the world: 187th
- -0.41% (2017 est.)
- Life expectancy at birth
- total population: 72.4 years. Country comparison to the world: 148th
- male: 67.7 years
- female: 77.4 years (2018 est.)
- Ethnic groups
Ukrainian 77.8%, Russian 17.3%, Belarusian 0.6%, Moldovan 0.5%, Crimean Tatar 0.5%, Bulgarian 0.4%, Hungarian 0.3%, Romanian 0.3%, Polish 0.3%, Jewish 0.2%, other 1.8% (2001 est.)
- Languages
Ukrainian (official) 67.5%, Russian (regional language) 29.6%, other (includes small Crimean Tatar-, Moldovan/Romanian-, and Hungarian-speaking minorities) 2.9% (2001 est.)
Note: in February 2018, the Constitutional Court ruled that 2012 language legislation entitling a language spoken by at least 10% of an oblast's population to be given the status of "regional language" – allowing for its use in courts, schools, and other government institutions – was unconstitutional, thus making the law invalid; Ukrainian remains the country's only official nationwide language.
- Religions
Orthodox (includes Ukrainian Autocephalous Orthodox (UAOC), Ukrainian Orthodox – Kyiv Patriarchate (UOC-KP), Ukrainian Orthodox – Moscow Patriarchate (UOC-MP)), Ukrainian Greek Catholic, Roman Catholic, Protestant, Muslim, Jewish
Note: Ukraine's population is overwhelmingly Christian; the vast majority – up to two-thirds – identify themselves as Orthodox, but many do not specify a particular branch; the UOC-KP and the UOC-MP each represent less than a quarter of the country's population, the Ukrainian Greek Catholic Church accounts for 8–10%, and the UAOC accounts for 1–2%; Muslim and Jewish adherents each compose less than 1% of the total population (2013 est.)
- Dependency ratios
- total dependency ratio: 44.8 (2015 est.)
- youth dependency ratio: 21.8 (2015 est.)
- elderly dependency ratio: 23 (2015 est.)
- potential support ratio: 4.3 (2015 est.)
- note: data include Crimea
- Urbanization
- urban population: 69.4% of total population (2018)
- rate of urbanization: -0.33% annual rate of change (2015–20 est.)
- Literacy
definition: age 15 and over can read and write (2015 est.)
- total population: 99.8%
- male: 99.8%
- female: 99.7% (2015 est.)
- School life expectancy (primary to tertiary education)
- total: 15 years
- male: 15 years
- female: 16 years (2014)
- Unemployment, youth ages 15–24
- total: 23%. Country comparison to the world: 53rd
- male: 24%
- female: 21.5% (2016 est.)
Statistic rate of regional capitals
| Birth rate in
regional centers |
Birth/2012 | Birth/2011 | Birth/2010 | Birth/2009 | Birth/2007 | Birth/2005 | Birth/2003 |
|---|---|---|---|---|---|---|---|
| Simferopol | 13.6 |
12.8 |
11.8 |
11.8 |
11.0 |
9.5 |
9.2 |
| Lutsk | 12.6 |
12.3 |
12.6 |
13.9 |
12.6 |
11.7 |
10.0 |
| Rivne | 12.6 |
12.0 |
11.8 |
12.3 |
10.9 |
10.1 |
9.4 |
| Uzhhorod | 12.1 |
11.9 |
12.0 |
12.4 |
12.8 |
12.6 |
10.8 |
| Kyiv | 12.0 |
11.4 |
11.5 |
11.7 |
10.4 |
9.8 |
8.8 |
| Khmelnytskyi | 12.0 |
11.2 |
11.8 |
11.5 |
10.4 |
10.2 |
9.2 |
| Sevastopol | 12.0 |
11.1 |
11.0 |
11.2 |
10.5 |
9.6 |
8.7 |
| Kherson | 11.9 |
11.1 |
10.1 |
10.5 |
9.6 |
8.6 |
8.5 |
| Ternopil | 11.8 |
12.2 |
11.7 |
12.3 |
11.9 |
11.6 |
10.4 |
| Ivano-Frankivsk | 11.6 |
11.6 |
10.1 |
10.8 |
11.3 |
10.7 |
9.3 |
| Vinnytsia | 11.5 |
11.2 |
10.9 |
11.1 |
10.1 |
9.4 |
9.1 |
| Kropyvnytskyi | 11.5 |
11.1 |
10.5 |
11.3 |
10.5 |
8.9 |
8.4 |
| Zhytomyr | 11.4 |
11.5 |
10.8 |
11.7 |
10.6 |
9.5 |
8.7 |
| Sumy | 11.3 |
10.3 |
10.0 |
10.3 |
9.6 |
8.2 |
7.8 |
| Lviv | 11.0 |
10.4 |
10.0 |
10.5 |
9.7 |
9.3 |
9.0 |
| Ukraine Urban | 10.9 |
10.5 |
10.4 |
10.8 |
9.9 |
8.9 |
8.3 |
| Dnipro | 10.5 |
10.2 |
10.0 |
10.5 |
9.4 |
8.5 |
7.9 |
| Luhansk | 10.5 |
9.8 |
8.8 |
9.2 |
8.2 |
7.4 |
6.8 |
| Chernivtsi | 10.2 |
10.3 |
10.1 |
10.2 |
9.2 |
9.6 |
8.3 |
| Odesa | 10.1 |
9.8 |
9.6 |
9.9 |
9.0 |
8.3 |
7.5 |
| Cherkasy | 9.9 |
9.4 |
9.4 |
9.4 |
8.7 |
7.8 |
7.4 |
| Poltava | 9.9 |
9.1 |
8.8 |
9.7 |
8.4 |
7.8 |
7.3 |
| Zaporizhzhia | 9.5 |
9.2 |
9.2 |
9.3 |
8.9 |
8.2 |
7.5 |
| Mykolaiv | 9.4 |
9.3 |
9.1 |
9.4 |
8.7 |
8.0 |
7.9 |
| Chernihiv | 9.3 |
9.2 |
9.1 |
9.6 |
8.4 |
8.0 |
7.6 |
| Kharkiv | 9.2 |
8.9 |
8.8 |
9.2 |
8.4 |
7.6 |
7.1 |
| Donetsk | 9.1 |
8.7 |
8.6 |
9.0 |
8.2 |
7.5 |
6.6 |
| Death rate in
regional centers |
Death/2012 | Death/2011 | Death/2010 | Death/2009 | Death/2007 | Death/2005 | Death/2003 |
|---|---|---|---|---|---|---|---|
| Kherson | 15.2 |
15.6 |
14.0 |
14.2 |
14.9 |
14.8 |
14.5 |
| Luhansk | 14.2 |
14.3 |
13.6 |
13.4 |
13.8 |
14.2 |
14.1 |
| Simferopol | 14.0 |
14.8 |
13.6 |
13.8 |
15.3 |
15.3 |
15.2 |
| Sevastopol | 13.7 |
14.1 |
14.7 |
14.5 |
15.5 |
15.4 |
14.1 |
| Kropyvnytskyi | 13.7 |
13.7 |
13.8 |
14.0 |
14.4 |
14.1 |
14.1 |
| Dnipro | 13.5 |
13.7 |
14.1 |
13.8 |
15.1 |
15.1 |
16.0 |
| Donetsk | 13.4 |
13.5 |
14.0 |
13.9 |
15.2 |
15.4 |
14.7 |
| Zaporizhzhia | 13.2 |
13.4 |
14.2 |
13.8 |
15.0 |
14.7 |
14.2 |
| Ukraine Urban | 13.1 |
13.1 |
13.7 |
13.7 |
14.7 |
14.8 |
14.3 |
| Mykolaiv | 12.8 |
12.8 |
13.8 |
13.8 |
14.5 |
14.5 |
14.9 |
| Poltava | 12.8 |
12.6 |
13.2 |
13.0 |
13.7 |
13.6 |
13.6 |
| Sumy | 12.1 |
11.9 |
12.4 |
12.6 |
13.0 |
13.1 |
11.9 |
| Kharkiv | 12.0 |
11.8 |
12.4 |
12.2 |
13.1 |
13.1 |
13.0 |
| Odesa | 11.9 |
12.2 |
13.0 |
12.5 |
13.9 |
14.1 |
14.0 |
| Cherkasy | 11.2 |
10.7 |
11.3 |
11.2 |
11.7 |
11.7 |
11.0 |
| Chernihiv | 11.4 |
11.1 |
12.0 |
11.8 |
12.5 |
12.4 |
12.0 |
| Lviv | 11.0 |
10.8 |
10.5 |
10.8 |
11.5 |
11.4 |
11.5 |
| Zhytomyr | 10.7 |
10.9 |
11.2 |
11.1 |
12.0 |
12.2 |
11.4 |
| Uzhhorod | 10.3 |
10.2 |
10.5 |
11.3 |
12.0 |
12.4 |
10.3 |
| Kyiv | 9.8 |
9.6 |
10.3 |
10.2 |
11.4 |
11.2 |
10.7 |
| Lutsk | 9.6 |
9.4 |
9.6 |
9.1 |
10.4 |
10.2 |
10.5 |
| Chernivtsi | 9.5 |
9.4 |
9.9 |
10.3 |
11.0 |
11.0 |
10.8 |
| Khmelnytskyi | 9.4 |
8.8 |
9.0 |
9.5 |
9.8 |
9.8 |
9.2 |
| Vinnytsia | 9.1 |
9.0 |
9.2 |
9.2 |
10.2 |
10.2 |
10.0 |
| Ivano-Frankivsk | 9.1 |
8.7 |
8.2 |
8.5 |
9.1 |
9.3 |
9.3 |
| Ternopil | 8.1 |
7.6 |
8.1 |
7.7 |
8.5 |
8.5 |
7.7 |
| Rivne | 7.9 |
7.8 |
8.7 |
8.6 |
9.0 |
9.2 |
8.8 |
Ethnic groups
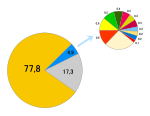
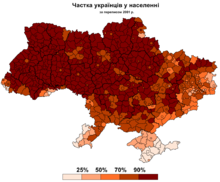
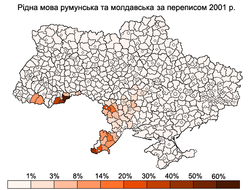
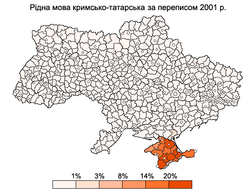
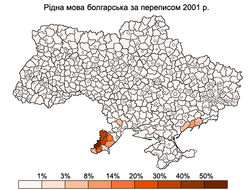
In 2001, the ethnic composition was: Ukrainians 77.8%, Russian 17.3%, Romanian 1.1% (including Moldovan 0.8%), Belarusian 0.6%, Crimean Tatar 0.5%, Bulgarian 0.4%, Hungarian 0.3%, Polish 0.3%, Jewish 1.0%, Pontic Greeks 0.2% and other 1.6% (including Muslim Bulgarians, otherwise known as Torbesh and a microcosm of Swedes of Gammalsvenskby).[49] It is also estimated that there are about 49,817 ethnic Koreans (0.12%) in Ukraine that belong to the Koryo-saram group. Their number may be as high as 100,000 as many ethnic Koreans were assimilated into the majority population.[50][51] Rusyns are also not recognised by the Ukrainian government as a distinct ethnic group and are instead treated as a sub-group of Ukrainians.[52]
According to the 2021 law “On the Indigenous Peoples of Ukraine” the Crimean Tatars, Crimean Karaites and Krymchaks are the indigenous peoples of Ukraine.[53]

Before World War II
| Ethnic group |
census 19261 | census 19392 | ||
|---|---|---|---|---|
| Number | % | Number | % | |
| Ukrainians | 23,218,860 | 80.0 | 23,667,509 | 76.5 |
| Russians | 2,677,166 | 9.2 | 4,175,299 | 13.5 |
| Jewish | 1,574,428 | 5.4 | 1,532,776 | 5.0 |
| Germans | 393,924 | 1.4 | 392,458 | 1.3 |
| Polish | 476,435 | 1.6 | 357,710 | 1.2 |
| Moldavians / Romanians | 257,794 | 0.9 | 230,698 | 0.8 |
| Belarusians | 75,842 | 0.3 | 158,174 | 0.5 |
| Pontic Greeks | 104,666 | 0.4 | 107,047 | 0.4 |
| Bulgarians | 99,278 | 0.3 | 83,838 | 0.3 |
| Tatars | 22,281 | 0.1 | 55,456 | 0.2 |
| Romani | 13,578 | 0.0 | 10,443 | 0.0 |
| Others | 103,935 | 0.4 | 174,810 | 0.6 |
| Total | 29,018,187 | 30,946,218 | ||
| 1 Source:.[54] | ||||
After World War II
| Ethnic group |
census 19591 | census 19702 | census 19793 | census 19894 | census 20015 | |||||
|---|---|---|---|---|---|---|---|---|---|---|
| Number | % | Number | % | Number | % | Number | % | Number | % | |
| Ukrainians | 32,158,493 | 76.8 | 35,283,857 | 74.9 | 36,488,951 | 73.6 | 37,419,053 | 72.7 | 37,541,693 | 77.5 |
| Russians | 7,090,813 | 16.9 | 9,126,331 | 19.4 | 10,471,602 | 21.1 | 11,355,582 | 22.1 | 8,334,141 | 17.2 |
| Romanians / Moldovans | 391,753 | 1.1 | 378,043 | 1.1 | 415,371 | 1.1 | 459,350 | 1.2 | 409,608 | 1.1 |
| Belarusians | 290,890 | 0.7 | 385,847 | 0.8 | 406,098 | 0.8 | 440,045 | 0.9 | 275,763 | 0.6 |
| Crimean Tatars | 193 | 0.0 | 3,554 | 0.0 | 6,636 | 0.0 | 46,807 | 0.1 | 248,193 | 0.5 |
| Bulgarians | 219,419 | 0.5 | 234,390 | 0.5 | 238,217 | 0.5 | 233,800 | 0.5 | 204,574 | 0.4 |
| Hungarians | 149,229 | 0.4 | 157,731 | 0.3 | 164,373 | 0.3 | 163,111 | 0.3 | 156,566 | 0.3 |
| Poles | 363,297 | 0.9 | 295,107 | 0.6 | 258,309 | 0.5 | 219,179 | 0.4 | 144,130 | 0.3 |
| Jewish | 840,311 | 2.0 | 777,126 | 1.7 | 634,154 | 1.3 | 486,628 | 1.0 | 103,591 | 0.2 |
| Armenians | 28,024 | 0.1 | 33,439 | 0.1 | 38,646 | 0.1 | 54,200 | 0.1 | 99,894 | 0.2 |
| Greeks | 104,359 | 0.3 | 106,909 | 0.2 | 104,091 | 0.2 | 98,594 | 0.2 | 91,548 | 0.2 |
| Tatars | 61,334 | 0.2 | 72,658 | 0.2 | 83,906 | 0.2 | 86,875 | 0.2 | 73,304 | 0.2 |
| Romani | 22,515 | 0.1 | 30,091 | 0.1 | 34,411 | 0.1 | 47,917 | 0.1 | 47,587 | 0.1 |
| Azerbaijanis | 6,680 | 0.0 | 10,769 | 0.0 | 17,235 | 0.0 | 36,961 | 0.1 | 45,176 | 0.1 |
| Georgians | 11,574 | 0.0 | 14,650 | 0.0 | 16,301 | 0.0 | 23,540 | 0.1 | 34,199 | 0.1 |
| Germans | 23,243 | 0.1 | 29,871 | 0.1 | 34,139 | 0.1 | 37,849 | 0.1 | 33,302 | 0.1 |
| Gagauz | 23,530 | 0.1 | 26,464 | 0.1 | 29,398 | 0.1 | 31,967 | 0.1 | 31,923 | 0.1 |
| Karaites | 3,301 | 0.0 | 2,596 | 0.0 | 1,845 | 0.0 | 1,404 | 0.0 | 1,196 | 0.0 |
| Others | 129,338 | 0.3 | 157,084 | 0.3 | 165,650 | 0.3 | 209,172 | 0.4 | 363,821 | 1.1 |
| Total | 41,869,046 | 47,126,517 | 49,609,333 | 51,452,034 | 48,240,902 | |||||
| 1 Source:.[55] 2 Source:.[56] 3 Source:.[57] 4 Source:.[58] 5 Source: [1]. | ||||||||||
Ethnic Groups in Ukraine 2001[59]
Languages
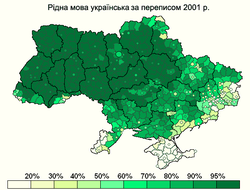
According to the 2001 census, the following languages are common in Ukraine: Ukrainian 67.5%, Russian 29.6%, Crimean Tatar, Urum (Turkic Greeks), Bulgarian, Moldovan/Romanian, Polish, Hungarian. The below table gives the total population of various ethnic groups in Ukraine and the primary language, according to the 2001 census.[49]
| Ethnic group | Population | Native | Ukrainian | Russian | Other |
|---|---|---|---|---|---|
| Ukrainians | 37,541,693 | 31,970,728 | – | 5,544,729 | 532 |
| Russians | 8,334,141 | 7,993,832 | 328,152 | – | 402 |
| Moldovans | 258,619 | 181,124 | 27,775 | 45,607 | 1242 |
| Belarusians | 275,763 | 54,573 | 48,202 | 172,251 | |
| Crimean Tatars | 248,193 | 228,373 | 184 | 15,208 | 43 |
| Bulgarians | 204,574 | 131,237 | 10,277 | 62,067 | 9 |
| Hungarians | 156,566 | 149,431 | 5,367 | 1,513 | 14 |
| Romanians | 150,989 | 138,522 | 9,367 | 2,297 | 170 |
| Polish | 144,130 | 18,660 | 102,268 | 22,495 | 390 |
| Hebrew | 103,591 | 3,213 | 13,924 | 85,964 | 16 |
| Armenians | 99,894 | 50,363 | 5,798 | 43,105 | 11 |
| Greeks | 91,548 | 5,829 | 4,359 | 80,992 | 9 |
| Tatars | 73,304 | 25,770 | 3,310 | 43,060 | 6 |
| Koreans | 49,817 | 2,223 | 37,932 | 9,662 | 0 |
| Romani people | 47,587 | 21,266 | 10,039 | 6,378 | 6 |
| Azerbaijanis | 45,176 | 23,958 | 3,224 | 16,968 | 36 |
| Georgians | 34,199 | 12,539 | 2,818 | 18,589 | 15 |
| Germans | 33,302 | 4,056 | 7,360 | 21,549 | 20 |
| Gagauz | 31,923 | 22,822 | 1,102 | 7,232 | 2 |
| Uzbeks | 12,353 | 3,604 | 1,818 | 5,996 | 0 |
| Chuvash | 10,593 | 2,268 | 564 | 7,636 | 1 |
| Mordvinians | 9,331 | 1,473 | 646 | 7,168 | 0 |
| Turks | 8,844 | 7,923 | 133 | 567 | 0 |
| Lithuanians | 7,207 | 1,932 | 1,029 | 4,182 | 4 |
| Arabs | 6,575 | 4,071 | 897 | 1,235 | 0 |
| Slovaks | 6,397 | 2,633 | 2,665 | 335 | 0 |
| Czechs | 5,917 | 1,190 | 2,503 | 2,144 | 2 |
| Kazakhs | 5,526 | 1,041 | 822 | 3,470 | 11 |
| Latvians | 5,079 | 957 | 872 | 3,188 | 1 |
| Ossetians | 4,834 | 1,150 | 401 | 3,110 | 4 |
| Udmurts | 4,712 | 729 | 380 | 3,515 | 0 |
| Lezghinians | 4,349 | 1,507 | 330 | 2,341 | 4 |
| Tadjiks | 4,255 | 1,521 | 488 | 1,983 | 0 |
| Bashkirs | 4,253 | 843 | 336 | 2,920 | 0 |
| Mari people | 4,130 | 1,059 | 264 | 2,758 | 7 |
| Thai | 3,850 | 3,641 | 29 | 164 | 0 |
| Turkmens | 3,709 | 719 | 1,079 | 1,392 | 0 |
| Albanians | 3,308 | 1,740 | 301 | 1,181 | 0 |
| Assyrians | 3,143 | 883 | 408 | 1,730 | 0 |
| Chechens | 2,877 | 1,581 | 212 | 977 | 0 |
| Estonians | 2,868 | 416 | 321 | 2,107 | 4 |
| Chinese people | 2,213 | 1,817 | 73 | 307 | 0 |
| Kurds | 2,088 | 1,173 | 236 | 396 | 0 |
| Darghins | 1,610 | 409 | 199 | 955 | 0 |
| Komis | 1,545 | 330 | 127 | 1,046 | 0 |
| Karelians | 1,522 | 96 | 145 | 1,244 | 1 |
| Avars | 1,496 | 582 | 121 | 761 | 0 |
| Peoples of India and Pakistan | 1,483 | 1,092 | 26 | 192 | 0 |
| Abkhazians | 1,458 | 317 | 268 | 797 | 0 |
| Karaites | 1,196 | 72 | 160 | 931 | 0 |
| Komi-Permians | 1,165 | 160 | 79 | 898 | 1 |
| Kyrgyz people | 1,128 | 208 | 221 | 617 | 19 |
| Laks | 1,019 | 199 | 271 | 514 | 13 |
| Afghans | 1,008 | 551 | 60 | 213 | 0 |
| other | 3,228 | 1,027 | 144 | 790 | 0 |
| NA | 188,639 | 0 | 1,108 | 1,844 | 1 |
 |
 |
 |
|||
| Ukrainian | Russian | Romanian and Moldovan |
 |
 |
 |
|||
| Crimean Tatar | Bulgarian | Hungarian |
Religion
A 2018 survey conducted by the Razumkov Centre found that 71.7% of the population declared themselves believers in any religion, while 4.7% declared themselves non-believers, and 3.0% declared to be atheists.[60] Of the total Ukrainian population, 87.4% declared to be Christians, comprising a 67.3% who declared to be Eastern Orthodox, 10.2% Catholic (split into 9.4% Ukrainian Greek Catholics and 0.8% Latin Catholics), 7.7% "Christians", and 2.2% Protestants. Judaism comprises 0.4% of the population. In earlier surveys around 1-2% of the population stated that they adhere to Islam.
According to data from 2018 among those Ukrainians who declared to believe in Orthodoxy, 28.7% declared to be members of the Ukrainian Orthodox Church of the Kyivan Patriarchate (being incorporated as of the 5 January 2019 into the Orthodox Church of Ukraine), while 12.8% declared to be members of the Ukrainian Orthodox Church of the Moscovian Patriarchate (which is an autonomous Eastern Orthodox church under the Russian Orthodox Church). A further 0.3% were members of the Ukrainian Autocephalous Orthodox Church, which, like the Kyivan Patriarchate, where incorporated in 2019 into the Orthodox Church of Ukraine. Among the remaining Orthodox Ukrainians, 23.4% declared to be "simply Orthodox", without affiliation to any patriarchate, while a further 1.9% declared that they "did not know" which patriarchate or Orthodox church they belonged to.[60]
Regional differences
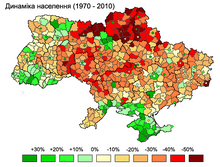
Regional differences in population change
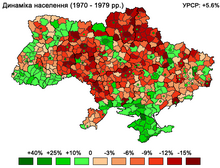
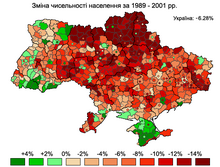
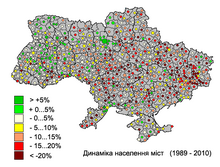
Between the Soviet census of 1989 and the Ukrainian census of 2001, Ukraine's population declined from 51,706,600 to 48,457,020,[61] a loss of 2,926,700 people or 5.7% of the 1989 population. However, this trend has been quite uneven and varied regionally. Two regions in western Ukraine — Rivne and Zakarpattia, saw slight population increases of 0.3% and 0.5% respectively. A third western Ukrainian region, Volyn, lost less than 0.1% of its population between 1989 and 2001.[61] Collectively, between 1989 and 2001 the seven westernmost regions of Ukraine lost 167,500 people or 1.7% of their 1989 population. The total population of these regions in 2001 was 9,593,800.[61]
Between 1989 and 2001, the population of Kyiv City increased by 0.3%[61] due to positive net-migration.[citation needed] Outside the capital, the central, southern and eastern regions experienced a severe decline in population. Between 1989 and 2001, the Donetsk region lost 491,300 people or 9.2% of its 1989 population, and neighbouring Luhansk region lost 11% of its population.[61] Chernihiv region, in central Ukraine northeast of Kyiv, lost 170,600 people or 12% of its 1989 population, the highest percentage loss in of any region in Ukraine. In southern Ukraine, Odesa region lost 173,600 people, or 6.6% of its 1989 population. By 2001, Crimea's population declined by 29,900 people, representing only 1.4% loss of the 1989 population.[61]
However, this was due to the influx of approximately 200,000 Crimean Tatars – a number equivalent to approximately 10% of Crimea's 1989 population – who arrived in Crimea after 1989 and whose population in that region increased by a factor of 6.4 from 38,000 to 243,400 between 1989 and 2001.[62] Collectively, the net population loss in the regions of Ukraine outside the westernmost regions was 2,759,200 people or 6.6% of the 1989 population. The total population of these regions in 2001 was 39,186,100.[61]
Thus, from 1989–2001 the pattern of population change was one of slight growth in Kyiv, slight declines in western Ukraine, large declines in eastern, central and southern Ukraine and a relatively small decline in Crimea due to a large influx of Crimean Tatars.
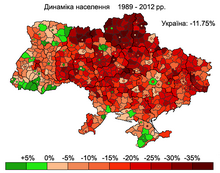
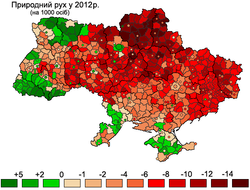 |
 |
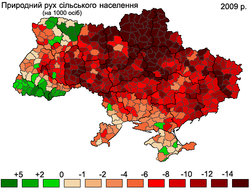 |
|||
| All population, 2012 | Urban population, 2009 | Rural population, 2009 |
Regional differences in birth and fertility rates
Ukraine's total fertility rate is one of the lowest in Europe.[63][64] However, significant regional differences in birth rates may account for some of the demographic differences. In the third quarter of 2007, for instance, the highest birth rate among Ukrainian regions occurred in Volyn Oblast, with a birth rate of 13.4/1,000 people, compared to the Ukrainian country-wide average of 9.6/1,000 people.[65] Volyn's birthrate is higher than the average birth rate of any European country with the exceptions of Iceland and Albania.[66]
In 2007, for the first time since 1990, five Ukrainian regions (Zakarpattia Oblast, Rivne Oblast, Volyn Oblast, Lviv Oblast, and Kyiv Oblast) experienced more births than deaths.[67] This demonstrates a positive trend of increasing birthrates in the last couple of years throughout Ukraine. The ratio of births to deaths in those regions in 2007 was 119%, 117%, 110%, 100.7%, and 108%, respectively.[67]
With the exception of Kyiv region, all of the regions with more births than deaths were in the less industrially developed regions of western Ukraine. According to a spokesperson for Ukraine's Ministry of Justice, the overall ratio of births to deaths in Ukraine had improved from 1 to 1.7 in 2004–2005 to 1 to 1.4 in 2008. However, the worst birth to death ratios in the country were in the eastern and central oblasts of Donetsk, Luhansk, Cherkasy and Poltava. In these regions, for every birth there were 2.1 deaths.[68]
Notably, western Ukraine never experienced the Holodomor, as Poland, Czechoslovakia, and Romania ruled it at the time, helping to explain the better demographics there, as the rural population was never devastated. Specifically, during the time of the Holodomor, Poland ruled Ivano-Frankivsk, Lviv, Rivne, Ternopil, and Volyn Oblasts, whereas Zakarpattia Oblast was under Czechoslovak rule, and Romania controlled Chernivtsi Oblast and the Budjak section of Odesa Oblast.
Abortion behavior in the North, South, East and Center regions of Ukraine are relatively homogeneous while the Western region differs greatly. Overall, the abortion rate in western Ukraine is three times lower than in other regions; however this is not due to an increased use of modern contraceptive methods in the West, but simply due to the fact that pregnant women in the Western regions are more likely to keep their babies.[69] Donetsk and Dniproptrovsk oblasts in eastern and central Ukraine have the country's highest rate of abortions.[70]
 |
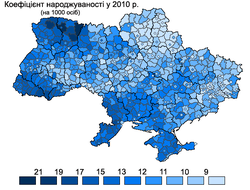 |
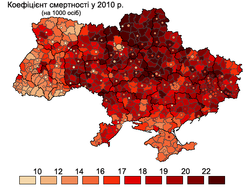 |
|||
| The birth rate in Ukraine, 2003. | The birth rate in Ukraine, 2010. | The death rate in Ukraine, 2010. |
Regional differences and death rates and health

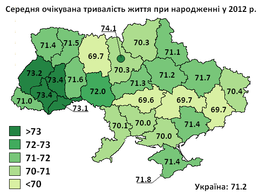
Death rates also vary widely by region; Eastern and southern Ukraine have the highest death rates in the country, and the life expectancy for children born in Chernihiv, Dnipropetrovsk, Donetsk, Kherson, Kropyvnytskyi, Luhansk, Mikolaiv, and Odesa regions is 1.5 years lower than the national average.[71]
Ukraine had a suicide rate of 16.5 per 100,000 population in 2017, a significant decrease from the suicide rate of 29.6 per 100,000 in 1998. Suicides are more frequent in the central part of the country (the highest suicide rates was in Kirovohrad Oblast; In western Ukraine, the suicide rate was lower than the national average. Lviv Oblast has the lowest suicide rate – 5.3[72]
The Southern and eastern Ukrainian regions also suffer from the highest rates of HIV and AIDS, which impacts life expectancy. In late 2000, 60% of all AIDS cases in Ukraine were concentrated in the Odesa, Dnipropetrovsk, and Donetsk regions.[73] A major reason for this is the fact that the urbanized and industrialized regions in the East and South of Ukraine suffered most from the economic crisis in the 1990s, which in turn led to the spread of unemployment, alcoholism, and drug abuse, thus setting the conditions for wider spread of the epidemic.[74]
Regional differences in income
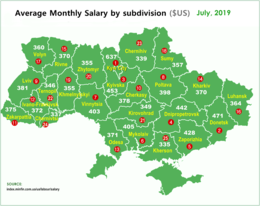
The western and central regions of Ukraine had lower GDP per capita than Kyiv and the industrialized eastern regions of Ukraine. In December 2019 the average monthly salary in Ukraine was 12,264 hryvnias (or 519 US dollars). Chernihiv oblast (northern Ukraine) and Kirovohrad Oblast (central Ukraine), had the lowest monthly salary of 8,851 and 9,450 hryvnias, respectively. In contrast, the monthly wage in the city of Kyiv was 18,869 hryvnias per month, and in Kyiv oblast – 13,259 per month.[75] In 2013, outside of the capital city of Kyiv, the wealthiest region was Donetsk Oblast with annual income 31,048 hryvnias. But as of 2017, Donetsk Oblast ranks as the second poorest after Luhansk Oblast with annual incomes 25,278 hryvnias and 16,416 hryvnias respectively.[76] Both are in the eastern Ukraine and have sustained direct losses as a consequence of military actions.
Ukraine recorded one of the sharpest declines in poverty of any transition economy in 2001–2016 years. The poverty rate, measured against an absolute poverty line (below $1.25 per day in dollars, based on World Bank) fell from a high of 32 percent in 2001 to 8 percent in 2005. In terms of poverty rates, the central and northern regions have the country's highest poverty rates – 10.0%. The western and southern regions – 9.1% and 9% respectively. Kyiv City had the lowest poverty rate – 1.4%.[77] Percent of population living under $5.50 a day was 19% in 2005 and dropped to 4.0 percent in 2018.[78][79]
Urbanization
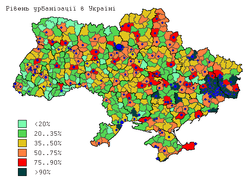 |
 |
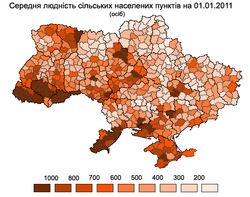 | ||
| Urbanization rate, 2011 | Population density, 2013 | Median population of rural settlements, 2011 |
Migration

Emigration
Ukraine is the major source of migrants in many of the member states of the European Union. During the 1990s and early 2000s, Ukraine's sputtering economy and political instability contributed to rising emigration, especially to nearby Poland and Hungary, but also to other countries like Italy, Portugal, Spain, Israel and Canada. Although estimates vary, approximately two to three million Ukrainian citizens are currently working abroad, in construction, service, housekeeping, and agriculture industries.
Between 1991 and 2004, the government counted 2,537,400 individuals who emigrated; 1,897,500 moved to other post-Soviet states, and 639,900 moved to other, mainly Western, states.[80]
By the early 2000s, Ukrainian embassies reported that 300,000 Ukrainian citizens were working in Poland, 200,000 in Italy, approximately 200,000 in the Czech Republic, 150,000 in Portugal, 100,000 in Spain, 35,000 in Turkey, 20,000 in the United States and small significant numbers in Austria, Belgium, France, Germany, Greece, Sweden, Switzerland and the UK. The largest number of Ukrainian workers abroad, about one million, are in the Russian Federation. Since 1992, 232,072 persons born in Ukraine have emigrated to the US.
From the point of view of the economic impact on natives, more appropriate than the absolute numbers is the volume of immigration as a proportion of the native population. Italy has the highest rate of Ukrainian emigrants as a proportion of the native population, while the much larger Russia has the largest absolute confirmed number of Ukrainian emigrants (leaving aside Poland, Portugal and the Czech Republic, for which there is conflicting data).
Immigration
Between 1991 and 2003, about 100,000 illegal immigrants were detained at the western borders.[81] In 2005, about 5,000 illegal immigrants are detained yearly. Most of these are Asian immigrants from China, India, Pakistan and Afghanistan.[81] At the time about 3,000 officially registered refugees resided in Ukraine, of whom most were Afghans.[81]
Ukraine accepted some 62,000 refugees from Transnistria following its war in 1992.[81] Thousands were also accepted during decade from other post-Soviet conflicts in Abkhazia, Chechnya and Tajikistan.[81]
Results between the 1989 Soviet census and the 2001 census showed an increased number of CIS people in Ukraine from regions witnessing war. The number of Armenians in Ukraine almost doubled to 99,900 people during this period, while the number of Georgians and Azerbaijanis also had substantial increases.[81]
As of April 2020, 1.4 million Ukrainians are internally displaced due to the ongoing war in Donbas.[82]
See also
General:
Notes
- ^ Note: Crude migration change (per 1000) is a trend analysis, an extrapolation based average population change (current year minus previous) minus natural change of the current year (see table vital statistics). As average population is an estimate of the population in the middle of the year and not end of the year.
References
- ^ a b "Population of Ukraine". www.ukrstat.gov.ua. State Statistics Service of Ukraine. Retrieved 2 January 2022.
- ^ "Total Population by sex - Ukraine - 1990 to 2030". population.un.org/wpp/. United Nations Department of Economic and Social Affairs. Retrieved 21 June 2022.
- ^ https://ubn.news/the-imf-believes-that-the-population-of-ukraine-will-grow-after-a-significant-decline-in-the-first-years-of-the-war/
- ^ a b c "Population estimate as of February 1, 2022". www.ukrcensus.gov.ua/eng. State Statistics Service of Ukraine. Retrieved 21 June 2022.
- ^ "World Population Dashboard -Ukraine | United Nations Population Fund". www.unfpa.org. Retrieved 6 March 2024.
- ^ Harmash, Olena (7 July 2023). "Ukrainian refugees: how will the economy recover with a diminished population?". Reuters. Retrieved 15 October 2023.
- ^ "Ukraine Population 1950-2023". www.macrotrends.net. Retrieved 1 August 2023.
- ^ "ru:Институт демографии Национального исследовательского университета 'Высшая школа экономики'" [Institute of Demography of the National Research University "Graduate School of Economics']. Demoscope.ru (in Russian). 21 March 2013. ISSN 1726-2887. Retrieved 10 December 2016.
- ^ Ukraine, Orest Subtelny, page 152, 2000
- ^ "Brief description of Zenon Kuzela (Kuzelya)". www.jstor.org. JSTOR 4204419. Retrieved 25 September 2022.
- ^ Ukraine: A Concise Encyclopedia Vol. 1, Book by Volodymyr Kubiyovych; University of Toronto Press, 1963
- ^ "Posted availability of the book".[permanent dead link]
- ^ Vallin, Jacques; Meslé, France; Adamets, Serguei; Pyrozhkov, Serhii (2002). "A New Estimate of Ukrainian Population Losses During the Crises of the 1930s and 1940s". Population Studies. 56 (3): 249–264. doi:10.1080/00324720215934. JSTOR 3092980. PMID 12553326. S2CID 21128795.
- ^ Ian Dear, Michael Richard Daniell Foot (2001). The Oxford companion to World War II. Oxford University Press. p. 909. ISBN 0-19-860446-7
- ^ Malynovska, Olena (January 2006). "Caught Between East and West, Ukraine Struggles with Its Migration Policy". National Institute for International Security Problems, Kyiv. Retrieved 3 July 2008.
- ^ "United Nations Population Division | Department of Economic and Social Affairs". www.un.org. Retrieved 7 June 2019.
- ^ "Ethnic origins, 2006 counts, for Canada, provinces and territories – 20% sample data" Archived 18 August 2016 at the Wayback Machine. Statistics Canada.
- ^ Bershidsky, Leonid (20 February 2019). "Eastern Europe Feeds on a Shrinking Ukraine". Bloomberg. Retrieved 24 June 2019.
- ^ Kiryukhin, Denys (14 May 2019). "Losing Brains and Brawn: Outmigration from Ukraine". Woodrow Wilson International Center for Scholars. Retrieved 24 June 2019.
- ^ Tyshchuk, Tetyana (20 June 2018). "The Great Migration: No One in Ukraine Knows How Many of Our Compatriots Have Moved Abroad". vox ukraine. Retrieved 24 June 2019.
- ^ State Statistics Committee of Ukraine Retrieved 18 September 2009
- ^ Demoscope Retrieved 18 September 2009
- ^ "Field Listing – Population growth rate". CIA World Factbook. Archived from the original on 13 June 2007. Retrieved 5 July 2008.
- ^ "Infant mortality rate, Ukraine". Cia.gov. Archived from the original on 16 June 2013. Retrieved 26 January 2014.
- ^ "Ukraine's Population Shrinks By Nearly A Quarter". Radio Free Europe. 23 January 2020. Retrieved 24 August 2020.
- ^ "The government has estimated Ukraine's population at 37.3 million". empr.media. Archived from the original on 6 October 2023. Retrieved 16 December 2020.
- ^ Knapp, Andreas (13 July 2023). "Ukraine: Population loss endangers reconstruction". WIIW. Retrieved 19 July 2023.
- ^ Perelli-Harris, Brienna (2005). "The Path to Lowest-low Fertility in Ukraine". Population Studies. 59 (1): 55–70. doi:10.1080/0032472052000332700. JSTOR 30040436. PMID 15764134. S2CID 21769928.
- ^ a b "The World FactBook – Ukraine", The World Factbook, 12 July 2018
- ^ "Bohdan Danylyshyn at the Economic ministry". Economic Ministry. Retrieved 1 February 2008.
- ^ "President meets with business bosses". Press office of President Victor Yushchenko. Archived from the original on 14 December 2007. Retrieved 1 February 2008.
- ^ (in Ukrainian) The demographic situation in Ukraine in January–September 2009, State Statistics Committee of Ukraine
- ^ "Ukraine's birth rate shows first positive signs in decade". Ukrainian Independent Information Agency (UNIAN). 5 October 2007. Retrieved 3 July 2008.
- ^ "Ukraine's birth rate plummets in aftermath of Russian invasion, data shows". The Guardian. 2 August 2023.
- ^ "Because of the war: How Ukraine's population will change by 2030". english.nv.ua. Retrieved 22 July 2023.
- ^ "World Population Prospects – Population Division – United Nations". esa.un.org. Retrieved 26 August 2018.
- ^ Demographic yearbook, 2001 (PDF). New York: United Nations. 2003. ISBN 978-92-1-051094-3. Retrieved 22 April 2016.
- ^ Общий коэффициент смертности (на 1000 населения): Украина: 1950–2013 [Crude death rate (per 1,000 people): Ukraine: 1950–2013]. Demoscope Weekly (in Russian). Archived from the original on 21 March 2016. Retrieved 22 April 2016.
- ^ Державна служба статистикі України [State Statistics Committee of Ukraine]. State Statistics Committee of Ukraine (in Ukrainian). Archived from the original on 15 September 2002. Retrieved 14 December 2009.
- ^ "Statistical Yearbooks of the Russian Empire". Archived from the original on 16 December 2014. Retrieved 24 December 2014.
- ^ "The Crisis of the 1930s" (PDF).
- ^ a b "Державна служба статистики України". ukrstat.gov.ua. Retrieved 25 September 2022.
- ^ "Ukraine's population". 19 June 2023.
- ^ "Table: 0301. Number of live births, deaths and natural increase (decrease) of the population (0,1)". Databank. State Statistics Service of Ukraine. Archived from the original on 23 January 2017. Retrieved 9 July 2019.
- ^ "UNSD — Demographic and Social Statistics". unstats.un.org. Retrieved 10 May 2023.
- ^ "Населення та міграція 2016".
- ^ State Statistics Committee of Ukraine – Natural increase in population in 2010 Retrieved on 20 May 2011
- ^ "Ukraine Population 2018", World Population Review
- ^ a b "Population census 2001: Population by nationality". Archived from the original on 15 March 2007. Retrieved 25 September 2022.
- ^ "Державна служба статистики України". www.ukrstat.gov.ua. Retrieved 15 April 2019.
- ^ "Phantom Syndrome: Ethnic Koreans in Ukraine". Bird In Flight. 18 July 2017. Retrieved 15 April 2019.
- ^ Encyclopedia of Rusyn history and culture. Toronto, Ont.: University of Toronto Press. 2002. ISBN 0802035663.
- ^ "The Law on the Indigenous Peoples of Ukraine. What does it bring to national minorities?". Culturico. 20 December 2021. Retrieved 3 November 2023.
- ^ "Демоскоп Weekly – Приложение. Справочник статистических показателей". Demoscope.ru. 21 March 2013. Retrieved 14 March 2022.
- ^ "Демоскоп Weekly – Приложение. Справочник статистических показателей". Demoscope.ru. 21 March 2013. Retrieved 14 March 2022.
- ^ "Демоскоп Weekly – Приложение. Справочник статистических показателей". Demoscope.ru. 21 March 2013. Retrieved 14 March 2022.
- ^ "Демоскоп Weekly – Приложение. Справочник статистических показателей". Demoscope.ru. 21 March 2013. Retrieved 14 March 2022.
- ^ "Демоскоп Weekly – Приложение. Справочник статистических показателей". Demoscope.ru. 21 March 2013. Retrieved 14 March 2022.
- ^ "Ukraine PEOPLE 2017 SOURCE: 2017 CIA WORLD FACTBOOK AND OTHER SOURCES".
- ^ a b Особливості Релігійного І Церковно-Релігійного Самовизначення Українських Громадян: Тенденції 2010–2018 [Features of Religious and Church – Religious Self-Determination of Ukrainian Citizens: Trends 2010–2018] (PDF) (in Ukrainian), Kyiv: Razumkov Center in collaboration with the All-Ukrainian Council of Churches, 22 April 2018, pp. 12, 13, 16, 31, archived (PDF) from the original on 26 April 2018
Sample of 2,018 respondents aged 18 years and over, interviewed 23–28 March 2018 in all regions of Ukraine except Crimea and the occupied territories of the Donetsk and Lugansk regions. - ^ a b c d e f g "All-Ukrainian population census of 2001". State Statistics Committee of Ukraine. 2003. Archived from the original on 14 June 2007.
- ^ "About number and composition population of Autonomous Republic of Crimea by data All-Ukrainian population census". Archived from the original on 4 December 2007. Retrieved 25 September 2022.
- ^ Рождаемость в Украине самая низкая в Европе, Demoscope.ru, 16–29 April 2007 (in Russian)
- ^ United Nations Department of Economic and Social Affairs, Population Division (2007). "United Nations World Population Prospects: 2006 revision, Table A.15" (PDF). New York: UN. Retrieved 26 September 2010.
- ^ MIGnews: Volyn Region – Fertility Leader in Ukraine Archived 12 October 2007 at the Wayback Machine, 10 October 2007. Retrieved 19 October 2007.
- ^ "CIA world factbook". Archived from the original on 9 March 2013. Retrieved 25 September 2022.
- ^ a b Ukrainian News: Birth Rate Exceeds Death Rate in Five Regions of Ukraine First Since 1990s Archived 18 February 2009 at the Wayback Machine 4 October 2007. Retrieved 19 October 2007.
- ^ Inna Filipenko. The Day. Births and deaths: A record-breaking half million children were born in Ukraine last year. #3. 3 February 2009. Retrieved 8 December 2009.
- ^ Natalia LEvchuk, Brienna Perelli-Harris. (2009). Declining Fertility in UKraine: What is the role of abortion and contraception? Max Planck Institute for Demographic Research
- ^ "World Bank Report, Chapter 3: Demographic Forecast Under the HIV/AIDS Epidemic" (PDF).
- ^ Unicef. (2004). The Situation of Children and Young People at the Regional Level in Ukraine Prepared by Ukraine Country Statistical Team Co-ordinator: Iryna Kalachova State Statistic Committee, Kyiv
- ^ "Home". ukrstat.gov.ua.
- ^ The International Encyclopedia of Sexuality of the Kinsey Institute. Tamara V. Hovorun, Ph.D., and Borys M. Vornyk, Ph.D. (Medicine). Rewritten and updated in 2003 by T. V. Hovorun and B. M. Vornyk(2003) Ukraine Archived 23 January 2010 at the Wayback Machine
- ^ Vulnerability Assessment of People Living With HIV (PLHIV) in Ukraine Archived 24 July 2011 at the Wayback Machine United Nations Development Programme, page 24 – Retrieved on 8 December 2009
- ^ "Average Monthly Salary".
- ^ "Average Income in Ukraine Per Region, 2017 State Statistics Committee of Ukraine" (PDF). Archived from the original (PDF) on 18 December 2019. Retrieved 18 December 2019.
- ^ "UKRAINE: Poverty Update" (PDF).
- ^ "Ukraine poverty rate".
- ^ "World Bank, Poverty & Equity and M acroeconomics, Trade & Investment Global Update-Spring-2019" (PDF).
- ^ By Olena Malynovska, National Institute for International Security Problems, Kyiv Caught Between East and West, Ukraine Struggles with Its Migration Policy
- ^ a b c d e f "Caught Between East and West, Ukraine Struggles with Its Migration Policy". Migration Policy Institute. January 2006.
- ^ "National Monitoring System Report on the Situation of Internally Displaced Persons – March 2020 – Ukraine | ReliefWeb". Reliefweb.int. Retrieved 14 March 2022.
External links
 Media related to Demographics of Ukraine at Wikimedia Commons
- State Committee for Statistics of Ukraine, official website at the Library of Congress Web Archives (archived 2002-09-15)
- Ukraine Situation Flash Update #47 (19 May 2023) May 2023 updated UNHCR numbers of Ukrainian population (8,240,289) displaced into other countries of the European Union.
- Trafficking in and enslavement of women Follow-up to the Fourth World Conference on Women, 2–13 March 1998
- Migration News, 2001 University of California, Davis
- The demographic situation in Ukraine: present state. tendencies, and predictions Archived 23 February 2007 at the Wayback Machine, Razumkov Centre
- On the status of observance and protection of the rights of Ukrainian citizens abroad the Special Report of the Ukrainian Parliament Commissioner for Human Rights
- News on Trafficking of Ukrainian Women, 2000–01 Trafficking in Women from Ukraine Research Project, University of Rhode Island
- Caught Between East and West, Ukraine Struggles with Its Migration Policy By Olena Malynovska, National Institute for International Security Problems, Kyiv, January 2006
- Emigration from Ukraine, 23 October 2003 The Economist (subscription required)
- Meslé, France; Pison, Gilles; Vallin, Jacques (2005). "France-Ukraine: Demographic Twins Separated by History" (PDF). Population and Societies (413): 1–4. Archived from the original (PDF) on 26 May 2011.
- Vallin, Jacques; Meslé, France; Adamets, Serguei; Pyrozhkov, Serhii (2002). "A New Estimate of Ukrainian Population Losses during the Crises of the 1930s and 1940s" (PDF). Population Studies. 56 (3): 249–264. doi:10.1080/00324720215934. PMID 12553326. S2CID 21128795. Archived from the original (PDF) on 14 March 2022. Retrieved 22 April 2016.
- Mortality and Causes of Death in 20th-Century Ukraine MPIDR - Publications
- Rapawy, Stephen (August 1997). "ETHNIC REIDENTIFICATION IN UKRAINE" (PDF). U.S. Census Bureau.
- Pirie, Paul S. (November 1996). "National Identity and Politics in Southern and Eastern Ukraine". Europe-Asia Studies. 48 (7). Taylor & Francis, Ltd.: 1079–1104. doi:10.1080/09668139608412401. JSTOR 153099.