

| UML diagram types |
|---|
| Structural UML diagrams |
| Behavioral UML diagrams |
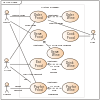
In Unified Modeling Language (UML), a component diagram depicts how components are wired together to form larger components or software systems. They are used to illustrate the structure of arbitrarily complex systems.
YouTube Encyclopedic
-
1/3Views:28 192100 4973 174
-
UML Structural Diagrams: Component Diagram - Georgia Tech - Software Development Process
-
UML 2 Component Diagrams
-
UML 2.0 Tutorial part 10 - Component Diagram
Transcription
There's two more structural diagrams that I want to mention before we move to the behavioral ones. The first one's the component diagram. A component diagram is a static view of components in a system and of their relationships. More precisely, a node in a component diagram represents a component where a component consists of one or more classes with a well-defined interface. Edges conversely indicate relationships between the components. You can read this relationship as component A uses services of component B. And notice that the component diagrams can be used to represent an architecture, which is a topic that we will cover extensively in the next mini-course. So let's illustrate this with an example. So, what I'm representing here is a component diagram for our example system, the course management system. And as you can see, it's slightly more complex than the other diagrams that we saw. But there's really no need to go through all the steps and all the details. Important thing is to point out some key aspects of this diagram. So the first one is that these rectangular nodes are the nodes in the system, so are my components. For example, student is a component, schedule is a component, and so on. And as far as edges are concerned, I'm representing two kinds of edges. The first kind of dashed edges which were part of the original uml definition and indicate use. So an edge, for example, between this compnent and this compnent indicated that the seminar management uses the facilities component. More recently, in UML two, a richer representation was introduced, which is the one that I'm also showing here. So if we look at this part of the diagram, you can see this sort of you now, lollipop socket representation. And in this case, what this represents, is that a lollipop indicates a provided interface. So an interface that is provided by the component. So, for example, this security component provides encryption capabilities. The socket, conversely, indicates a required interface. So, for example, in this case, it's saying that the facilities component is needing access control capabilities, which, by the way, is provided by the security component. So in a sense these sockets and lollipop indicate interfaces between a provider of some of functionality, and the client of that functionality and you can look at those as basically APIs. So sets of methods that provide a given functionality. To give you another example, if we look at the persistence components the persistence component provides, unsurprisingly, persistent services. And those persistent services are required by several other components in the system. And in turn, the persistent components relies on the University database component to provide such services. So, there's the University DB components provide these sort of low-level database services that are used by the persistence component To in turn provided services. Last thing I want to note is that components or relationships can be annotated, so, for example if we look at the seminar management and the student administration components you can see that they are annotated here to indicate that they are user inferfaces. So that's all I wanted to say on the component diagrams, but again the key piece of information is that they represent components in the system where a component consists of one or more classes indicate the interfaces that these components provide or require. and describe the interactions between these components.
Overview
A component diagram allows verification that a system's required functionality is acceptable. These diagrams are also used as a communication tool between the developer and stakeholders of the system. Programmers and developers use the diagrams to formalize a roadmap for the implementation, allowing for better decision-making about task assignment or needed skill improvements. System administrators can use component diagrams to plan ahead, using the view of the logical software components and their relationships on the system.[1]
Diagram elements
The component diagram extends the information given in a component notation element. One way of illustrating the provided and required interfaces by the specified component is in the form of a rectangular compartment attached to the component element.[2] Another accepted way of presenting the interfaces is to use the ball-and-socket graphic convention. A provided dependency from a component to an interface is illustrated with a solid line to the component using the interface from a "lollipop", or ball, labelled with the name of the interface. A required usage dependency from a component to an interface is illustrated by a half-circle, or socket, labelled with the name of the interface, attached by a solid line to the component that requires this interface. Inherited interfaces may be shown with a lollipop, preceding the name label with a caret symbol. To illustrate dependencies between the two, use a solid line with a plain arrowhead joining the socket to the lollipop.[3]
References
- ^ Bell, Donald (December 15, 2004). "UML basics: The component diagram". IBM Developer. Retrieved June 15, 2019.
- ^ Bell, Donald (December 15, 2004). "UML basics: The component diagram". IBM Developer. Retrieved June 15, 2019.
- ^ "Unified Modeling Language Specification Version 2.5.1". Object Management Group. December 2017. Retrieved June 15, 2019.
External links
- Official UML Version 2.5.1 Specification
- Component Diagrams in UML 2
- UML 2 Component Diagram Guidelines by Scott W. Ambler
- UML 2 Component Diagrams
| Actors |
|  | |||||||||||
|---|---|---|---|---|---|---|---|---|---|---|---|---|---|
| Concepts |
| ||||||||||||
| Diagrams |
| ||||||||||||
| Derived languages | |||||||||||||
| Other topics | |||||||||||||