
| |||||||||||||||||||||||||||||||||||||||||||||||||||||||||||||||||
20 out of 60 seats to Colchester Borough Council 31 seats needed for a majority | |||||||||||||||||||||||||||||||||||||||||||||||||||||||||||||||||
|---|---|---|---|---|---|---|---|---|---|---|---|---|---|---|---|---|---|---|---|---|---|---|---|---|---|---|---|---|---|---|---|---|---|---|---|---|---|---|---|---|---|---|---|---|---|---|---|---|---|---|---|---|---|---|---|---|---|---|---|---|---|---|---|---|---|
| Turnout | 34.7% ( | ||||||||||||||||||||||||||||||||||||||||||||||||||||||||||||||||
| |||||||||||||||||||||||||||||||||||||||||||||||||||||||||||||||||
| |||||||||||||||||||||||||||||||||||||||||||||||||||||||||||||||||
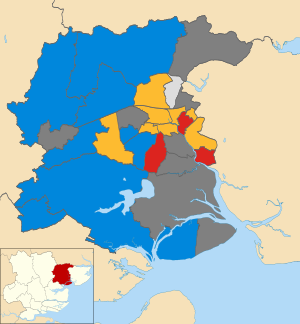
The 2007 Colchester Borough Council election took place on 3 May 2007 to elect members of Colchester Borough Council in Essex, England. One third of the council was up for election and the council stayed under no overall control.[1]
After the election, the composition of the council was
- Conservative 30
- Liberal Democrats 21
- Labour 6
- Independent 3[2]
Campaign
Before the election the Conservatives had 30 of the 60 seats on the council, while the Liberal Democrats had 21, Labour had 7 and there were 2 independents.[3]
With the Conservative party needing to gain one seat to gain a majority on the council for the first time since 1986,[4] Colchester attracted national attention with the Shadow Foreign Secretary, William Hague, coming to the marginal Shrub End ward to campaign for the Conservatives.[5] Meanwhile, one of the Green party's Principal Speakers Siân Berry came to Colchester and campaigned on the importance of public transport, with the Greens contesting every seat at the election.[5]
Election result
The Conservatives narrowly failed to gain a majority on the council after failing to take Wivenhoe Quay from Labour by two votes after two recounts.[4] This meant the Conservatives remained on 30 councillors, while the Liberal Democrats stayed on 21 seats.[4] Labour's loss of Shrub End to the Conservatives meant they dropped to 6 councillors, while the Greens failed to win any seats despite getting 32% of the vote in Castle ward.[4][6] Overall turnout at the election was 34.7%.[7]
| 2007 Colchester Borough Council election[1][7] | ||||||||||
|---|---|---|---|---|---|---|---|---|---|---|
| Party | This election | Full council | This election | |||||||
| Seats | Net | Seats % | Other | Total | Total % | Votes | Votes % | +/− | ||
| Conservative | 9 | 45.0 | 21 | 30 | 50.0 | 14,342 | 41.8 | +2.9 | ||
| Liberal Democrats | 7 | 35.0 | 14 | 21 | 35.0 | 10,052 | 29.3 | –4.5 | ||
| Labour | 3 | 15.0 | 3 | 6 | 10.0 | 5,581 | 16.3 | +3.0 | ||
| Independent | 1 | 5.0 | 2 | 3 | 5.0 | 1,052 | 3.1 | –2.4 | ||
| Green | 0 | 0.0 | 0 | 0 | 0.0 | 3,267 | 9.5 | +1.0 | ||
Ward results
Berechurch
| Party | Candidate | Votes | % | ±% | |
|---|---|---|---|---|---|
| Labour | Dave Harris* | 931 | 49.7 | +17.4 | |
| Liberal Democrats | Keith Hindle | 483 | 25.8 | -16.4 | |
| Conservative | Claire Bright | 352 | 18.8 | +0.7 | |
| Green | Philippa Lane | 109 | 5.8 | -1.6 | |
| Majority | 448 | 23.9 | N/A | ||
| Turnout | 1,875 | 32.7 | -1.3 | ||
| Registered electors | 5,740 | ||||
| Labour hold | Swing | ||||
Birch & Winstree
| Party | Candidate | Votes | % | ±% | |
|---|---|---|---|---|---|
| Conservative | Peter Crowe* | 1,164 | 70.1 | +3.5 | |
| Liberal Democrats | Jonathan Longman | 313 | 18.9 | +1.2 | |
| Labour | James Spencer | 100 | 6.0 | -1.0 | |
| Green | Tobie Glenny | 83 | 5.0 | -0.9 | |
| Majority | 851 | 51.3 | +2.4 | ||
| Turnout | 1,660 | 37.5 | -4.6 | ||
| Registered electors | 4,438 | ||||
| Conservative hold | Swing | ||||
Castle
| Party | Candidate | Votes | % | ±% | |
|---|---|---|---|---|---|
| Liberal Democrats | Nick Barlow | 940 | 41.0 | -7.7 | |
| Green | Peter Lynn | 740 | 32.3 | +9.7 | |
| Conservative | Glenn Granger | 469 | 20.5 | +2.4 | |
| Labour | Michael Powell | 142 | 6.2 | -1.9 | |
| Majority | 200 | 8.7 | -17.3 | ||
| Turnout | 2,291 | 37.4 | -4.1 | ||
| Registered electors | 6,182 | ||||
| Liberal Democrats hold | Swing | ||||
Christ Church
| Party | Candidate | Votes | % | ±% | |
|---|---|---|---|---|---|
| Liberal Democrats | Martin Hunt* | 588 | 42.4 | -1.3 | |
| Conservative | Andrew Bright | 474 | 34.2 | +0.9 | |
| Green | Alexander Cave | 245 | 17.7 | +0.3 | |
| Labour | David Canning | 79 | 5.7 | +0.1 | |
| Majority | 114 | 8.2 | -2.2 | ||
| Turnout | 1,386 | 46.0 | -2.3 | ||
| Registered electors | 3,018 | ||||
| Liberal Democrats hold | Swing | ||||
Copford & West Stanway
| Party | Candidate | Votes | % | ±% | |
|---|---|---|---|---|---|
| Conservative | Jackie Maclean | 394 | 69.1 | -1.4 | |
| Liberal Democrats | Sue Waite | 82 | 14.4 | +7.0 | |
| Labour | Ian Spademan | 48 | 8.4 | +0.4 | |
| Green | Sophie Lovejoy | 46 | 8.1 | +8.1 | |
| Majority | 312 | 54.7 | -1.8 | ||
| Turnout | 570 | 38.4 | +4.4 | ||
| Registered electors | 1,494 | ||||
| Conservative hold | Swing | ||||
Fordham & Stour
| Party | Candidate | Votes | % | ±% | |
|---|---|---|---|---|---|
| Conservative | Nigel Chapman* | 913 | 67.2 | +0.6 | |
| Liberal Democrats | David Shakespeare | 180 | 13.2 | +0.8 | |
| Green | Mervyn Carter | 146 | 10.7 | +2.6 | |
| Labour | Jo Aldous | 120 | 8.8 | +0.4 | |
| Majority | 733 | 53.9 | -0.3 | ||
| Turnout | 1,359 | 34.3 | -2.4 | ||
| Registered electors | 3,983 | ||||
| Conservative hold | Swing | ||||
Great Tey
| Party | Candidate | Votes | % | ±% | |
|---|---|---|---|---|---|
| Conservative | Peter Chillingworth* | 670 | 71.9 | +3.3 | |
| Liberal Democrats | Carolyn Catney | 105 | 11.3 | -9.6 | |
| Labour | John Wood | 90 | 9.7 | -1.8 | |
| Green | Paul Goldsmith | 67 | 7.2 | -7.2 | |
| Majority | 565 | 60.6 | +12.8 | ||
| Turnout | 932 | 41.9 | -0.8 | ||
| Registered electors | 2,226 | ||||
| Conservative hold | Swing | ||||
Highwoods
| Party | Candidate | Votes | % | ±% | |
|---|---|---|---|---|---|
| Independent | Philip Oxford | 1,052 | 52.6 | -5.6 | |
| Conservative | Simon Lucas | 427 | 21.4 | +6.5 | |
| Liberal Democrats | John Baker | 306 | 15.3 | +0.1 | |
| Labour | Janet Smith | 127 | 6.4 | -1.1 | |
| Green | Gary Kittle | 88 | 4.4 | +0.1 | |
| Majority | 625 | 31.3 | -11.7 | ||
| Turnout | 2,000 | 30.9 | -1.7 | ||
| Registered electors | 6,484 | ||||
| Independent gain from Conservative | Swing | ||||
Mile End
| Party | Candidate | Votes | % | ±% | |
|---|---|---|---|---|---|
| Liberal Democrats | Anne Turrell* | 1,081 | 47.1 | +8.2 | |
| Conservative | Marianne Anderson | 995 | 43.4 | -2.8 | |
| Labour | Steve Crawshaw | 118 | 5.1 | -1.1 | |
| Green | Mary Bryan | 99 | 4.3 | -2.1 | |
| Majority | 86 | 3.8 | N/A | ||
| Turnout | 2,293 | 39.5 | +1.0 | ||
| Registered electors | 5,812 | ||||
| Liberal Democrats hold | Swing | ||||
New Town
| Party | Candidate | Votes | % | ±% | |
|---|---|---|---|---|---|
| Liberal Democrats | Margaret Fisher* | 872 | 55.6 | -9.8 | |
| Conservative | George Askew | 271 | 17.3 | N/A | |
| Green | Linda Wonnacott | 252 | 16.1 | -5.4 | |
| Labour | Luke Dopson | 173 | 11.0 | -2.1 | |
| Majority | 601 | 38.3 | -5.5 | ||
| Turnout | 1,568 | 27.0 | -1.8 | ||
| Registered electors | 5,867 | ||||
| Liberal Democrats hold | Swing | N/A | |||
Prettygate
| Party | Candidate | Votes | % | ±% | |
|---|---|---|---|---|---|
| Conservative | Wyn Foster | 1,404 | 54.2 | +0.6 | |
| Liberal Democrats | Paul Ost | 875 | 33.8 | -0.9 | |
| Labour | Michael Dale | 182 | 7.0 | -0.3 | |
| Green | Peter Appleton | 129 | 5.0 | +0.5 | |
| Majority | 529 | 20.4 | +1.5 | ||
| Turnout | 2,590 | 43.7 | +0.0 | ||
| Registered electors | 5,958 | ||||
| Conservative gain from Liberal Democrats | Swing | ||||
St. Andrew's
| Party | Candidate | Votes | % | ±% | |
|---|---|---|---|---|---|
| Labour | Tim Young* | 969 | 61.6 | -8.2 | |
| Liberal Democrats | Rebecca Price | 299 | 19.0 | -10.2 | |
| Conservative | Alex Wilson | 237 | 15.1 | +2.7 | |
| Green | Andrew Senter | 68 | 4.3 | -0.7 | |
| Majority | 670 | 42.6 | +18.4 | ||
| Turnout | 1,573 | 24.8 | -3.4 | ||
| Registered electors | 6,363 | ||||
| Labour hold | Swing | ||||
St. Anne's
| Party | Candidate | Votes | % | ±% | |
|---|---|---|---|---|---|
| Liberal Democrats | Barrie Cook* | 1,000 | 49.3 | -2.5 | |
| Labour | Kim Naish | 548 | 27.0 | +0.6 | |
| Conservative | Anne Allan | 368 | 18.2 | +4.5 | |
| Green | Annick Collins-Leyssen | 111 | 5.5 | -2.5 | |
| Majority | 452 | 22.3 | -3.1 | ||
| Turnout | 2,027 | 32.2 | -0.5 | ||
| Registered electors | 6,336 | ||||
| Liberal Democrats hold | Swing | ||||
Shrub End
| Party | Candidate | Votes | % | ±% | |
|---|---|---|---|---|---|
| Conservative | Pauline Hazell | 718 | 38.5 | +4.8 | |
| Liberal Democrats | Nigel Offen | 643 | 34.5 | -7.5 | |
| Labour | Richard Bourne* | 404 | 21.7 | +2.1 | |
| Green | Walter Schwarz | 100 | 5.4 | +0.6 | |
| Majority | 75 | 4.0 | N/A | ||
| Turnout | 1,865 | 31.2 | -1.6 | ||
| Registered electors | 6,008 | ||||
| Conservative gain from Labour | Swing | ||||
Stanway
| Party | Candidate | Votes | % | ±% | |
|---|---|---|---|---|---|
| Liberal Democrats | Lesley Scott-Boutell* | 1,214 | 52.2 | +10.2 | |
| Conservative | Beverly Davies | 897 | 38.6 | -5.4 | |
| Labour | John Spademan | 141 | 6.1 | -2.4 | |
| Green | Pam Nelson | 74 | 3.2 | -2.3 | |
| Majority | 317 | 13.6 | N/A | ||
| Turnout | 2,326 | 37.7 | -0.5 | ||
| Registered electors | 6,166 | ||||
| Liberal Democrats hold | Swing | ||||
Tiptree
| Party | Candidate | Votes | % | ±% | |
|---|---|---|---|---|---|
| Conservative | Margaret Crowe* | 1,185 | 65.4 | +11.0 | |
| Labour | Audrey Spencer | 330 | 18.2 | +3.6 | |
| Liberal Democrats | Michael Turrell | 151 | 8.3 | -1.4 | |
| Green | Katherine Bamforth | 146 | 8.1 | +2.0 | |
| Majority | 855 | 47.2 | +7.9 | ||
| Turnout | 1,812 | 30.2 | -0.2 | ||
| Registered electors | 6,008 | ||||
| Conservative hold | Swing | ||||
West Bergholt & Eight Ash Green
| Party | Candidate | Votes | % | ±% | |
|---|---|---|---|---|---|
| Conservative | Jill Todd* | 877 | 62.9 | -0.7 | |
| Liberal Democrats | Barry Woodward | 177 | 12.7 | -4.8 | |
| Labour | Abigail Tootal | 173 | 12.4 | +4.5 | |
| Green | Roger Bamforth | 167 | 12.0 | +1.1 | |
| Majority | 700 | 50.2 | +4.1 | ||
| Turnout | 1,394 | 36.4 | -1.8 | ||
| Registered electors | 3,849 | ||||
| Conservative hold | Swing | ||||
West Mersea
| Party | Candidate | Votes | % | ±% | |
|---|---|---|---|---|---|
| Conservative | Margaret Kimberley* | 1,510 | 74.1 | +3.6 | |
| Liberal Democrats | Christopher Butler | 201 | 9.9 | +9.9 | |
| Labour | Barbara Nichols | 178 | 8.7 | -1.4 | |
| Green | Beverley Maltby | 148 | 7.3 | -3.2 | |
| Majority | 1,309 | 64.3 | +4.2 | ||
| Turnout | 2,037 | 35.0 | +0.2 | ||
| Registered electors | 5,837 | ||||
| Conservative hold | Swing | ||||
Wivenhoe Cross
| Party | Candidate | Votes | % | ±% | |
|---|---|---|---|---|---|
| Liberal Democrats | Mark Cory | 395 | 42.5 | +3.2 | |
| Conservative | David Adams* | 371 | 39.9 | -6.5 | |
| Green | Maria Iacovou | 83 | 8.9 | +8.9 | |
| Labour | Rossanna Trudgian | 80 | 8.6 | -5.7 | |
| Majority | 24 | 2.6 | -4.5 | ||
| Turnout | 929 | 27.3 | +0.1 | ||
| Registered electors | 3,428 | ||||
| Liberal Democrats gain from Conservative | Swing | ||||
Wivenhoe Quay
| Party | Candidate | Votes | % | ±% | |
|---|---|---|---|---|---|
| Labour | Stephen Ford* | 648 | 35.9 | +17.2 | |
| Conservative | Penny Kraft | 646 | 35.7 | -0.9 | |
| Green | Chris Fox | 366 | 20.3 | N/A | |
| Liberal Democrats | Sharon Humphrey | 147 | 8.1 | -8.9 | |
| Majority | 2 | 0.1 | N/A | ||
| Turnout | 1,807 | 44.4 | +0.7 | ||
| Registered electors | 4,125 | ||||
| Labour hold | Swing | ||||
References
- ^ a b "Colchester". BBC News Online. 4 May 2007. Retrieved 29 May 2014.
- ^ "Results - Election 2007". The Times. NewsBank. 5 May 2007. p. 83.
- ^ "Colchester : It's D-day at polls". Essex County Publications. NewsBank. 3 May 2007.
- ^ a b c d "Colchester : Just two votes stop a Tory takeover". Essex County Publications. NewsBank. 4 May 2007.
- ^ a b "Colchester : William stops off on whistle-stop tour". Essex County Publications. NewsBank. 20 April 2007.
- ^ "Is town ripe for the taking by Greens?". Essex County Publications. NewsBank. 21 May 2007.
- ^ a b c d e f g h i j k l m n o p q r s t u v "Election of Borough Councillors for the Wards of Colchester Borough Council: Summary of Results". Colchester Borough Council. Archived from the original on 9 September 2013. Retrieved 29 May 2014.