
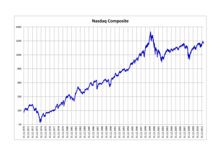
This article is a summary of the closing milestones of the Nasdaq Composite, a United States stock market index. Since first opening at 100.00 on February 5, 1971, the Nasdaq Composite has increased, despite several periods of decline, most recently after the financial crisis.
YouTube Encyclopedic
-
1/3Views:1 12290 7383 840
-
The Nasdaq 100 ETF Closing Over The 50MA Is Super Bullish
-
What is The Nasdaq Stock Exchange?
-
✅ NASDAQ 100 Forecast | NAS100 Analysis | NASDAQ Strategy Analysis | NASDAQ 15h30 strategy
Transcription
Milestone highs and lows
Records
| Category | All-Time Highs | All-Time Lows | ||
|---|---|---|---|---|
| Closing | 16,442.20 | Thursday, April 11, 2024 | 54.87 | Thursday, October 3, 1974 |
| Intraday | 16,538.86 | Thursday, March 21, 2024 | 54.87 | Thursday, October 3, 1974 |
Incremental closing milestones
The following is a list of the milestone closing levels of the Nasdaq Composite. Threshold for milestones is as follows: 10-point increments are used up to the 500-point level; 20 to 1,000; 50 to 3,000; 100 to 10,000; and 200-point increments thereafter. Bold formatting is applied to every 4 or 5 milestones, excluding peaks.
The Early 1970s Bull Market (1971-1972)
| Milestone | Closing Level | Date First Achieved |
|---|---|---|
| 1001 | 100.00 | February 5, 1971 |
| 110 | 110.16 | April 19, 1971 |
| 120 | 120.47 | February 2, 1972 |
| 130 | 130.00 | April 5, 1972 |
The 1980s Bull Market (1978-1987)
| Milestone | Closing Level | Date First Achieved |
|---|---|---|
| 136.842 | 137.09 | September 7, 1978 |
| 140 | 140.02 | July 27, 1979 |
| 150 | 150.04 | August 29, 1979 |
| 160 | 160.70 | January 28, 1980 |
| 170 | 170.48 | July 21, 1980 |
| 180 | 181.70 | August 22, 1980 |
| 190 | 191.31 | September 16, 1980 |
| 200 | 200.25 | November 13, 1980 |
| 210 | 210.18 | March 31, 1981 |
| 220 | 220.24 | May 26, 1981 |
| 230 | 230.19 | November 9, 1982 |
| 240 | 240.65 | December 7, 1982 |
| 250 | 251.65 | February 4, 1983 |
| 260 | 261.29 | February 18, 1983 |
| 270 | 270.37 | March 24, 1983 |
| 280 | 281.60 | April 15, 1983 |
| 290 | 290.84 | April 28, 1983 |
| 300 | 301.64 | May 6, 1983 |
| 310 | 311.39 | May 26, 1983 |
| 320 | 320.04 | June 14, 1983 |
| 330 | 330.00 | January 16, 1986 |
| 340 | 340.80 | February 6, 1986 |
| 350 | 350.20 | February 14, 1986 |
| 360 | 362.00 | March 4, 1986 |
| 370 | 370.40 | March 13, 1986 |
| 380 | 380.80 | April 14, 1986 |
| 390 | 390.00 | April 17, 1986 |
| 400 | 400.20 | May 30, 1986 |
| 410 | 411.20 | July 3, 1986 |
| 420 | 421.00 | February 25, 1987 |
| 430 | 431.40 | March 11, 1987 |
| 440 | 440.80 | August 6, 1987 |
| 450 | 451.60 | August 13, 1987 |
The 1990s Acceleration Bull Market (1989-2000)
| Milestone | Closing Level | Date First Achieved |
|---|---|---|
| 455.803 | 456.90 | August 3, 1989 |
| 460 | 461.70 | August 7, 1989 |
| 470 | 471.30 | September 1, 1989 |
| 480 | 480.70 | October 5, 1989 |
| 490 | 491.20 | April 2, 1991 |
| 500 | 501.62 | April 12, 1991 |
| 520 | 521.06 | August 23, 1991 |
| 540 | 540.94 | October 16, 1991 |
| 560 | 565.71 | December 27, 1991 |
| 580 | 586.34 | December 31, 1991 |
| 600 | 602.29 | January 7, 1992 |
| 620 | 625.75 | January 14, 1992 |
| 640 | 644.92 | February 12, 1992 |
| 660 | 661.60 | December 4, 1992 |
| 680 | 681.85 | January 6, 1993 |
| 700 | 700.77 | January 21, 1993 |
| 720 | 726.89 | August 16, 1993 |
| 740 | 742.84 | August 31, 1993 |
| 760 | 763.66 | September 28, 1993 |
| 780 | 785.41 | October 14, 1993 |
| 800 | 800.47 | January 31, 1994 |
| 820 | 822.63 | March 27, 1995 |
| 840 | 840.95 | April 27, 1995 |
| 860 | 863.06 | May 15, 1995 |
| 880 | 882.85 | June 5, 1995 |
| 900 | 902.68 | June 15, 1995 |
| 920 | 922.09 | June 19, 1995 |
| 940 | 940.09 | June 22, 1995 |
| 960 | 969.76 | July 7, 1995 |
| 980 | 988.63 | July 12, 1995 |
| 1,000 | 1,005.89 | July 17, 1995 |
| 1,050 | 1,051.08 | September 7, 1995 |
| 1,100 | 1,117.11 | February 22, 1996 |
| 1,150 | 1,153.70 | April 22, 1996 |
| 1,200 | 1,202.76 | May 10, 1996 |
| 1,250 | 1,250.87 | October 7, 1996 |
| 1,300 | 1,300.37 | December 3, 1996 |
| 1,350 | 1,364.28 | January 20, 1997 |
| 1,400 | 1,409.21 | May 27, 1997 |
| 1,450 | 1,452.43 | June 24, 1997 |
| 1,500 | 1,502.62 | July 11, 1997 |
| 1,550 | 1,580.63 | July 16, 1997 |
| 1,600 | 1,605.45 | August 4, 1997 |
| 1,650 | 1,656.22 | September 9, 1997 |
| 1,700 | 1,702.41 | October 2, 1997 |
| 1,750 | 1,751.76 | February 23, 1998 |
| 1,800 | 1,812.44 | March 24, 1998 |
| 1,850 | 1,852.96 | April 2, 1998 |
| 1,900 | 1,903.87 | April 21, 1998 |
| 1,950 | 1,965.53 | July 13, 1998 |
| 2,000 | 2,000.56 | July 16, 1998 |
| 2,050 | 2,050.42 | December 9, 1998 |
| 2,100 | 2,138.03 | December 21, 1998 |
| 2,150 | 2,172.54 | December 23, 1998 |
| 2,200 | 2,208.05 | January 4, 1999 |
| 2,250 | 2,251.27 | January 5, 1999 |
| 2,300 | 2,320.86 | January 6, 1999 |
| 2,350 | 2,384.59 | January 11, 1999 |
| 2,400 | 2,408.17 | January 19, 1999 |
| 2,450 | 2,505.89 | January 29, 1999 |
| 2,500 | ||
| 2,550 | 2,560.06 | April 5, 1999 |
| 2,600 | 2,652.05 | April 26, 1999 |
| 2,650 | ||
| 2,700 | 2,706.18 | July 1, 1999 |
| 2,750 | 2,771.86 | July 8, 1999 |
| 2,800 | 2,818.13 | July 14, 1999 |
| 2,850 | 2,864.47 | July 16, 1999 |
| 2,900 | 2,915.95 | October 11, 1999 |
| 2,950 | 2,966.42 | October 29, 1999 |
| 3,000 | 3,028.51 | November 3, 1999 |
| 3,100 | 3,102.29 | November 5, 1999 |
| 3,200 | 3,221.15 | November 12, 1999 |
| 3,300 | 3,347.11 | November 18, 1999 |
| 3,400 | 3,420.50 | November 24, 1999 |
| 3,500 | 3,520.63 | December 3, 1999 |
| 3,600 | 3,620.24 | December 10, 1999 |
| 3,700 | 3,715.06 | December 16, 1999 |
| 3,800 | 3,911.15 | December 21, 1999 |
| 3,900 | ||
| 4,000 | 4,041.46 | December 29, 1999 |
| 4,100 | 4,131.15 | January 3, 2000 |
| 4,200 | 4,235.40 | January 21, 2000 |
| 4,300 | 4,321.77 | February 7, 2000 |
| 4,400 | 4,427.50 | February 8, 2000 |
| 4,500 | 4,548.92 | February 17, 2000 |
| 4,600 | 4,617.65 | February 24, 2000 |
| 4,700 | 4,784.08 | March 1, 2000 |
| 4,800 | 4,914.79 | March 3, 2000 |
| 4,900 | ||
| 5,000 | 5,046.86 | March 9, 2000 |
Do-Over of the Milestones (2002-2015)
| Before the Financial Crisis (2002-2007)
After reaching an intra-day low of 1,108.49 during the Dot-com crash on October 10, 2002, the Nasdaq started to recover with a major setback in the Financial Crisis.
|
After the Financial Crisis (2011-2015)
After the Financial Crisis, Nasdaq started another recovery that ultimately led to the all-time closing high setback in 2000.
|
The 2010s Cyclical Bull Market (2015-2020)
| Milestone | Closing Level | Date First Achieved |
|---|---|---|
| 5,048.624 | 5,056.06 | April 23, 2015 |
| 5,1006 | 5,106.59 | May 27, 2015 |
| 5,132.527 | 5,132.95 | June 18, 2015 |
| 5,200 | 5,210.14 | July 17, 2015 |
| 5,218.868 | 5,221.12 | August 5, 2016 |
| 5,300 | 5,339.52 | September 22, 2016 |
| 5,4009 | 5,417.36 | December 8, 2016 |
| 5,50010 | 5,521.06 | January 6, 2017 |
| 5,600 | 5,600.96 | January 24, 2017 |
| 5,700 | 5,715.18 | February 9, 2017 |
| 5,800 | 5,819.44 | February 15, 2017 |
| 5,900 | 5,904.03 | March 1, 2017 |
| 6,00011 | 6,025.49 | April 25, 2017 |
| 6,100 | 6,100.76 | May 5, 2017 |
| 6,200 | 6,205.26 | May 25, 2017 |
| 6,300 | 6,305.80 | June 2, 2017 |
| 6,400 | 6,410.81 | July 24, 2017 |
| 6,500 | 6,516.72 | October 2, 2017 |
| 6,600 | 6,603.55 | October 11, 2017 |
| 6,700 | 6,701.26 | October 27, 2017 |
| 6,800 | 6,862.48 | November 21, 2017 |
| 6,900 | 6,912.36 | November 28, 2017 |
| 7,00012 | 7,006.90 | January 2, 2018 |
| 7,100 | 7,136.56 | January 5, 2018 |
| 7,200 | 7,211.78 | January 11, 2018 |
| 7,30013 | 7,336.38 | January 19, 2018 |
| 7,400 | 7,408.03 | January 22, 2018 |
| 7,500 | 7,505.77 | January 26, 2018 |
| 7,60014 | 7,606.46 | June 4, 2018 |
| 7,700 | 7,703.79 | June 12, 2018 |
| 7,80015 | 7,823.92 | July 12, 2018 |
| 7,900 | 7,932.24 | July 25, 2018 |
| 8,000 | 8,017.90 | August 27, 2018 |
| 8,100 | 8,109.69 | August 29, 2018 |
| 8,200 | 8,202.53 | July 10, 2019 |
| 8,300 | 8,321.50 | July 24, 2019 |
| 8,400 | 8,433.20 | November 4, 2019 |
| 8,500 | 8,540.83 | November 15, 2019 |
| 8,600 | 8,632.49 | November 25, 2019 |
| 8,700 | 8,705.18 | November 27, 2019 |
| 8,800 | 8,814.23 | December 16, 2019 |
| 8,900 | 8,924.96 | December 20, 2019 |
| 9,000 | 9,022.39 | December 26, 2019 |
| 9,100 | 9,129.24 | January 8, 2020 |
| 9,200 | 9,203.43 | January 9, 2020 |
| 9,300 | 9,357.13 | January 16, 2020 |
| 9,400 | 9,402.48 | January 23, 2020 |
| 9,500 | 9,508.68 | February 5, 2020 |
| 9,600 | 9,628.39 | February 10, 2020 |
| 9,700 | 9,725.96 | February 12, 2020 |
| 9,800 | 9,817.18 | February 19, 2020 |
Bull Recession of 2020
| Milestone | Closing Level | Date First Achieved |
|---|---|---|
| 9,817.1816 | 9,924.75 | June 8, 2020 |
| 9,900 | ||
| 10,000 | 10,020.35 | June 10, 2020 |
| 10,200 | 10,207.63 | July 2, 2020 |
| 10,400 | 10,433.65 | July 6, 2020 |
| 10,600 | 10,617.44 | July 10, 2020 |
| 10,800 | 10,902.80 | August 3, 2020 |
| 11,000 | 11,108.07 | August 6, 2020 |
| 11,200 | 11,210.84 | August 18, 2020 |
| 11,400 | 11,466.47 | August 25, 2020 |
| 11,600 | 11,665.06 | August 26, 2020 |
| 11,800 | 11,939.67 | September 1, 2020 |
| 12,000 | 12,056.44 | September 2, 2020 |
| 12,200 | 12,205.85 | November 27, 2020 |
| 12,400 | 12,464.23 | December 4, 2020 |
| 12,600 | 12,658.19 | December 16, 2020 |
| 12,800 | 12,807.92 | December 22, 2020 |
| 13,000 | 13,067.48 | January 7, 2021 |
| 13,200 | 13,201.97 | January 8, 2021 |
| 13,400 | 13,457.25 | January 20, 2021 |
| 13,600 | 13,635.99 | January 25, 2021 |
| 13,800 | 13,856.30 | February 5, 2021 |
| 14,000 | 14,007.70 | February 9, 2021 |
| 14,200 | 14,253.27 | June 22, 2021 |
| 14,400 | 14,500.51 | June 28, 2021 |
| 14,600 | 14,639.33 | July 2, 2021 |
| 14,800 | 14,836.99 | July 23, 2021 |
| 15,000 | 15,019.80 | August 24, 2021 |
| 15,200 | 15,265.89 | August 30, 2021 |
| 15,400 | 15,448.12 | October 28, 2021 |
| 15,600 | 15,649.60 | November 2, 2021 |
| 15,800 | 15,811.58 | November 3, 2021 |
| 16,000 | 16,057.44 | November 19, 2021 |
| 16,200 | 16,274.94 | March 1, 2024 |
| 16,400 | 16,401.84 | March 21, 2024 |
List of 1000-point milestones by number of trading days
| Milestone[1] (closing) |
Date of Record[1] | Trading Days[1] |
|---|---|---|
| 1,000 | July 7, 1995 | 6,171 |
| 2,000 | July 16, 1998 | 764 |
| 3,000 | November 3, 1999 | 329 |
| 4,000 | December 29, 1999 | 38 |
| 5,000 | March 9, 2000 | 49 |
| 6,000 | April 25, 2017 | 4,308 |
| 7,000 | January 2, 2018 | 174 |
| 8,000 | August 27, 2018 | 164 |
| 9,000 | December 26, 2019 | 335 |
| 10,000 | June 10, 2020 | 114 |
| 11,000 | August 6, 2020 | 40 |
| 12,000 | September 2, 2020 | 19 |
| 13,000 | January 7, 2021 | 87 |
| 14,000 | February 9, 2021 | 22 |
| 15,000 | August 24, 2021 | 136 |
| 16,000 | November 19, 2021 | 62 |
See also
- Closing milestones of the Dow Jones Industrial Average
- Closing milestones of the S&P 500
- List of largest daily changes in the Nasdaq Composite
- Market trend
- Stock market bubble
- Stock market crash
Notes
1This was the Nasdaq's very first close on February 5, 1971.
2This was the Nasdaq's close at the peak on January 11, 1973.
3This was the Nasdaq's close at the peak on August 27, 1987.
4This was the Nasdaq's close at the peak on March 10, 2000.
5This was the Nasdaq's close at the peak on October 31, 2007.
6The Nasdaq first traded above 5,100 on March 10, 2000; however, it took over 15 years for the Nasdaq to finally close above 5,100.
7This was the Nasdaq's all-time intraday high on March 10, 2000, which was finally broken on June 18, 2015.
8This was the Nasdaq's close at the peak on July 20, 2015, before the 2015-16 stock market selloff.
9The Nasdaq first traded above 5,400 during the session on Tuesday, November 29, 2016, but dropped below before the closing. Over the next few days, Nasdaq returned its post-election gains; however, the Nasdaq finally closed above 5,400 on Thursday, December 8, 2016.
10The Nasdaq first exceeded 5,500 intraday on Tuesday, December 27, 2016, before falling back below before closing and then retreated for the next two days, throwing away some of its recent gains. However, it took until January 6 of next year when the Nasdaq finally closed above 5,500.
11Since first reaching 5,000 on March 7, 2000, the Nasdaq slowly crawled its way towards 6,000 with major setbacks over the course of 17 years before finally trading above 6,000 (intraday and closing) on April 25, 2017.
12The Nasdaq first hit 7,000 during the trading session on Monday, December 18, 2017, before falling back underneath the millenary milestone at closing time and then flirted with it the next day before retreating. January 2, 2018 the first trading day of 2018 was when the Nasdaq first closed above 7,000.
13Although the Nasdaq first reached 7,300 intraday on Tuesday, January 16, 2018, the COMP has flirted with the milestone all week and then closed above it three days later.
14The Nasdaq first reached 7,600 on Monday, March 12, 2018, before falling back below it for the close. This was repeated the next trading day before another major pullback for the year. It took until Monday, June 4, 2018 (nearly three months) for the Nasdaq to finally close above 7,600.
15The Nasdaq first topped 7,800 on Wednesday, June 20, 2018, before falling back underneath at closing time before another pullback took place. It took until July 12, 2018, to finally close above this milestone.
16After peaking on February 19, 2020, the Nasdaq Composite rapidly fell into correction later that same month and into bear market territory in the next month amid the COVID-19 pandemic.
References
- ^ a b c DeCambre, Mark (August 6, 2020). "Nasdaq Composite's record rally takes it to fastest 1,000-point milestone in 20 years". Marketwatch. Retrieved August 6, 2020.
- "NASDAQ Composite (^IXIC) Historical Data". Yahoo Finance. Archived from the original on April 22, 2016.