
| J | F | M | A | M | J | J | A | S | O | N | D |
|---|---|---|---|---|---|---|---|---|---|---|---|
5.2 48 38 | 3.9 50 38 | 3.3 54 40 | 2 59 43 | 1.5 66 49 | 1.4 71 53 | 0.6 77 57 | 0.8 78 57 | 1.7 72 54 | 3.9 61 47 | 6.3 52 41 | 5.7 47 37 |
Source: [1]
| J | F | M | A | M | J | J | A | S | O | N | D |
|---|---|---|---|---|---|---|---|---|---|---|---|
132 9 3 | 99 10 3 | 84 12 4 | 50 15 6 | 38 19 9 | 36 22 12 | 16 25 14 | 19 26 14 | 42 22 12 | 99 16 8 | 160 11 5 | 145 8 3 |

The climate of Seattle is temperate, classified in the warm-summer (in contrast to hot-summer) subtype of the Mediterranean zone by the most common climate classification (Köppen: Csb)[2][3][4] although some sources put the city in the oceanic zone (Trewartha: Do).[5][6] It has cool, wet winters and warm, dry summers, covering characteristics of both.[7][8] The climate is sometimes characterized as a "modified Mediterranean" climate because it is cooler and wetter than a "true" Mediterranean climate, but shares the characteristic dry summer and the associated reliance upon cooler-season precipitation (which has a strong influence on the region's vegetation).[9] The city is part of USDA hardiness zone 9a, with surrounding pockets falling under 8b.[10]
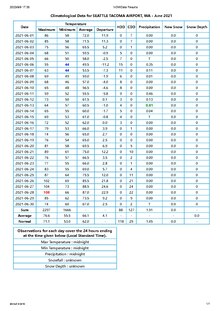
Records for the Seattle City area date back to 1894, with records at Seattle-Tacoma International Airport beginning in 1945, a location notably not within Seattle. Prior to 1945 the official temperatures were observed in locations in downtown Seattle, which tends in general to be somewhat warmer and drier than the airport location.[11] The hottest officially recorded temperature was 108 °F (42 °C) on June 28, 2021; the coldest recorded temperature was 0 °F (−18 °C) on January 31, 1950;[12] the record cold daily maximum is 16 °F (−9 °C) on January 14, 1950, while, conversely, the record warm daily minimum is 73 °F (23 °C) on June 27, 2021.[13]
Seattle generally does not experience many extremes of weather. However, the 21st century has seen a trend towards more extreme high-temperature and large-precipitation events. In July 2009 Seattle's all-time high temperature was broken by a margin of 4 degrees Fahrenheit (2.2 Celsius),[14] then broken again by a margin of 5 F (2.8 C) in June 2021. The single-day precipitation record set in October 2003 saw higher precipitation by nearly 2 inches (50mm) than any other day on record. However, thunderstorms are still rare,[15] as the city reports thunder on just seven days per year.[16] Similarly, the city typically receives at least light snowfall every year, though heavy snowfall is uncommon.
YouTube Encyclopedic
-
1/5Views:32 12571 590610 7241 207 979193 336
-
The Pacific Northwest Climate - Oceanic or Mediterranean?
-
Is it Actually that Rainy in Seattle?
-
Top 10 Reasons NOT to Move to Seattle, Washington
-
Seattle and Vancouver Compared
-
Geology of Seattle and the Puget Sound
Transcription
Temperature
The city's regime of temperature features small seasonal swings, due to its proximity to the ocean. The Pacific ocean, Puget Sound and Lake Washington serve as moderators of the temperature meaning the city is milder than areas inland during the winter and cooler during the summer. Extreme heatwaves are rare, as are cold temperatures. Hot temperature extremes are enhanced by dry, compressed wind from the west slopes of the Cascades,[18] while cold temperatures are generated mainly from the Fraser Valley in British Columbia.[19] Records are taken from the Seattle City area from 1894 to 1944 and at Sea-Tac Airport from 1945.
Averages
In an average year, the temperature will usually be between 21 °F (−6 °C) and 94 °F (34 °C) with temperatures greatly exceeding these values being uncommon. Temperatures above 97 °F (36 °C) and below 15 °F (−9 °C) are very rare, with the last occurrences being June 28, 2021 and November 24, 2010, respectively.[13]
| Climate data for Seattle (Seattle-Tacoma International Airport), 1991–2020 normals | |||||||||||||
|---|---|---|---|---|---|---|---|---|---|---|---|---|---|
| Month | Jan | Feb | Mar | Apr | May | Jun | Jul | Aug | Sep | Oct | Nov | Dec | Year |
| Mean maximum °F (°C) | 57.0 (13.9) |
59.1 (15.1) |
66.4 (19.1) |
74.3 (23.5) |
81.9 (27.7) |
85.8 (29.9) |
91.2 (32.9) |
89.9 (32.2) |
84.1 (28.9) |
72.0 (22.2) |
61.6 (16.4) |
56.8 (13.8) |
94.1 (34.5) |
| Mean daily maximum °F (°C) | 48.0 (8.9) |
50.3 (10.2) |
54.2 (12.3) |
59.3 (15.2) |
66.3 (19.1) |
71.1 (21.7) |
77.4 (25.2) |
77.6 (25.3) |
71.6 (22.0) |
60.5 (15.8) |
52.1 (11.2) |
47.0 (8.3) |
61.3 (16.3) |
| Daily mean °F (°C) | 42.8 (6.0) |
44.0 (6.7) |
47.1 (8.4) |
51.3 (10.7) |
57.5 (14.2) |
62.0 (16.7) |
67.1 (19.5) |
67.4 (19.7) |
62.6 (17.0) |
53.8 (12.1) |
46.5 (8.1) |
42.0 (5.6) |
53.7 (12.1) |
| Mean daily minimum °F (°C) | 37.7 (3.2) |
37.7 (3.2) |
39.9 (4.4) |
43.3 (6.3) |
48.7 (9.3) |
53.0 (11.7) |
56.8 (13.8) |
57.2 (14.0) |
53.6 (12.0) |
47.0 (8.3) |
40.9 (4.9) |
37.1 (2.8) |
46.1 (7.8) |
| Mean minimum °F (°C) | 26.1 (−3.3) |
27.3 (−2.6) |
31.3 (−0.4) |
35.6 (2.0) |
40.6 (4.8) |
46.6 (8.1) |
51.5 (10.8) |
51.7 (10.9) |
45.8 (7.7) |
36.8 (2.7) |
29.2 (−1.6) |
25.4 (−3.7) |
21.5 (−5.8) |
| Source: NOAA[13] | |||||||||||||
Highest daily temperatures
|
Lowest daily temperatures
|
Daily record warm minima
|
Daily record cold maxima
|
Highest averages
|
Lowest averages
|
NOTE: in the tables below, all numbers before 1945 come from locations in downtown Seattle, which tends to be somewhat warmer than the current official location of Sea-Tac airport.[11] To distinguish these older numbers we mark them below in italics.
Precipitation

The city sees frequent, though light rainfall between October and May, with rainfall becoming lighter and sparser between June and September. With many more "rain days" than other major American cities, Seattle has a well-earned reputation for frequent rain.[20] In an average year, at least 0.01 inches (0.25 mm) of precipitation falls on 150 days, more than nearly all U.S. cities east of the Rocky Mountains. In November, Seattle averages more rainfall than any other U.S. city of more than 250,000 people; it also ranks highly in winter precipitation. Conversely, the city receives some of the lowest precipitation amounts of any large city from June to September. Seattle is one of the five rainiest major U.S. cities as measured by the number of days with precipitation.[21][16] However, because Seattle often has merely a light drizzle falling from the sky for many days, it actually receives significantly less rainfall (or other precipitation) overall than many other U.S. cities like New York City, Miami, or Houston. Seattle experiences its heaviest rainfall during November, December, and January, receiving roughly half of its annual rainfall (by volume) during this period. In late fall and early winter, atmospheric rivers (also known as "Pineapple Express" systems), strong frontal systems, and Pacific low-pressure systems are common. Light rain and drizzle are the predominant forms of precipitation during the remainder of the year. For instance, on average, less than 1.6 in (41 mm) of rain falls in July and August combined when rain is less common.
Annually, total precipitation averages 39.3 in (998 mm), with winter being the wettest season and July the driest month. At Sea-Tac, rain has fallen in every month since records began there in January 1945, previously in the Seattle City area, the July's of 1896 and 1922 reported no precipitation. Long stretches of little precipitation can occur. No measurable precipitation, greater than 0.01 inches (0.25 mm), fell between June 18 and August 13, 2017.[22] The city also sees snow, primarily in winter, but sometimes in the late autumn and early spring. Snowfall averages 6.3 in (16.0 cm) per year but is highly variable between winter seasons. The most rainfall in 24 hours was 5.02 in (127.5 mm) on October 20, 2003, and the most snowfall was 21.5 in (55 cm) on February 2, 1916.[13] Seattle typically receives some snowfall on an annual basis but heavy snow is rare. Average annual snowfall, as measured at Sea-Tac Airport, is 6.3 inches (16.0 cm). From winter season to winter season, amounts can be extremely variable.
Due to local variations in microclimate, Seattle also receives significantly lower precipitation than some other locations west of the Cascades. Around 80 mi (130 km) to the west, the Hoh Rain Forest in Olympic National Park on the western flank of the Olympic Mountains receives an annual average precipitation of 142 in (3,600 mm). Sixty miles (97 km) to the south of Seattle, the state capital Olympia, which is out of the Olympic Mountains' rain shadow, receives an annual average precipitation of 50 in (1,270 mm).[13] The city of Bremerton, about 15 mi (24 km) west of downtown Seattle on the other side of the Puget Sound, receives 56.4 in (1,430 mm) of precipitation annually.[13]
One of many exceptions to Seattle's reputation as a damp location occurs in El Niño years, when marine weather systems track as far south as California and less than the usual precipitation falls in the Puget Sound area.[23] However, the El Nino of 2015-2016 caused an increase in rainfall. Since the region's water comes from mountain snow packs during the dry summer months, El Niño winters can not only produce substandard skiing but can result in water rationing and a shortage of hydroelectric power the following summer.[24]
Averages
| Month | Jan | Feb | Mar | Apr | May | Jun | Jul | Aug | Sep | Oct | Nov | Dec | Year |
|---|---|---|---|---|---|---|---|---|---|---|---|---|---|
| Average precipitation inches (mm) | 5.78 (147) |
3.76 (96) |
4.17 (106) |
3.18 (81) |
1.88 (48) |
1.45 (37) |
0.60 (15) |
0.97 (25) |
1.61 (41) |
3.91 (99) |
6.31 (160) |
5.72 (145) |
39.34 (999) |
| Average snowfall inches (cm) | 1.8 (4.6) |
2.2 (5.6) |
0.4 (1.0) |
0 (0) |
0 (0) |
0 (0) |
0 (0) |
0 (0) |
0 (0) |
0 (0) |
0.2 (0.51) |
1.7 (4.3) |
6.3 (16) |
| Average precipitation days (≥ 0.01 in) | 18.7 | 15.9 | 17.1 | 15.0 | 11.3 | 9.2 | 4.7 | 4.9 | 8.3 | 14.3 | 18.4 | 18.4 | 156.2 |
| Average snowy days (≥ 0.1 in) | 1.4 | 1.2 | 0.4 | 0 | 0 | 0 | 0 | 0 | 0 | 0 | 0.2 | 1.5 | 4.7 |
| Source: NOAA[13] | |||||||||||||
Rainfall Extremes
Lowest
|
Highest
|
Snowfall
Highest
Other phenomena Sunshine, UV and daylightThe city generally experiences cloudy conditions, with clear days occurring infrequently. As a result of the city's latitude, it experiences a moderate difference in daylight hours between summer and winter, though is not subject to the extremes of cities further north.[26] The Seattle area is the cloudiest region of the United States, due in part to frequent storms and lows moving in from the adjacent Pacific Ocean. Seattle is cloudy 201 days out of the year and partly cloudy 93 days.[25] (Official weather and climatic data is collected at Seattle–Tacoma International Airport, located about 19 km (12 mi) south of downtown in the city of SeaTac, which is at a higher elevation, and records more cloudy days and fewer partly cloudy days per year.[25])
WindThe Puget Sound Convergence Zone is an important feature of Seattle's weather. In the convergence zone, air arriving from the north meets air flowing in from the south. Both streams of air originate over the Pacific Ocean; airflow is split by the Olympic Mountains to Seattle's west, then reunited to the east. When the air currents meet, they are forced upward, resulting in convection.[28] Thunderstorms caused by this activity are usually weak and can occur north and south of town, but Seattle itself rarely receives more than occasional thunder and small hail showers. The Hanukkah Eve Wind Storm in December 2006 is an exception that brought heavy rain and winds gusting up to 69 mph (111 km/h), an event that was not caused by the Puget Sound Convergence Zone and was widespread across the Pacific Northwest. In December 2007, a strong windstorm brought hurricane force winds and heavy rain, leading to 5 deaths.[29][30] Climate changeBeing a coastal city, Seattle may experience significant effects from rising sea levels. The sea has risen by 6 inches (15 cm) in the past century, and is expected to rise 28 inches (71 cm) by 2100 and 47 inches (120 cm) by 2150. It is expected that by this time, frequent flooding will become a problem, with now-annual extreme king tide's becoming monthly or even daily events.[31] TemperatureThe temperature in Seattle has generally increased steadily and this trend is expected to continue due to anthropogenic warming. For the last century, the average has increased roughly 0.3 degrees Fahrenheit each decade. By the end of the century, it is predicted that there will be on average around two weeks of 90 °F (32 °C) days each year.[31] PrecipitationPrecipitation in the city has increased slightly, but this trend is expected to continue. Extreme rainfall events have become more frequent over the previous years and this trend is also expected to continue.[31] Station data
See or edit raw graph data. Explanatory notes
References
|
|||||||||||||||||||||||||||||||||||||||||||||||||||||||||||||||||||||||||||||||||||||||||||||||||||||||||||||||||||||||||||||||||||||||||||||||||||||||||||||||||||||||||||||||||||||||||||||||||||||||||||||||||||||||||||||||||||||||||||||||||||||||||||||||||||||||||||||||||||||||||||||||||||||||||||||||||||||||||||||||||||||||||||||||||||||||||||||||||||||||||||||||||||||||||||||||||||||||||||||||||||||||||||||||||||||||||||||||||||||
