
| |||||||||||||||||||||||||
11 of the 33 seats to City of Lincoln Council 17 seats needed for a majority | |||||||||||||||||||||||||
|---|---|---|---|---|---|---|---|---|---|---|---|---|---|---|---|---|---|---|---|---|---|---|---|---|---|
| |||||||||||||||||||||||||
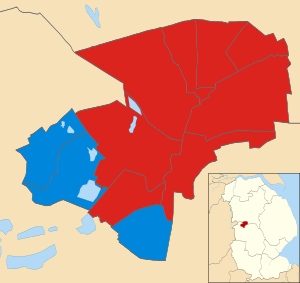 Map showing the results of the 2015 Lincoln City Council elections by ward. Red shows Labour seats and blue shows the Conservatives. | |||||||||||||||||||||||||
| |||||||||||||||||||||||||
The 2015 City of Lincoln Council election took place on 7 May 2015 to elect members of City of Lincoln Council in England.[1] This was on the same day as other local elections.
Overall results
The Labour Party retained its majority on the council, but lost one seat, leaving them with 26 seats to the Conservative Party's 7.[2]
| Party | Seats | Gains | Losses | Net gain/loss | Seats % | Votes % | Votes | +/− | |
|---|---|---|---|---|---|---|---|---|---|
| Labour | 8 | 0 | 1 | 72.7 | 39.9 | 16,211 | |||
| Conservative | 3 | 1 | 0 | 27.3 | 34.1 | 13,855 | |||
| UKIP | 0 | 0 | 0 | 0.0 | 14.1 | 5,718 | |||
| Green | 0 | 0 | 0 | 0.0 | 7.0 | 2,837 | |||
| Liberal Democrats | 0 | 0 | 0 | 0.0 | 4.2 | 1,711 | |||
| TUSC | 0 | 0 | 0 | 0.0 | 0.8 | 330 | |||
All comparisons in vote share are to the corresponding 2011 election.
Ward results
Abbey

| Party | Candidate | Votes | % | |
|---|---|---|---|---|
| Labour | Fay Smith | 1,730 | 42.9% | |
| Conservative | Yaroslav Pustarnakov | 1,034 | 25.7% | |
| UKIP | Chris Butler | 568 | 14.1% | |
| Green | James Bird | 417 | 10.3% | |
| Liberal Democrats | Aarron Smith | 207 | 5.1% | |
| TUSC | Danny Wilkinson | 74 | 1.8% | |
| Turnout | 4,030 | 55.9% | ||
| Labour hold | ||||
Birchwood

| Party | Candidate | Votes | % | |
|---|---|---|---|---|
| Conservative | Eddie Strengiel | 1,409 | 42.2% | |
| Labour | Paul Gowen | 1,185 | 35.5% | |
| UKIP | Tony Wells | 599 | 17.9% | |
| Green | John Radford | 147 | 4.4% | |
| Turnout | 3,340 | 55.3% | ||
| Conservative hold | ||||
Boultham

| Party | Candidate | Votes | % | |
|---|---|---|---|---|
| Labour | Gary Hewson | 1,596 | 44.8% | |
| Conservative | Christopher Reid | 1,110 | 31.1% | |
| UKIP | Tim Richens | 516 | 14.5% | |
| Green | Ryan Brown | 184 | 5.2% | |
| Liberal Democrats | Lynn Pepper | 160 | 4.5% | |
| Turnout | 3,566 | 62.9% | ||
| Labour hold | ||||
Bracebridge

| Party | Candidate | Votes | % | |
|---|---|---|---|---|
| Conservative | Matthew Wilson | 1,603 | 41.2% | |
| Labour | Jane Loffhagen | 1,220 | 31.3% | |
| UKIP | Barry Stonham | 666 | 17.1% | |
| Liberal Democrats | David Gaskell | 236 | 6.1% | |
| Green | Lee Thomas | 169 | 4.3% | |
| Turnout | 3,894 | 66.8% | ||
| Conservative gain from Labour | ||||
Note: This Bracebridge ward seat had been won by the Conservatives the last time it was contested in 2011, but was gained by Labour in a by-election in 2013.
Carholme
| Party | Candidate | Votes | % | |
|---|---|---|---|---|
| Labour | Neil Murray | 2,436 | 44.3% | |
| Conservative | Jamie Bartch | 1,466 | 26.7% | |
| Green | Judith Coops | 713 | 13.0% | |
| UKIP | Mike Wilkinson | 437 | 7.9% | |
| Liberal Democrats | Natasha Chapman | 356 | 6.5% | |
| TUSC | Nick Parker | 91 | 1.7% | |
| Turnout | 5,499 | 66.2% | ||
| Labour hold | ||||
Castle

| Party | Candidate | Votes | % | |
|---|---|---|---|---|
| Labour | Donald Nannestad | 1,553 | 41.2% | |
| Conservative | Alex Hanney | 1,191 | 31.6% | |
| UKIP | David Warde | 498 | 13.2% | |
| Green | Richard Leedham-Green | 283 | 7.5% | |
| Liberal Democrats | Charles Shaw | 190 | 5.0% | |
| TUSC | Michael Hancock | 51 | 1.4% | |
| Turnout | 3,766 | 61.5% | ||
| Labour hold | ||||
Glebe

| Party | Candidate | Votes | % | |
|---|---|---|---|---|
| Labour | Patrick Vaughan | 1,205 | 40.2% | |
| Conservative | Yvonne Bodger | 1,049 | 35.0% | |
| UKIP | Max Smith | 439 | 14.6% | |
| Green | Norman Haigh | 141 | 4.7% | |
| Liberal Democrats | Adam Carnie | 122 | 4.1% | |
| TUSC | Keri Lowe | 42 | 1.4% | |
| Turnout | 2,998 | 54.3% | ||
| Labour hold | ||||
Hartsholme

| Party | Candidate | Votes | % | |
|---|---|---|---|---|
| Conservative | Ron Hills | 1,642 | 46.6% | |
| Labour | Biff Bean | 1,065 | 30.2% | |
| UKIP | Nicola Smith | 566 | 16.1% | |
| Liberal Democrats | Benjamin Atkinson | 137 | 3.9% | |
| Green | Peaceful Warrior | 114 | 3.2% | |
| Turnout | 3,524 | 66.9% | ||
| Conservative hold | ||||
Minster

| Party | Candidate | Votes | % | |
|---|---|---|---|---|
| Labour | Carol Daniel | 1,497 | 40.4% | |
| Conservative | David Gratrick | 1,426 | 38.5% | |
| UKIP | Elaine Warde | 486 | 13.1% | |
| Green | Timothy Taylor | 262 | 7.1% | |
| TUSC | Gavyn Graham | 35 | 0.9% | |
| Turnout | 3,706 | 63.3% | ||
| Labour gain from Conservative | ||||
Moorland

| Party | Candidate | Votes | % | |
|---|---|---|---|---|
| Labour | Bob Bushell | 1,403 | 41.7% | |
| Conservative | David Denman | 1,200 | 35.7% | |
| UKIP | Kevin Harrington | 501 | 14.9% | |
| Green | James Grigg | 134 | 4.0% | |
| Liberal Democrats | Ross Pepper | 125 | 3.7% | |
| Turnout | 3,363 | 58.7% | ||
| Labour hold | ||||
Park

| Party | Candidate | Votes | % | |
|---|---|---|---|---|
| Labour | Chris Burke | 1,321 | 44.4% | |
| Conservative | Tracy Talavia | 725 | 24.4% | |
| UKIP | Hannah Smith | 442 | 14.9% | |
| Green | Kenneth Yates | 273 | 9.2% | |
| Liberal Democrats | Iain Baker | 178 | 6.0% | |
| TUSC | Vince Williams | 37 | 1.2% | |
| Turnout | 2,976 | 52.7% | ||
| Labour hold | ||||
References
- ^ "Upcoming elections & referendums". The Electoral Commission. Archived from the original on 15 March 2015. Retrieved 12 April 2015.
- ^ Steven Ayres (18 June 2015). "Local elections 2015" (PDF). House of Commons Library. p. 19. Archived from the original (PDF) on 8 December 2021. Retrieved 6 November 2019.
| Lincolnshire County Council | |||||||||||||||||||||
|---|---|---|---|---|---|---|---|---|---|---|---|---|---|---|---|---|---|---|---|---|---|
| Boston Borough Council | |||||||||||||||||||||
| East Lindsey District Council | |||||||||||||||||||||
| City of Lincoln Council | |||||||||||||||||||||
| North East Lincolnshire Council | |||||||||||||||||||||
| North Kesteven District Council | |||||||||||||||||||||
| North Lincolnshire Council | |||||||||||||||||||||
| South Holland District Council | |||||||||||||||||||||
| South Kesteven District Council | |||||||||||||||||||||
| West Lindsey District Council | |||||||||||||||||||||
| |||||||||||||||||||||
| |||||||||||||||||||||