

An asteroid spectral type is assigned to asteroids based on their reflectance spectrum, color, and sometimes albedo. These types are thought to correspond to an asteroid's surface composition. For small bodies that are not internally differentiated, the surface and internal compositions are presumably similar, while large bodies such as Ceres and Vesta are known to have internal structure. Over the years, there has been a number of surveys that resulted in a set of different taxonomic systems such as the Tholen, SMASS and Bus–DeMeo classifications.[1]
YouTube Encyclopedic
-
1/5Views:747 380564 797634 973563 0161 164 301
-
Light: Crash Course Astronomy #24
-
Telescopes: Crash Course Astronomy #6
-
Stars: Crash Course Astronomy #26
-
Brown Dwarfs: Crash Course Astronomy #28
-
Economic Systems and Macroeconomics: Crash Course Economics #3
Transcription
Hey, Phil Plait here and this is Crash Course Astronomy. In last week’s episode, I mentioned that nearly all the information we have about the Universe comes in the form of light. But how does that light get made? What can it tell us about these astronomical objects? And honestly, what is light? Here’s a hint. Light is a wave. It took centuries of thought and experiments to figure that out, and to also figure out that, at its most basic, light is a form of energy. It travels in waves, similar to waves of water in the ocean. Except with light, the things doing the waving are electric and magnetic fields. Literally—light is a self-contained little bundle of these two fields, intertwined. That’s why we call light electromagnetic radiation. The details of this are very complex, but we can make some pretty good overall observations about light just from thinking of it as a wave. If you’re floating in the ocean, you’ll move up as a wave passes you, then back down, then back up again when the next wave rolls by. The distance between these crests in the wave is called the wavelength. Since light is a wave, it has a wavelength as well, and this may be its single most important feature. That’s because the energy of light is tied to its wavelength. Light with a shorter wavelength has more energy, and light with a longer wavelength has less energy. And our eyes have a really convenient way of detecting these different energies: color! What you think of as the color violet is actually light hitting your eye that has a short wavelength. Red light has a longer wavelength, about twice the distance between crests as violet light. All the colors in between—orange, yellow, green, blue—have intermediate wavelengths. This spread of colors, wavelengths, is called a spectrum. Over millions of years, our eyes have evolved to detect the kind of light the Sun emits most strongly. Well, that makes sense; that makes it easier for us to see! We call this kind of light visible light. But that’s just the narrowest sampling of all the different wavelengths light can have. If light has a slightly shorter wavelength than what our eyes can see, it’s invisible to us, but it’s still real. We call that ultraviolet light. Light with shorter wavelengths than that fall into the X-ray part of the spectrum, and light waves with the shortest wavelengths of all are called gamma rays. At the other end, light with slightly longer wavelengths than the reddest color we can see is called infrared light. Light waves longer than that are called microwaves, and those with the longest wavelengths of all are called radio waves. These different groups don’t really have hard and fast definitions; just think of them as general guidelines. But together, we call all of these different kinds of light the electromagnetic or EM spectrum. And remember, energy goes up when the wavelength gets shorter. So ultraviolet light has a higher energy than violet, X-rays have a higher energy than that, and gamma rays have the highest energy of all. Infrared light has lower energy than red light, microwaves lower than that, and radio waves have the lowest energy. When you look at the whole EM spectrum, you’ll probably notice that we really do only see a teeny little sliver of it. Most of the Universe is invisible to our eyes! That’s why we build different kinds of telescopes -- to detect the kind of light our eyes can’t detect. They let us see a lot of stuff that otherwise we’d never notice. So you might be asking: how is light made? Well, one of the most basic properties of matter is that when you heat it up it gains energy, and then it tries to get rid of that energy. Since light is energy, one way to get rid of energy is to emit light. Another important property of matter is that the kind of light an object emits depends on its temperature. An object that’s hotter will emit light with a higher energy, that is, a shorter wavelength. Cooler objects give off light with a longer wavelength. You may have seen this in action. Heat up an iron bar and it starts to glow red, then orange, then yellow as it gets hotter. The color, the wavelength, of light emitted changes as the bar heats up. Astronomers use a shorthand for this. We say that light with a shorter wavelength is “bluer”, and light with a longer wavelength is “redder”. Don’t take this literally! We don’t really mean more blue or more red, just that the wavelengths are decreasing or increasing. So in this lingo, ultraviolet light is bluer than blue, and X-rays are bluer than ultraviolet. So objects that are more energetic, that have a higher temperature, are bluer than cooler, redder objects. This rule of thumb works really well for dense objects like iron bars and stars. Even humans! You emit light, but it’s in the far infrared, well beyond what our eyes can see. There are less dense objects in space, too, like gas clouds, and the way they emit light is different. To understand that, we have to zoom in on them. Way, way in, and look at their individual atoms. And to understand that, we need to take a brief diversion into atomic structure. Atoms are the building blocks of matter. In general, atoms are made up of three subatomic particles: Protons, neutrons, and electrons. Protons have a positive electric charge, electrons a negative charge, and neutrons are neutral. Protons and neutrons are much more massive than electrons, and occupy the centers of atoms, in what’s called the nucleus. Electrons whiz around the nucleus, their negative charge attracted by the protons’ positive charge. The type of atom depends on how many protons it has in the nucleus. Hydrogen has one proton, helium two, lithium three, and so on up the periodic table of elements. It’s common to think of the electron as orbiting the nucleus like a planet orbits the Sun, but that’s not really the case. The real situation is fiendishly complex and involves pretty hairy quantum mechanics, but in the end, the electron is only allowed to occupy very specific volumes of space around the nucleus, and those depend on the electron’s energy. Think of these like stairs on a staircase, where the landing is the nucleus. When you walk up the stairs, you have to use energy to go up. And when you do, you have to go up a whole step at a time; if you don’t have the energy to get to the next step, you can’t move. You can be on the first step, or the second step, but you can’t be on the first-and-a-halfths step. There isn’t one! Electrons are the same way. They whiz around the nucleus with a very discrete amount of energy. If you give them an additional precise amount of energy, they’ll move up to the next energy level, the next step, but if you give them the wrong amount they’ll just sit there. The opposite is true as well; electrons can be in a higher energy state, up on a higher step, and then give off energy when they jump down. The amount they give off is exactly the same amount needed to get them to jump up in the first place. How do they get this energy? Light! If light hitting the atom has just the right amount of energy, the electron will absorb it and jump up. It can also jump down and emit light at that energy, too. An electron can also jump two steps, or three, or whatever, but it needs exactly the right energy to do it. But as I said earlier, energy and wavelength are the same thing, and that’s equivalent to color. So when an electron jumps up or down, it absorbs or emits a very specific color of light. Not only that, but the steps are different for different atoms. To stick with our analogy, it’s like different atoms are different staircases, with different heights between the steps. So when an electron jumps down a step in a hydrogen atom, it emits a different energy, a different color of light, than an electron jumping down in a helium or calcium atom. And this, THIS, is the key to the Universe. Because different atoms emit different colors of light, if we can measure that light, in principle we can determine what an object is made of, even if we can’t touch it. Even if it’s a bazillion light years away! And we can. Can you tell the difference between these two squares? They’re a very slightly different shade of red. Your eye probably can’t tell the difference, but a spectrometer can. This is a device that can precisely measure the wavelength of light, and can for example distinguish light emitted by a hydrogen atom from light emitted by helium. When you hook one of these spectrometers up to a telescope, you can figure out what astronomical objects are made of. In the case of thin gas clouds in space, the atoms are basically floating free, rarely bumping into one another. The atoms emit those individual colors of light, allowing us to identify them. Unlike dense stars, the color of the thinner gas depends more on what’s in it than its temperature. And this is how we learned what the Universe is made of. Stars and gas clouds in space are mostly hydrogen, with some helium and heavier elements thrown in. Jupiter has methane in its atmosphere, Venus carbon dioxide. Everything in the Universe has its own mix of ingredients, like cakes at a bakery. With spectroscopy, we can taste them. But wait! There’s more. You’re probably familiar with the Doppler effect; the change in pitch when, say, a motorcycle goes by. In sound, the wavelength defines the pitch; higher tones (“eeeee”) have shorter wavelengths, and lower tones (“eeeee”) longer wavelengths. When the motorcycle is headed toward you, the sound waves get compressed, causing the pitch to rise. After it passes you, the pitch drops because the wavelengths get stretched out. The same thing happens with light. If an object is headed toward you, the wavelength of light from the source gets compressed, shorter. We say the light is blue-shifted. If it heads away, the wavelength gets longer, and it’s red-shifted. Apply that to a spectrum, and by measuring that shift we can tell if an object is moving toward or away from us. Here’s a teaser: This becomes super important later, when we talk about galaxies. Spoiler alert: The Universe is expanding, and it's this redshift that allowed us to figure that out. And that’s still not the end of it. With other spectroscopic techniques we can determine if an object is spinning and how fast, whether it has a magnetic field and how strong it is, and even how massive and dense an object is. A vast amount of the fundamental properties of astronomical objects can be found just by dissecting their light into individual colors. Almost everything we know about the Universe comes from the light objects in it give off. Pictures of astronomical objects show us their structure, their beauty, and hint at their history. But with spectra, we can examine their blueprints. Today you learned that light is a form of energy. Its wavelength tells us its energy and color. Spectroscopy allows us to analyze those colors and determine an object’s temperature, density, spin, motion, and chemical composition. Crash Course is produced in association with PBS Digital Studios. Head over to their channel for even more awesome videos. This episode was written by me, Phil Plait. The script was edited by Blake de Pastino, and our consultant is Dr. Michelle Thaller. It was directed by Nicholas Jenkins, the script supervisor and editor is Nicole Sweeney, the sound designer was Michael Aranda, and the graphics team is Thought Café.
Taxonomic systems
In 1975, astronomers Clark R. Chapman, David Morrison, and Ben Zellner developed a simple taxonomic system for asteroids based on color, albedo, and spectral shape. The three categories were labelled "C" for dark carbonaceous objects, "S" for stony (silicaceous) objects, and "U" for those that did not fit into either C or S.[2] This basic division of asteroid spectra has since been expanded and clarified.[3] A number of classification schemes are currently in existence,[4] and while they strive to retain some mutual consistency, quite a few asteroids are sorted into different classes depending on the particular scheme. This is due to the use of different criteria for each approach. The two most widely used classifications are described below:
Overview of Tholen and SMASS
| Tholen Class | SMASSII (Bus Class) |
Albedo | Spectral Features |
|---|---|---|---|
| A | A | moderate | Very steep red slope shortward of 0.75 μm; moderately deep absorption feature longward of 0.75 μm. |
| B, F | B | low | Linear, generally featureless spectra. Differences in UV absorption features and presence/absence of narrow absorption feature near 0.7 μm. |
| C, G | C, Cb, Ch, Cg, Chg | low | Linear, generally featureless spectra. Differences in UV absorption features and presence/absence of narrow absorption feature near 0.7 μm. |
| D | D | low | Relatively featureless spectrum with very steep red slope. |
| E, M, P | X, Xc, Xe, Xk | from low (P) to very high (E) |
Generally featureless spectrum with reddish slope; differences in subtle absorption features and/or spectral curvature and/or peak relative reflectance. |
| Q | Q | moderate | Reddish slope shortward of 0.7 μm; deep, rounded absorption feature longward of 0.75 μm. |
| R | R | moderate | Moderate reddish slope downward of 0.7 μm; deep absorption longward of 0.75 μm. |
| S | S, Sa, Sk, Sl, Sq, Sr | moderate | Moderately steep reddish slope downward of 0.7 μm; moderate to steep absorption longward of 0.75 μm; peak of reflectance at 0.73 μm. Bus subgroups intermediate between S and A, K, L, Q, R classes. |
| T | T | low | Moderately reddish shortward of 0.75 μm; flat afterward. |
| V | V | moderate | Reddish shortward of 0.7 μm; extremely deep absorption longward of 0.75 μm. |
| — | K | moderate | Moderately steep red slope shortward of 0.75 μm; smoothly angled maximum and flat to blueish longward of 0.75 μm, with little or no curvature. |
| — | L, Ld | moderate | Very steep red slope shortward of 0.75 μm; flat longward of 0.75 μm; differences in peak level. |
| — | O | — | Peculiar trend, known so far for very few asteroids. |
S3OS2 classification
The Small Solar System Objects Spectroscopic Survey (S3OS2 or S3OS2, also known as the Lazzaro classification) observed 820 asteroids, using the former ESO 1.52-metre telescope at La Silla Observatory during 1996–2001.[1] This survey applied both the Tholen and Bus–Binzel (SMASS) taxonomy to the observed objects, many of which had previously not been classified. For the Tholen-like classification, the survey introduced a new "Caa-type", which shows a broad absorption band associated indicating an aqueous alteration of the body's surface. The Caa class corresponds to Tholen's C-type and to the SMASS' hydrated Ch-type (including some Cgh-, Cg-, and C-types), and was assigned to 106 bodies or 13% of the surveyed objects. In addition, S3OS2 uses the K-class for both classification schemes, a type which does not exist in the original Tholen taxonomy.[1]
Bus–DeMeo classification
The Bus-DeMeo classification is an asteroid taxonomic system designed by Francesca DeMeo, Schelte Bus and Stephen Slivan in 2009.[6] It is based on reflectance spectrum characteristics for 371 asteroids measured over the wavelength 0.45–2.45 micrometers. This system of 24 classes introduces a new "Sv"-type and is based upon a principal component analysis, in accordance with the SMASS taxonomy, which itself is based upon the Tholen classification.[6]
Tholen classification
The most widely used taxonomy is that of David J. Tholen, first proposed in 1984. This classification was developed from broad band spectra (between 0.31 μm and 1.06 μm) obtained during the Eight-Color Asteroid Survey (ECAS) in the 1980s, in combination with albedo measurements.[7] The original formulation was based on 978 asteroids. The Tholen scheme includes 14 types with the majority of asteroids falling into one of three broad categories, and several smaller types (also see § Overview of Tholen and SMASS above). The types are, with their largest exemplars in parentheses:
C-group
- Asteroids in the C-group are dark, carbonaceous objects. Most bodies in this group belong to the standard C-type (e.g., 10 Hygiea), and the somewhat "brighter" B-type (2 Pallas). The F-type (704 Interamnia) and G-type (1 Ceres) are much rarer. Other low-albedo classes are the D-types (624 Hektor), typically seen in the outer asteroid belt and among the Jupiter trojans, as well as the rare T-type asteroids (96 Aegle) from the inner main-belt.
S-group
- Asteroids with an S-type (15 Eunomia, 3 Juno) are silicaceous (or "stony") objects. Another large group are the stony-like V-type (4 Vesta), also known as "vestoids" most common among the members of the large Vesta family, thought to have originated from a large impact crater on Vesta. Other small classes include the A-type (246 Asporina), Q-type (1862 Apollo), and R-type asteroids (349 Dembowska).
X-group
- The umbrella group of X-type asteroid can be further divided into three subgroups, depending on the degree of the object's reflectivity (dark, intermediate, bright). The darkest ones are related to the C-group, with an albedo below 0.1. These are the "primitive" P-type (259 Aletheia, 190 Ismene), which differ from the "metallic" M-type (16 Psyche) with an intermediate albedo of 0.10 to 0.30, and from the bright "enstatite" E-type asteroid, mostly seen among the members of the Hungaria family in the innermost region of the asteroid belt.
Taxonomic features
The Tholen taxonomy may encompass up to four letters (e.g. "SCTU"). The classification scheme uses the letter "I" for "inconsistent" spectral data, and should not be confused with a spectral type. An example is the Themistian asteroid 515 Athalia, which, at the time of classification was inconsistent, as the body's spectrum and albedo was that of a stony and carbonaceous asteroid, respectively.[8] When the underlying numerical color analysis was ambiguous, objects were assigned two or three types rather than just one (e.g. "CG" or "SCT"), whereby the sequence of types reflects the order of increasing numerical standard deviation, with the best fitting spectral type mentioned first.[8] The Tholen taxonomy also has additional notations, appended to the spectral type. The letter "U" is a qualifying flag, used for asteroids with an "unusual" spectrum, that falls far from the determined cluster center in the numerical analysis. The notation ":" (single colon) and "::" (two colons) are appended when the spectral data is "noisy" or "very noisy", respectively. For example, the Mars-crosser 1747 Wright has an "AU:" class, which means that it is an A-type asteroid, though with an unusual and noisy spectrum.[8]
SMASS classification
This is a more recent taxonomy introduced by American astronomers Schelte Bus and Richard Binzel in 2002, based on the Small Main-Belt Asteroid Spectroscopic Survey (SMASS) of 1,447 asteroids.[9] This survey produced spectra of a far higher resolution than ECAS (see Tholen classification above), and was able to resolve a variety of narrow spectral features. However, a somewhat smaller range of wavelengths (0.44 μm to 0.92 μm) was observed. Also, albedos were not considered. Attempting to keep to the Tholen taxonomy as much as possible given the differing data, asteroids were sorted into the 26 types given below. As for the Tholen taxonomy, the majority of bodies fall into the three broad C, S, and X categories, with a few unusual bodies categorized into several smaller types (also see § Overview of Tholen and SMASS above):
- C-group of carbonaceous objects includes the C-type asteroid, the most "standard" of the non-B carbonaceous objects, the "brighter" B-type asteroid largely overlapping with the Tholen B- and F types, the Cb-type that transition between the plain C- and B-type objects, and the Cg, Ch, and Cgh-types that are somewhat related to the Tholen G-type. The "h" stands for "hydrated".
- S-group of silicaceous (stony) objects includes the most common S-type asteroid, as well as the A-, Q-, and R-types. New classes include the K-type (181 Eucharis, 221 Eos) and L-type (83 Beatrix) asteroids. There are also five classes, Sa, Sq, Sr, Sk, and Sl that transition between plain the S-type and the other corresponding types in this group.
- X-group of mostly metallic objects. This includes the most common X-type asteroids as well as the M, E, or P-type as classified by Tholen. The Xe, Xc, and Xk are transitional types between the plain X- and the corresponding E, C and K classes.
- Other spectral classes include the T-, D-, and V-types (4 Vesta). The Ld-type is a new class and has more extreme spectral features than the L-type asteroid. The new class of O-type asteroids has since only been assigned to the asteroid 3628 Božněmcová.
A significant number of small asteroids were found to fall in the Q, R, and V types, which were represented by only a single body in the Tholen scheme. In the Bus and Binzel SMASS scheme only a single type was assigned to any particular asteroid.[citation needed]
Color indices
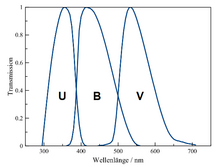
The characterization of an asteroid includes the measurement of its color indices derived from a photometric system. This is done by measuring the object's brightness through a set of different, wavelength-specific filters, so-called passbands. In the UBV photometric system, which is also used to characterize distant objects in addition to classical asteroids, the three basic filters are:
- U: passband for the ultraviolet light, (~320-380 nm, mean 364 nm)
- B: passband for the blue light, including some violet, (~395-500 nm, mean 442 nm)
- V: passband sensitive to visible light, more specifically the green-yellow portion of the visible light (~510-600 nm, mean 540 nm)
| Colors | violet | blue | cyan | green | yellow | orange | red |
|---|---|---|---|---|---|---|---|
| Wavelengths | 380–450 nm | 450–495 nm | 495–520 nm | 520–570 nm | 570–590 nm | 590–620 nm | 620–750 nm |
In an observation, the brightness of an object is measured twice through a different filter. The resulting difference in magnitude is called the color index. For asteroids, the U−B or B−V color indices are the most common ones. In addition, the V−R, V−I and R−I indices, where the photometric letters stand for visible (V), red (R) and infrared (I), are also used. A photometric sequence such as V–R–B–I can be obtained from observations within a few minutes.[10]
| Color index | Plutinos | Cubewanos | Centaurs | SDOs | Comets | Jupiter trojans |
|---|---|---|---|---|---|---|
| B−V | 0.895±0.190 | 0.973±0.174 | 0.886±0.213 | 0.875±0.159 | 0.795±0.035 | 0.777±0.091 |
| V−R | 0.568±0.106 | 0.622±0.126 | 0.573±0.127 | 0.553±0.132 | 0.441±0.122 | 0.445±0.048 |
| V−I | 1.095±0.201 | 1.181±0.237 | 1.104±0.245 | 1.070±0.220 | 0.935±0.141 | 0.861±0.090 |
| R−I | 0.536±0.135 | 0.586±0.148 | 0.548±0.150 | 0.517±0.102 | 0.451±0.059 | 0.416±0.057 |
Appraisal
These classification schemes are expected to be refined and/or replaced as further research progresses. However, for now the spectral classification based on the two above coarse resolution spectroscopic surveys from the 1990s is still the standard. Scientists have been unable to agree on a better taxonomic system, largely due to the difficulty of obtaining detailed measurements consistently for a large sample of asteroids (e.g. finer resolution spectra, or non-spectral data such as densities would be very useful).[citation needed]
Correlation with meteorite types
Some groupings of asteroids have been correlated with meteorite types:[citation needed]
- C-type – Carbonaceous chondrite meteorites
- S-type – Stony meteorites
- M-type – Iron meteorites
- V-type – HED meteorites
See also
References
- ^ a b c Lazzaro, D.; Angeli, C. A.; Carvano, J. M.; Mothé-Diniz, T.; Duffard, R.; Florczak, M. (November 2004). "S3OS2: the visible spectroscopic survey of 820 asteroids" (PDF). Icarus. 172 (1): 179–220. Bibcode:2004Icar..172..179L. doi:10.1016/j.icarus.2004.06.006. Retrieved 22 December 2017.
- ^ Chapman, C. R.; Morrison, D.; Zellner, B. (May 1975). "Surface properties of asteroids - A synthesis of polarimetry, radiometry, and spectrophotometry". Icarus. 25 (1): 104–130. Bibcode:1975Icar...25..104C. doi:10.1016/0019-1035(75)90191-8.
- ^ Thomas H. Burbine: Asteroids – Astronomical and Geological Bodies. Cambridge University Press, Cambridge 2016, ISBN 978-1-10-709684-4, p.163, Asteroid Taxonomy
- ^ Bus, S. J.; Vilas, F.; Barucci, M. A. (2002). "Visible-wavelength spectroscopy of asteroids". Asteroids III. Tucson: University of Arizona Press. p. 169. ISBN 978-0-8165-2281-1.
- ^ Cellino, A.; Bus, S. J.; Doressoundiram, A.; Lazzaro, D. (March 2002). "Spectroscopic Properties of Asteroid Families" (PDF). Asteroids III: 633–643. Bibcode:2002aste.book..633C. doi:10.2307/j.ctv1v7zdn4.48. Retrieved 27 October 2017.
- ^ a b DeMeo, Francesca E.; Binzel, Richard P.; Slivan, Stephen M.; Bus, Schelte J. (July 2009). "An extension of the Bus asteroid taxonomy into the near-infrared" (PDF). Icarus. 202 (1): 160–180. Bibcode:2009Icar..202..160D. doi:10.1016/j.icarus.2009.02.005. Archived from the original on 17 March 2014. Retrieved 28 March 2018. (Catalog at PDS)
- ^ Tholen, D. J. (1989). "Asteroid taxonomic classifications". Asteroids II. Tucson: University of Arizona Press. pp. 1139–1150. ISBN 978-0-8165-1123-5.
- ^ a b c David J. Tholen. "Taxonomic Classifications Of Asteroids – Notes". Retrieved 6 January 2019.
- ^ Bus, Schelte J.; Binzel, Richard P. (July 2002). "Phase II of the Small Main-Belt Asteroid Spectroscopic Survey. A Feature-Based Taxonomy". Icarus. 158 (1): 146–177. Bibcode:2002Icar..158..146B. doi:10.1006/icar.2002.6856.
- ^ a b Fornasier, S.; Dotto, E.; Hainaut, O.; Marzari, F.; Boehnhardt, H.; De Luise, F.; et al. (October 2007). "Visible spectroscopic and photometric survey of Jupiter Trojans: Final results on dynamical families". Icarus. 190 (2): 622–642. arXiv:0704.0350. Bibcode:2007Icar..190..622F. doi:10.1016/j.icarus.2007.03.033. S2CID 12844258.
External links
- Asteroid spectrum classification using Bus-DeMeo taxonomy, Planetary Spectroscopy at MIT (2017)
| Main | |||||||||
|---|---|---|---|---|---|---|---|---|---|
| Distribution |
| ||||||||
| Classification |
| ||||||||
| Exploration | |||||||||
| Lists | |||||||||
| Related | |||||||||