
Bonheiden | |
|---|---|
 | |
 Flag  Coat of arms | |
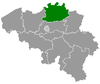
Location of Bonheiden  | |
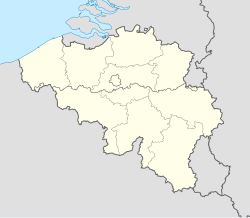 Bonheiden Location in Belgium
Location of Bonheiden in the province of Antwerp 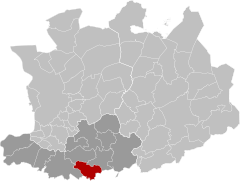 | |
| Coordinates: 51°02′N 04°32′E / 51.033°N 4.533°E | |
| Country | |
| Community | Flemish Community |
| Region | Flemish Region |
| Province | Antwerp |
| Arrondissement | Mechelen |
| Government | |
| • Mayor | Lode Van Looy (BR) |
| • Governing party/ies | BR, CD&V, Open VLD |
| Area | |
| • Total | 29.19 km2 (11.27 sq mi) |
| Population (2020-01-01)[1] | |
| • Total | 15,078 |
| • Density | 520/km2 (1,300/sq mi) |
| Postal codes | 2820 |
| NIS code | 12005 |
| Area codes | 015 |
| Website | www.bonheiden.be |
Bonheiden (Dutch pronunciation: [bɔnˈɦɛi̯də(n)] ⓘ) is a municipality located in the Belgian province of Antwerp. The municipality comprises the towns of Bonheiden proper and Rijmenam. In 2021, Bonheiden had a total population of 15,177. The total area is 29.27 km2 (11.30 sq mi).[2]
Climate
| Climate data for Bonheiden (1991−2020 normals) | |||||||||||||
|---|---|---|---|---|---|---|---|---|---|---|---|---|---|
| Month | Jan | Feb | Mar | Apr | May | Jun | Jul | Aug | Sep | Oct | Nov | Dec | Year |
| Mean daily maximum °C (°F) | 6.8 (44.2) |
7.7 (45.9) |
11.3 (52.3) |
15.6 (60.1) |
19.1 (66.4) |
21.9 (71.4) |
24.0 (75.2) |
23.8 (74.8) |
20.2 (68.4) |
15.5 (59.9) |
10.5 (50.9) |
7.1 (44.8) |
15.3 (59.5) |
| Daily mean °C (°F) | 4.0 (39.2) |
4.4 (39.9) |
7.2 (45.0) |
10.4 (50.7) |
14.1 (57.4) |
17.0 (62.6) |
19.1 (66.4) |
18.7 (65.7) |
15.4 (59.7) |
11.5 (52.7) |
7.4 (45.3) |
4.5 (40.1) |
11.2 (52.2) |
| Mean daily minimum °C (°F) | 1.3 (34.3) |
1.2 (34.2) |
3.0 (37.4) |
5.2 (41.4) |
9.0 (48.2) |
12.1 (53.8) |
14.2 (57.6) |
13.6 (56.5) |
10.6 (51.1) |
7.5 (45.5) |
4.4 (39.9) |
2.0 (35.6) |
7.0 (44.6) |
| Average precipitation mm (inches) | 68.0 (2.68) |
60.3 (2.37) |
54.2 (2.13) |
41.8 (1.65) |
55.7 (2.19) |
72.9 (2.87) |
75.6 (2.98) |
79.9 (3.15) |
65.8 (2.59) |
64.6 (2.54) |
71.9 (2.83) |
82.9 (3.26) |
793.7 (31.25) |
| Average precipitation days (≥ 1.0 mm) | 12.2 | 11.3 | 10.6 | 8.7 | 9.8 | 9.9 | 10.3 | 10.2 | 9.7 | 10.5 | 11.9 | 13.5 | 128.6 |
| Mean monthly sunshine hours | 61 | 76 | 132 | 185 | 213 | 215 | 220 | 207 | 162 | 117 | 67 | 51 | 1,705 |
| Source: Royal Meteorological Institute[3] | |||||||||||||
Notable people
- John Cordier (1942–2002), founder of Telindus
- Luc Van Den Brande (1945), Flemish politician
- Staf Van Eyken (1951), convicted serial killer
- Wouter Van Besien (1972), Flemish politician
- Kurt Mollekens (1973), racing driver
- Sven Nys (1976), cyclo-cross rider
- Inge Vervotte (December 1977), Belgian politician
- Dave McCullen (1977), Belgian deejay
- Niels Albert (1986), cyclo-cross rider
- Sofie Van Houtven (1987), footballer
- Koen Casteels (1992), footballer
- Lisa Vaelen (2004), Belgian gymnast
References
- ^ "Bevolking per gemeente op 1 januari 2020". Statbel.
- ^ "Bevolking per statistische sector - Sector 12005". Statistics Belgium. Retrieved 9 May 2022.
- ^ "Luchttemperatuur en neerslag Referentieperiode: 1991-2020" (PDF) (in Dutch). Royal Meteorological Institute. Retrieved 8 July 2022.
External links
 Media related to Bonheiden at Wikimedia Commons
- Official website (Dutch only)
Places adjacent to Bonheiden | ||||||||||||||||
|---|---|---|---|---|---|---|---|---|---|---|---|---|---|---|---|---|
| ||||||||||||||||
| International | |
|---|---|
| National | |
| Geographic | |
This Antwerp Province location article is a stub. You can help Wikipedia by expanding it. |