
Bassetlaw District Council elections are held every four years. Prior to 2015, elections were generally held three years out of every four, with a third of the council being elected each time. Bassetlaw District Council is the local authority for the non-metropolitan district of Bassetlaw in Nottinghamshire, England. Since the last boundary changes in 2002, 48 councillors have been elected from 25 wards.[1]
Council elections
| Year | Party in control | Turnout | SEATS | VOTE % | Notes | |||||||||
|---|---|---|---|---|---|---|---|---|---|---|---|---|---|---|
| Lab | Con | LD | Ind | Oth | Lab | Con | LD | Ind | Oth | |||||
| 1973 | Labour | 48.1% | 29 | 11 | 0 | 11 | 43.9% | 24.4% | 0.0% | 27.8% | 3.8% | |||
| 1976 | No overall control | 47.3% | 18 | 24 | 0 | 9 | 31.9% | 37.8% | 5.9% | 17.6% | 6.8% | |||
| 1979 | Labour | 76.9% | 29 | 17 | 0 | 4 | 46.6% | 37.3% | 5.5% | 8.5% | 2.1% | New ward boundaries | ||
| 1980 | Labour | 43.2% | 31 | 15 | 0 | 4 | 53.7% | 30.6% | 4.7% | 9.4% | 1.7% | |||
| 1982 | Labour | 40.5% | 28 | 14 | 1 | 7 | 37.1% | 34.9% | 23.9% | 4.0% | 0.0% | |||
| 1983 | Labour | 45.4% | 27 | 19 | 1 | 3 | 46.0% | 37.5% | 13.6% | 2.9% | 0.0% | |||
| 1984 | Labour | 46.3% | 26 | 17 | 0 | 7 | 52.3% | 36.6% | 9.8% | 0.9% | 0.4% | |||
| 1986 | Labour | 43.8% | 27 | 19 | 0 | 4 | 49.2% | 33.3% | 11.8% | 2.2% | 3.5% | |||
| 1987 | Labour | 48.1% | 27 | 18 | 0 | 1 | 45.8% | 33.2% | 14.4% | 3.7% | 2.9% | |||
| 1988 | Labour | 42.1% | 26 | 19 | 0 | 5 | 55.8% | 35.9% | 4.4% | 0.6% | 3.4% | |||
| 1990 | Labour | 50.2% | 29 | 15 | 1 | 5 | 61.6% | 27.3% | 6.8% | 3.4% | 0.9% | |||
| 1991 | Labour | 42.2% | 29 | 15 | 1 | 5 | 51.4% | 27.6% | 7.7% | 11.7% | 1.6% | |||
| 1992 | Labour | 36.6% | 30 | 17 | 1 | 2 | 44.9% | 43.3% | 6.6% | 5.2% | 0.0% | |||
| 1994 | Labour | 39.6% | 30 | 16 | 2 | 2 | 59.1% | 23.5% | 9.9% | 7.6% | 0.0% | |||
| 1995 | Labour | 35.2% | 33 | 12 | 2 | 3 | 62.1% | 25.1% | 6.4% | 3.4% | 3.0% | |||
| 1996 | Labour | 29.9% | 34 | 6 | 3 | 5 | 59.1% | 22.5% | 5.9% | 12.4% | 0.0% | |||
| 1998 | Labour | 25.7% | 35 | 8 | 3 | 4 | 54.1% | 35.4% | 8.6% | 0.0% | 2.0% | |||
| 1999 | Labour | 26.3% | 32 | 12 | 3 | 3 | 50.3% | 34.9% | 8.4% | 3.6% | 2.8% | |||
| 2000 | Labour | 25.8% | 31 | 14 | 3 | 2 | 44.6% | 41.8% | 10.1% | 2.5% | 1.0% | |||
| 2002 | Labour | 29.7% | 28 | 16 | 3 | 1 | 41.1% | 40.0% | 8.3% | 7.6% | 3.0% | New ward boundaries | ||
| 2003 | Labour | 27.3% | 25 | 19 | 2 | 2 | 38.3% | 40.1% | 6.9% | 11.8% | 2.9% | |||
| 2004 | No overall control | 42.1% | 18 | 24 | 1 | 5 | 42.2% | 40.9% | 4.5% | 12.4% | - | |||
| 2006 | Conservative | 40.4% | 14 | 28 | 1 | 5 | 46.3% | 46.4% | - | 6.5% | 0.8% | |||
| 2007 | Conservative | 32.1% | 16 | 27 | 0 | 5 | 45.9% | 46.8% | 0.7% | 6.6% | - | |||
| 2008 | Conservative | 32.3% | 16 | 30 | 0 | 2 | 39.9% | 47.9% | - | 11.1% | 1.2% | |||
| 2010 | Conservative | 62.1% | 25 | 20 | 0 | 3 | 55.4% | 36.5% | 2.1% | 5.3% | 0.7% | |||
| 2011 | Labour | 42.0% | 27 | 18 | 0 | 3 | 62.7% | 34.0% | 1.2% | 2.1% | - | |||
| 2012 | Labour | 32.2% | 34 | 11 | 0 | 3 | 65.8% | 29.1% | 1.3% | 3.7% | - | |||
| 2014 | Labour | 32.6% | 35 | 10 | 0 | 3 | 49.8% | 19.5% | 1.5% | 2.9% | 26.3% | |||
| 2015 | Labour | 63.7% | 33 | 12 | 0 | 3 | 0 | 41.1% | 33.8% | 1.4% | 4.0% | 19.7% | ||
| 2019 | Labour | 30.0% | 37 | 5 | 1 | 5 | 0 | 45.4% | 29.0% | 4.7% | 13.0% | 8.0% | ||
| 2023 | Labour | 31.5% | 38 | 8 | 0 | 2 | 0 | 47.1% | 35.5% | 4.0% | 9.5% | 3.9% | ||
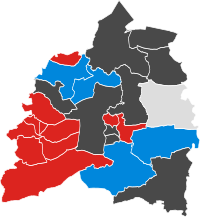
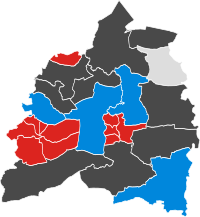
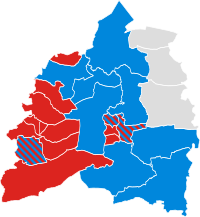
District result maps
-
 2010 results map
 -
 2011 results map
 -
 2012 results map
 -
 2014 results map
 -
 2015 results map
 -
 2019 results map
 -
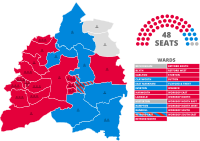 2023 results map


By-elections
1995-1999
| Party | Candidate | Votes | % | ±% | |
|---|---|---|---|---|---|
| Conservative | Mike Quigley | 788 | 54.6 | +5.1 | |
| Labour | Susan Shaw | 492 | 34.1 | -5.3 | |
| Liberal Democrats | Elizabeth Dobbie | 163 | 11.3 | +0.2 | |
| Majority | 296 | 20.5 | |||
| Turnout | 1,443 | 24.8 | |||
| Conservative gain from Labour | Swing | ||||
2003-2007
| Party | Candidate | Votes | % | ±% | |
|---|---|---|---|---|---|
| Conservative | 335 | 87.5 | +58.0 | ||
| Labour | 48 | 12.5 | +12.5 | ||
| Majority | 287 | 75.0 | |||
| Turnout | 383 | 24.0 | |||
| Conservative gain from Liberal Democrats | Swing | ||||
2007-2011
| Party | Candidate | Votes | % | ±% | |
|---|---|---|---|---|---|
| Labour | Sylvia May | 815 | 51.98 | +4.22 | |
| Conservative | Alec Thorpe | 669 | 42.67 | -10.59 | |
| Liberal Democrats | Leon Maurice Duveen | 84 | 5.36 | +5.36 | |
| Turnout | 1,568 | 28.5 | |||
| Party | Candidate | Votes | % | ±% | |
|---|---|---|---|---|---|
| Labour | Gloria June Evans | 1,345 | 82.31 | ||
| Conservative | Tracey Lee Taylor | 182 | 11.14 | ||
| Independent | Richard Vernon Bennett | 68 | 4.16 | ||
| Liberal Democrats | Mark Peter Hunter | 39 | 2.39 | ||
| Turnout | 1,634 | 27.53 | |||
| Party | Candidate | Votes | % | ±% | |
|---|---|---|---|---|---|
| Labour | John William Henry Anderton | 1,198 | 74.04 | ||
| Conservative | Barry Albert Bowles | 317 | 19.59 | ||
| Independent | Geoffrey Ernest Coe | 75 | 4.64 | ||
| Liberal Democrats | Mark Peter Hunter | 28 | 1.73 | ||
| Turnout | 1,618 | 32.09 | |||
2015-2019
| Party | Candidate | Votes | % | ±% | |
|---|---|---|---|---|---|
| Labour | Clayton Tindle | 1,004 | 77.3 | +21.1 | |
| Conservative | Lewis Antony Stanniland | 197 | 15.2 | +15.2 | |
| Liberal Democrats | Leon Maurice Duveen | 98 | 7.5 | +7.5 | |
| Turnout | 23.28 | ||||
| Conservative hold | Swing | ||||
| Party | Candidate | Votes | % | ±% | |
|---|---|---|---|---|---|
| Labour | Matthew Callingham | 441 | 49.9 | +12.6 | |
| Conservative | Emma Auckland | 296 | 33.5 | +4.8 | |
| Liberal Democrats | Helen Tamblyn-Saville | 146 | 16.5 | +3.7 | |
| Majority | 145 | 16.4 | |||
| Turnout | 883 | ||||
| Labour hold | Swing | ||||
2019-2023
| Party | Candidate | Votes | % | ±% | |
|---|---|---|---|---|---|
| Conservative | Gerald Bowers | 454 | 63.0 | +34.0 | |
| Independent | Michael Gray | 193 | 26.8 | +1.7 | |
| Liberal Democrats | Leon Duveen | 74 | 10.3 | +3.9 | |
| Majority | 261 | 36.2 | |||
| Turnout | 721 | ||||
| Conservative gain from Labour | Swing | ||||
| Party | Candidate | Votes | % | ±% | |
|---|---|---|---|---|---|
| Conservative | Denise Depledge | 422 | 63.7 | +37.3 | |
| Labour | Laura Sanders | 134 | 20.2 | +8.2 | |
| Liberal Democrats | Richard Harris | 107 | 16.1 | +16.1 | |
| Majority | 288 | 43.4 | |||
| Turnout | 663 | ||||
| Conservative gain from Independent | Swing | ||||
| Party | Candidate | Votes | % | ±% | |
|---|---|---|---|---|---|
| Conservative | Lewis Stanniland | 745 | 57.7 | +14.2 | |
| Labour | David Naylor | 472 | 36.5 | +16.9 | |
| Liberal Democrats | James Nixon | 75 | 5.8 | +5.8 | |
| Majority | 273 | 21.1 | |||
| Turnout | 1,292 | ||||
| Conservative hold | Swing | ||||
| Party | Candidate | Votes | % | ±% | |
|---|---|---|---|---|---|
| Conservative | Mike Introna | 493 | 40.1 | +22.5 | |
| Independent | Helen Richards | 488 | 39.7 | +39.7 | |
| Labour | James Napier | 247 | 20.1 | -42.0 | |
| Majority | 5 | 0.4 | |||
| Turnout | 1,288 | ||||
| Conservative gain from Labour | Swing | ||||
| Party | Candidate | Votes | % | ±% | |
|---|---|---|---|---|---|
| Labour | Darrell Pulk | 301 | 55.9 | +35.7 | |
| Conservative | Fraser McFarland | 224 | 41.6 | -22.1 | |
| Liberal Democrats | Phil Ray | 13 | 2.4 | -13.7 | |
| Majority | 77 | 14.3 | |||
| Turnout | 538 | ||||
| Labour gain from Conservative | Swing | ||||
References
- ^ "The District of Bassetlaw (Electoral Changes) Order 2000", legislation.gov.uk, The National Archives, SI 2000/3285, retrieved 20 August 2022
- ^ "Lib Dem vote slumps in home counties". guardian.co.uk. London. 19 September 2003. Retrieved 11 September 2009.
- ^ By-election results Archived 29 September 2010 at the Wayback Machine, Bassetlaw District Council
- ^ Harworth By-election results Archived 16 July 2011 at the Wayback Machine, Bassetlaw District Council
- ^ Worksop North East By-election result Archived 28 September 2011 at the Wayback Machine, Bassetlaw District Council
- ^ "Worksop South East By-Election 22nd March 2018 - Bassetlaw District Council". www.bassetlaw.gov.uk. Archived from the original on 24 March 2018. Retrieved 24 March 2018.
- ^ "Britain Elects on Twitter". Twitter. Retrieved 24 March 2018.
- ^ "Local Elections Archive Project — East Retford West Ward". www.andrewteale.me.uk. Retrieved 6 January 2024.
- ^ "Local Elections Archive Project — Ranskill Ward". www.andrewteale.me.uk. Retrieved 6 January 2024.
- ^ "Local Elections Archive Project — Sutton Ward". www.andrewteale.me.uk. Retrieved 6 January 2024.
- ^ "Local Elections Archive Project — Tuxford and Trent Ward". www.andrewteale.me.uk. Retrieved 6 January 2024.
- ^ "Local Elections Archive Project — East Retford South Ward". www.andrewteale.me.uk. Retrieved 6 January 2024.
- ^ "Local Elections Archive Project — Sutton Ward". www.andrewteale.me.uk. Retrieved 6 January 2024.
- By-election results Archived 29 March 2010 at the Wayback Machine