
| |||||||||||||||||||||||||||||||||||||||||||||||||||||||||||||||||
All 70 seats to Bristol City Council 36 seats needed for a majority | |||||||||||||||||||||||||||||||||||||||||||||||||||||||||||||||||
|---|---|---|---|---|---|---|---|---|---|---|---|---|---|---|---|---|---|---|---|---|---|---|---|---|---|---|---|---|---|---|---|---|---|---|---|---|---|---|---|---|---|---|---|---|---|---|---|---|---|---|---|---|---|---|---|---|---|---|---|---|---|---|---|---|---|
| |||||||||||||||||||||||||||||||||||||||||||||||||||||||||||||||||
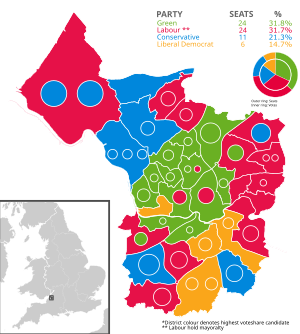 Map showing the results of the 2021 Bristol City Council elections. Blue showing Conservative, Green showing Green, Red showing Labour and Yellow showing Liberal Democrats. Striped wards have mixed representation. | |||||||||||||||||||||||||||||||||||||||||||||||||||||||||||||||||
| |||||||||||||||||||||||||||||||||||||||||||||||||||||||||||||||||
The 2021 Bristol City Council election took place on 6 May 2021 to elect members of Bristol City Council in England. It coincided with nationwide local elections. Voters in the city also voted for the mayor of Bristol, the mayor of West of England and for Avon and Somerset's police and crime commissioner. The election was originally due to take place in May 2020, but was postponed due to the COVID-19 pandemic.[1]
The Labour Party, Conservative Party, Green Party and Liberal Democrats all stood full slates of 70 candidates. There were also eight candidates from the Trade Unionist and Socialist Coalition (TUSC), two independent candidates, and one candidate each from Reform UK, the SDP and Burning Pink.[2]
Turnout was lower than in the 2016 Bristol City Council election, with a citywide turnout of 41.04%. Only four wards had a turnout of more than 50% of the electorate, compared to ten wards in 2016. Hartcliffe and Withywood recorded a turnout of 20.34%, the lowest turnout of any ward since Bristol's move to whole council elections.[3]
Background
Since the 2016 local elections, there have been changes to the political make up of the council. In 2016, Labour briefly lost control of the council after suspending three councillors.[4] Labour regained control of the council later that year after it readmitted them. On 24 May 2018, a by-election was held in Westbury-on-Trym and Henleaze ward, resulting in the Conservatives gaining a seat from the Liberal Democrats.[5] On 22 March 2019, the Eastville councillor Sultan Khan resigned from the Labour Party, but continued to represent the ward as an independent before joining the Liberal Democrats.[6] On 17 July 2019, the Brislington East councillor Tony Carey resigned from the Conservative Party, but continued to represent the ward as an independent before joining the Liberal Democrats[7] A by-election took place in Brislington East on 16 January 2020 after the death of the Labour councillor Mike Langley. The by-election was won by the Labour candidate Tim Rippington.[8][9] On 23 March 2021, the Labour councillor Jo Sergeant defected to the Green Party.
In preparation for the election, political parties went through their selection processes. The Conservative Party faced controversy after the party deselected Peter Abraham, the council's longest serving councillor who had first been elected in 1966 for the Stockwood ward. The local party did not state a reason for this decision.[10] Labour Party selection processes, which are normally overseen by local party officials, were taken over by paid officials from the South West Labour Party Regional Office, who removed and banned candidates in several key wards, resulting in resignations by local volunteer members.[11] The Labour group in the city saw seventeen of its backbench councillors standing down; twenty councillors, including all of the cabinet, are seeking re-election.[12]
For the candidates for the mayoral election, Marvin Rees was re-selected as Labour's candidate;[13] Sandy Hore-Ruthven was announced as the Green party's candidate,[14] Caroline Gooch from the Liberal Democrats and Samuel Williams was initially selected as the Conservative candidate.[15] Williams subsequently decided to stand down as the Conservative candidate, choosing instead to run in the regional West of England mayoral election.[16] Alastair Watson, a former city councillor, stood for the Conservatives in place of Williams.[17]
Campaign
Conservative mayoral candidate Williams was critical of Rees's pursuit of Bristol Energy, a council-run energy company and the ambition of constructing underground transport for the city.[15] Both the Conservatives and the Liberal Democrats campaigned to scrap the post of elected mayor.[18][19]
Council composition
Prior to the 2021 election, the composition of the council was:

| 37 | 14 | 11 | 8 |
| Labour | Conservative | Green | Lib Dems |
After the 2021 election, the composition of the council was:

| 24 | 24 | 14 | 8 |
| Green | Labour | Conservative | Lib Dems |
Summary
Election result
The Greens and Labour each won 24 seats out of 70.
| 2021 Bristol City Council election | ||||||||||
|---|---|---|---|---|---|---|---|---|---|---|
| Party | Candidates | Seats | Gains | Losses | Net gain/loss | Seats % | Votes % | Votes | +/− | |
| Labour | 70 | 24 | 2 | 15 | 34.3 | 31.9 | 85,668 | –4.7 | ||
| Green | 70 | 24 | 13 | 0 | 34.3 | 31.7 | 85,092 | +11.8 | ||
| Conservative | 70 | 14 | 2 | 2 | 20.0 | 21.2 | 56,913 | –1.0 | ||
| Liberal Democrats | 70 | 8 | 2 | 2 | 11.4 | 14.7 | 39,480 | –2.2 | ||
| TUSC | 8 | 0 | 0 | 0 | 0.0 | 0.3 | 814 | –0.7 | ||
| Independent | 2 | 0 | 0 | 0 | 0.0 | 0.1 | 318 | –0.7 | ||
| SDP | 1 | 0 | 0 | 0 | 0.0 | <0.1 | 112 | N/A | ||
| Burning Pink | 1 | 0 | 0 | 0 | 0.0 | <0.1 | 90 | N/A | ||
| Reform UK | 1 | 0 | 0 | 0 | 0.0 | <0.1 | 36 | N/A | ||
Ward results

Ashley
| Party | Candidate | Votes | % | ±% | |
|---|---|---|---|---|---|
| Green | Tim Wye | 3,820 | 55.39 | +17.16 | |
| Labour | Amirah Cole | 2,957 | 42.88 | +3.58 | |
| Green | Jude English | 2,257 | 39.98 | +4.08 | |
| Green | Will Mountford | 2,096 | 30.39 | +0.48 | |
| Labour | Sibusiso Tshabalala | 2,091 | 30.32 | -8.94 | |
| Conservative | Marcus Bruton | 1,764 | 25.58 | +22.11 | |
| Labour | Carole Johnson | 1,468 | 21.29 | -10.81 | |
| Liberal Democrats | Ian Harris | 1,157 | 16.78 | -2.14 | |
| Liberal Democrats | Tara Murray | 973 | 14.11 | +3.76 | |
| Conservative | James Mills | 920 | 13.34 | +10.47 | |
| Liberal Democrats | Robert Bristow | 228 | 3.31 | -5.38 | |
| Conservative | Oscar Lucas | 218 | 3.16 | +0.41 | |
| TUSC | Chris Farrell | 204 | 2.96 | -3.32 | |
| Independent | Robbie Bentley | 196 | 2.84 | +2.84 | |
| Turnout | 6,896 | 48.37 | -3.01 | ||
| Green gain from Labour | |||||
| Labour hold | |||||
| Green hold | |||||
Avonmouth and Lawrence Weston
| Party | Candidate | Votes | % | ±% | |
|---|---|---|---|---|---|
| Labour | Don Alexander | 1,695 | 32.86 | -2.54 | |
| Conservative | John Geater | 1,563 | 30.30 | -1.60 | |
| Conservative | James Scott | 1,550 | 30.05 | +9.93 | |
| Green | Jo Sergeant | 1,534 | 29.74 | +23.85 | |
| Labour | Daphne Chikwere | 1,481 | 28.71 | +3.96 | |
| Conservative | Rekha Rao-Nicholson | 1,261 | 24.45 | +5.91 | |
| Labour | Matt Palmer | 1,219 | 23.63 | +3.26 | |
| Green | Jackie Walkden | 837 | 16.23 | +10.41 | |
| Green | Robert Triggs | 717 | 13.90 | +8.58 | |
| Liberal Democrats | Ian Campion-Smith | 339 | 6.57 | -7.31 | |
| Liberal Democrats | Neil Harvie | 271 | 5.25 | -4.36 | |
| Liberal Democrats | Charles Gunter | 266 | 5.16 | -4.12 | |
| Turnout | 5,158 | 32.51 | -6.43 | ||
| Labour hold | |||||
| Conservative hold | |||||
| Conservative gain from Labour | |||||
Bedminster
| Party | Candidate | Votes | % | ±% | |
|---|---|---|---|---|---|
| Green | Tessa Fitzjohn | 1,728 | 38.75 | +9.71 | |
| Labour | Mark Bradshaw | 1,715 | 38.69 | -12.75 | |
| Labour | Celia Phipps | 1,688 | 37.86 | +1.02 | |
| Green | Louis Williams | 1,111 | 24.92 | +5.49 | |
| Conservative | Gerard Calderbank | 688 | 15.43 | +1.65 | |
| Conservative | Rajesh Joseph | 458 | 10.27 | -3.41 | |
| Liberal Democrats | Alex Birrell | 234 | 5.25 | -2.30 | |
| Liberal Democrats | Fergus Ustianowski | 149 | 3.34 | -0.02 | |
| Turnout | 4,459 | 44.82 | -12.13 | ||
| Green gain from Labour | |||||
| Labour hold | |||||
Bishopston & Ashley Down
| Party | Candidate | Votes | % | ±% | |
|---|---|---|---|---|---|
| Green | Emma Edwards | 2,766 | 52.68 | +16.11 | |
| Green | Lily Fitzgibbon | 2,395 | 45.61 | +9.41 | |
| Labour | Eileen Means | 1,423 | 27.10 | -9.47 | |
| Labour | Joe Rayment | 1,382 | 26.32 | +0.82 | |
| Liberal Democrats | Becky Lockyer | 654 | 12.45 | -6.35 | |
| Liberal Democrats | Phil Kemp | 603 | 11.48 | -6.58 | |
| Conservative | Tony Holdsworth | 336 | 6.40 | -2.04 | |
| Conservative | Adam Brown | 329 | 6.27 | -0.57 | |
| Turnout | 5,251 | 55.68 | -1.27 | ||
| Green gain from Labour | |||||
| Green hold | |||||
Bishopsworth
| Party | Candidate | Votes | % | ±% | |
|---|---|---|---|---|---|
| Conservative | Richard Eddy | 1,575 | 48.49 | -7.27 | |
| Conservative | Kevin Quartley | 1,196 | 36.82 | -0.97 | |
| Labour | Jaime Breitnauer | 879 | 27.06 | +0.95 | |
| Labour | Bianca Rossetti | 736 | 22.66 | +0.95 | |
| Green | Kristian Dainton | 414 | 12.75 | +3.53 | |
| Green | Alex Smith | 360 | 11.08 | +2.71 | |
| Liberal Democrats | Mary Sykes | 256 | 7.88 | +1.30 | |
| Liberal Democrats | Joshua Warwick-Smith | 56 | 1.72 | -1.60 | |
| Turnout | 3,248 | 34.80 | -6.02 | ||
| Conservative hold | |||||
| Conservative hold | |||||
Brislington East
| Party | Candidate | Votes | % | ±% | |
|---|---|---|---|---|---|
| Labour | Tim Rippington | 1,282 | 37.77 | -0.51 | |
| Labour | Katja Hornchen | 1,116 | 32.88 | +3.26 | |
| Conservative | Melissa Groves | 732 | 21.57 | -12.18 | |
| Liberal Democrats | Tony Carey | 710 | 20.92 | +11.36 | |
| Green | David Megson-Smith | 591 | 17.41 | +5.14 | |
| Conservative | Nura Aabe | 534 | 15.73 | -14.22 | |
| Green | Jason Truelove | 388 | 11.43 | +0.56 | |
| Liberal Democrats | Mohammad Ainul Islam | 265 | 7.81 | -1.21 | |
| Turnout | 3,394 | 37.12 | -3.30 | ||
| Labour hold | |||||
| Labour gain from Conservative | |||||
Brislington West
| Party | Candidate | Votes | % | ±% | |
|---|---|---|---|---|---|
| Liberal Democrats | Jos Clark | 1,883 | 44.40 | +4.01 | |
| Liberal Democrats | Andrew John Varney | 1,494 | 35.23 | +4.09 | |
| Labour | Carolyn Magson | 1,331 | 31.38 | -1.72 | |
| Labour | Rob Logan | 1,028 | 24.24 | +0.75 | |
| Green | Tom Chudley-Evans | 663 | 15.63 | -2.17 | |
| Green | Jim Mayger | 466 | 10.99 | -0.74 | |
| Conservative | Martin Christopher Liner | 379 | 8.94 | -3.80 | |
| Conservative | Vicki Kathleen Liner | 349 | 8.23 | -4.28 | |
| Turnout | 4,241 | 46.16 | +0.61 | ||
| Liberal Democrats hold | |||||
| Liberal Democrats gain from Labour | |||||
Central
| Party | Candidate | Votes | % | ±% | |
|---|---|---|---|---|---|
| Green | Ani Stafford-Townsend | 1,316 | 40.13 | +7.78 | |
| Labour | Farah Hussain | 1,078 | 32.88 | -7.45 | |
| Labour | Kye Daniel Dudd | 1,064 | 32.45 | -0.17 | |
| Green | Simon Ingham Stafford-Townsend | 985 | 30.04 | +5.65 | |
| Conservative | Richard Leslie Clifton | 413 | 12.60 | -1.23 | |
| Liberal Democrats | Jen Smith | 373 | 11.38 | -2.60 | |
| Conservative | David John Kibble | 360 | 10.98 | -1.24 | |
| Liberal Democrats | Zac Barker | 300 | 9.15 | -3.45 | |
| Turnout | 3,279 | 29.52 | -5.98 | ||
| Green gain from Labour | |||||
| Labour hold | |||||
Clifton
| Party | Candidate | Votes | % | ±% | |
|---|---|---|---|---|---|
| Green | Katy Grant | 2,444 | 51.08 | +14.46 | |
| Green | Paula Bernadette O’Rourke | 2,304 | 48.15 | +15.31 | |
| Labour | Raven Piers Hart | 911 | 19.04 | -3.90 | |
| Labour | Paul Alan Ville | 698 | 14.59 | -0.40 | |
| Conservative | Simon Paul Davies | 648 | 13.54 | -16.81 | |
| Conservative | Charles James Hastings Lucas | 646 | 13.50 | -8.11 | |
| Liberal Democrats | Nicholas John Coombes | 623 | 13.02 | -1.52 | |
| Liberal Democrats | Johnny Palmer | 469 | 9.80 | +1.41 | |
| Turnout | 4,785 | 48.57 | -3.67 | ||
| Green hold | |||||
| Green hold | |||||
Clifton Down
| Party | Candidate | Votes | % | ±% | |
|---|---|---|---|---|---|
| Green | Carla Suzanne Denyer | 2,458 | 60.26 | +26.83 | |
| Green | Tom Hathway | 1,752 | 42.95 | +16.29 | |
| Labour | Elliott Jacob Callender | 880 | 21.57 | -4.83 | |
| Labour | Teresa Ann Stratford | 654 | 16.03 | -4.37 | |
| Conservative | Jude Fabio D'Alesio | 449 | 11.01 | -9.63 | |
| Liberal Democrats | Merche Clark | 445 | 10.91 | -7.02 | |
| Liberal Democrats | Laura Kirsten Barry | 428 | 10.49 | -5.65 | |
| Conservative | Edward Alexander De'Mayene Gibson | 397 | 9.73 | -7.98 | |
| Turnout | 4,079 | 46.09 | -1.40 | ||
| Green hold | |||||
| Green hold | |||||
Cotham
| Party | Candidate | Votes | % | ±% | |
|---|---|---|---|---|---|
| Green | Mohamed Alaaeldin Yousif Makawi | 2,056 | 49.58 | +15.51 | |
| Green | Guy James Baiden Poultney | 1,841 | 44.39 | +15.33 | |
| Liberal Democrats | Anthony Leonard Negus | 1,204 | 29.03 | -1.91 | |
| Liberal Democrats | Phyllis Iris Ella Rayner | 742 | 17.89 | -3.25 | |
| Labour | Dylan James Woodward | 699 | 16.86 | -12.76 | |
| Labour | Matthew Paul Redmore | 642 | 15.48 | -7.87 | |
| Conservative | Caroline Mary Lucas | 339 | 8.17 | -2.88 | |
| Conservative | George Scott Day | 213 | 5.14 | -3.14 | |
| Reform UK | Rob Clarke | 36 | 0.87 | +0.87 | |
| Turnout | 4,147 | 48.08 | -2.74 | ||
| Green hold | |||||
| Green gain from Liberal Democrats | |||||
Easton
| Party | Candidate | Votes | % | ±% | |
|---|---|---|---|---|---|
| Green | Jenny Bartle | 2,259 | 44.64 | +9.06 | |
| Green | Barry William Parsons | 1,960 | 38.73 | +4.44 | |
| Labour | Debra Jane Newrick | 1,742 | 34.42 | -5.29 | |
| Labour | Afzal Shah | 1,739 | 34.36 | -4.98 | |
| Liberal Democrats | Pauline Mary Allen | 387 | 7.65 | +1.24 | |
| Conservative | Joanne Sara McCready | 316 | 6.24 | +1.75 | |
| Liberal Democrats | Paul Elvin | 292 | 5.77 | -0.09 | |
| Conservative | Roger Keith Jones | 249 | 4.92 | +1.32 | |
| Turnout | 5,061 | 48.93 | -2.37 | ||
| Green gain from Labour | |||||
| Green gain from Labour | |||||
Eastville
| Party | Candidate | Votes | % | ±% | |
|---|---|---|---|---|---|
| Labour | Marley Chad Bennett | 1,763 | 37.61 | -14.54 | |
| Green | Lorraine Francis | 1,632 | 34.82 | +17.98 | |
| Labour | Sangeetha Morenike Wynter | 1,269 | 27.07 | -19.18 | |
| Green | Justin Quinnell | 1,170 | 24.96 | +24.96 | |
| Liberal Democrats | Sultan Mahmud Khan | 690 | 14.72 | +0.16 | |
| Conservative | Leigh Dennis Joseph Cooper | 526 | 11.22 | -3.76 | |
| Conservative | Jacob Anstey | 466 | 9.94 | +0.21 | |
| Liberal Democrats | Mohammad Abdur Rashid | 369 | 7.87 | +0.79 | |
| TUSC | Mike Luff | 150 | 3.20 | -3.35 | |
| Turnout | 4,687 | 42.96 | -1.50 | ||
| Labour hold | |||||
| Green gain from Labour | |||||
Filwood
| Party | Candidate | Votes | % | ±% | |
|---|---|---|---|---|---|
| Labour | Zoe Goodman | 1,023 | 39.95 | -20.35 | |
| Labour | Chris Jackson | 947 | 36.98 | -10.63 | |
| Green | Harriet Hansen | 546 | 21.32 | +5.98 | |
| Green | Barney Smith | 461 | 18.00 | +18.00 | |
| Conservative | Sylvia Christine Windows | 446 | 17.42 | +7.23 | |
| Conservative | Jojimon Kuriakose | 310 | 12.10 | +3.48 | |
| Liberal Democrats | Jackie Norman | 197 | 7.69 | -0.93 | |
| Liberal Democrats | Crispin Allard | 138 | 5.39 | +0.39 | |
| TUSC | Robin Victor Clapp | 116 | 4.53 | -3.72 | |
| Turnout | 2,561 | 25.45 | -3.97 | ||
| Labour hold | |||||
| Labour hold | |||||
Frome Vale
| Party | Candidate | Votes | % | ±% | |
|---|---|---|---|---|---|
| Labour | Amal Ali | 1,521 | 39.04 | +1.57 | |
| Conservative | Lesley Alexander | 1,266 | 32.49 | -10.03 | |
| Labour | Mike Wollacott | 1,102 | 28.29 | -2.33 | |
| Conservative | Pooja Poddar | 729 | 18.71 | -13.47 | |
| Green | Jesse Meadows | 721 | 18.51 | +3.44 | |
| Green | Ed Fraser | 716 | 18.38 | +8.95 | |
| Liberal Democrats | Bev Knott | 215 | 5.52 | -0.33 | |
| Liberal Democrats | Keith Fenner | 201 | 5.16 | +1.36 | |
| SDP | Tommy Trueman | 112 | 2.87 | +2.87 | |
| Turnout | 3,896 | 39.25 | -5.89 | ||
| Conservative hold | |||||
| Labour hold | |||||
Hartcliffe & Withywood
| Party | Candidate | Votes | % | ±% | |
|---|---|---|---|---|---|
| Labour | Kerry Johanna Bailes | 1,024 | 38.42 | -14.21 | |
| Labour | Helen Holland | 1,021 | 38.31 | -11.24 | |
| Labour | Paul Goggin | 782 | 29.34 | -10.45 | |
| Conservative | Daniel Thomas Bond | 756 | 28.37 | +13.01 | |
| Conservative | Ann-Marie Mason | 669 | 25.10 | +12.96 | |
| Conservative | Keith Ronald Taplin | 645 | 24.20 | +12.96 | |
| Green | Sam Marshall Evans | 334 | 12.53 | +1.44 | |
| Liberal Democrats | Gary Dean Perry | 289 | 10.84 | +6.08 | |
| Green | Jasmine Tribe | 267 | 10.02 | +10.02 | |
| Green | Alexander Sinclair-Lack | 252 | 9.46 | +9.46 | |
| Liberal Democrats | Jack Hibbins | 150 | 5.63 | +2.20 | |
| Liberal Democrats | Matthew Roberts | 143 | 5.37 | +2.20 | |
| Turnout | 2,665 | 20.34 | -6.97 | ||
| Labour hold | |||||
| Labour hold | |||||
| Labour hold | |||||
Henbury & Brentry
| Party | Candidate | Votes | % | ±% | |
|---|---|---|---|---|---|
| Conservative | Mark Roscoe Weston | 1,880 | 52.60 | +4.18 | |
| Conservative | Chris Windows | 1,280 | 35.81 | -3.19 | |
| Labour | Teresa Hogan | 994 | 27.81 | -6.33 | |
| Labour | David Mullaney | 881 | 24.65 | -2.46 | |
| Green | Alice Clevely | 476 | 13.32 | +4.42 | |
| Green | Simeon Roswell | 291 | 8.14 | +2.56 | |
| Liberal Democrats | Jerry Sandford | 218 | 6.10 | -0.63 | |
| Liberal Democrats | Bill Oates | 157 | 4.39 | -0.39 | |
| TUSC | Amy Gwen Sage | 57 | 1.59 | +1.59 | |
| Turnout | 3,574 | 36.95 | -2.78 | ||
| Conservative hold | |||||
| Conservative hold | |||||
Hengrove & Whitchurch Park
| Party | Candidate | Votes | % | ±% | |
|---|---|---|---|---|---|
| Liberal Democrats | Tim Kent | 2,641 | 55.20 | +8.45 | |
| Liberal Democrats | Andrew Brown | 1,861 | 38.90 | +8.60 | |
| Liberal Democrats | Sarah Classick | 1,844 | 38.55 | +11.55 | |
| Conservative | Karen Brown | 1,307 | 27.32 | +14.36 | |
| Conservative | Edmund Hunt | 838 | 17.52 | +7.36 | |
| Conservative | Daniel Fear | 802 | 16.76 | +6.78 | |
| Labour | Caroline Jenkins | 740 | 15.47 | -17.16 | |
| Labour | Rory Casey | 670 | 14.01 | -2.74 | |
| Labour | Martin Golding | 541 | 11.31 | -3.46 | |
| Green | Lela McTernan | 347 | 7.25 | +2.47 | |
| Green | Tabitha Stanmore | 255 | 5.33 | +5.33 | |
| Green | Max Thrower | 197 | 4.12 | +4.12 | |
| Turnout | 4,784 | 34.17 | -5.50 | ||
| Liberal Democrats hold | |||||
| Liberal Democrats gain from Labour | |||||
| Liberal Democrats hold | |||||
Hillfields
| Party | Candidate | Votes | % | ±% | |
|---|---|---|---|---|---|
| Labour | Craig Cheney | 1,367 | 43.40 | -2.84 | |
| Labour | Ellie King | 1,255 | 39.84 | -1.18 | |
| Conservative | Charles Alexander | 690 | 21.90 | +6.77 | |
| Green | Lisa Calder | 620 | 19.68 | +5.90 | |
| Green | Rick Lovering | 557 | 17.68 | +17.68 | |
| Conservative | James Hinchcliffe | 511 | 16.22 | +4.61 | |
| Liberal Democrats | Anna Fry | 192 | 6.10 | +0.76 | |
| Liberal Democrats | Sundar Ali | 180 | 5.71 | +2.10 | |
| Turnout | 3,150 | 34.27 | -4.15 | ||
| Labour hold | |||||
| Labour hold | |||||
Horfield
| Party | Candidate | Votes | % | ±% | |
|---|---|---|---|---|---|
| Labour | Philippa Mary Hulme | 1,689 | 40.72 | +0.53 | |
| Labour | Tom Renhard | 1,203 | 29.00 | -0.51 | |
| Conservative | Claire Hiscott | 985 | 23.75 | -5.76 | |
| Green | Anna Meares | 944 | 22.76 | +7.36 | |
| Conservative | Jack Emsley | 824 | 19.86 | -8.54 | |
| Liberal Democrats | Tracey O'Reilly | 641 | 15.45 | +5.84 | |
| Liberal Democrats | Michael O'Shea | 632 | 15.24 | +7.85 | |
| Green | Isaac Price-Sosner | 512 | 12.34 | -2.00 | |
| Turnout | 4,148 | 42.62 | -1.00 | ||
| Labour hold | |||||
| Labour gain from Conservative | |||||
Hotwells & Harbourside
| Party | Candidate | Votes | % | ±% | |
|---|---|---|---|---|---|
| Liberal Democrats | Alex Hartley | 651 | 32.90 | -0.77 | |
| Green | Heulwen Flower | 625 | 31.58 | +7.20 | |
| Labour | Henry Palmer | 496 | 25.06 | +2.95 | |
| Conservative | Julian Ellacott | 182 | 9.20 | -6.50 | |
| Turnout | 1,979 | 45.62 | -0.78 | ||
| Liberal Democrats hold | |||||
Knowle
| Party | Candidate | Votes | % | ±% | |
|---|---|---|---|---|---|
| Liberal Democrats | Chris Davies | 1,677 | 38.86 | -9.22 | |
| Liberal Democrats | Gary Hopkins | 1,648 | 38.19 | -9.38 | |
| Labour | Brandon Rhys Gage | 1,085 | 25.14 | -4.37 | |
| Labour | Michele Madeleine Tedder | 1,006 | 23.31 | +0.58 | |
| Green | Natasha Kiran Clarke | 921 | 21.34 | +9.97 | |
| Green | Patrick McAllister | 542 | 12.56 | +5.14 | |
| Conservative | Jenny Rogers | 371 | 8.60 | +2.68 | |
| Conservative | Diane Gilpin | 293 | 6.79 | +1.45 | |
| TUSC | Domenico William Hill | 82 | 1.90 | -0.13 | |
| Turnout | 4,315 | 43.02 | -3.81 | ||
| Liberal Democrats hold | |||||
| Liberal Democrats hold | |||||
Lawrence Hill
| Party | Candidate | Votes | % | ±% | |
|---|---|---|---|---|---|
| Labour | Hibaq Abdi Jama | 1,793 | 41.07 | -13.56 | |
| Green | Yassin Hassan Mohamud | 1,675 | 38.36 | +19.59 | |
| Green | Jon Eccles | 1,456 | 33.35 | +16.58 | |
| Labour | Shona deForde Jemphrey | 1,398 | 32.02 | -19.28 | |
| Conservative | Kathryn Anne Johnson | 229 | 5.25 | -1.96 | |
| Conservative | Deirdre Allison Judge | 194 | 4.44 | +1.36 | |
| Liberal Democrats | Jessica Evelyn McKenzie | 166 | 3.80 | -3.12 | |
| Liberal Democrats | Harry Bradbury | 156 | 3.57 | -1.23 | |
| Turnout | 4,366 | 37.24 | -3.75 | ||
| Labour hold | |||||
| Green gain from Labour | |||||
Lockleaze
| Party | Candidate | Votes | % | ±% | |
|---|---|---|---|---|---|
| Green | Heather Mack | 1,490 | 42.47 | +23.02 | |
| Green | David Wilcox | 1,212 | 34.55 | +34.55 | |
| Labour | Aadayaamelika Adlam | 1,145 | 32.64 | -20.72 | |
| Labour | Theresa Jane Allain | 1,111 | 31.67 | -13.69 | |
| Conservative | Nigel Paul Brown | 444 | 12.66 | -3.48 | |
| Conservative | George William Pendrill Maggs | 361 | 10.29 | -1.46 | |
| Liberal Democrats | Maz Choudhury | 191 | 5.44 | -3.08 | |
| Liberal Democrats | Graham Christopher Donald | 129 | 3.68 | -4.05 | |
| TUSC | Roger Stephen Thomas | 107 | 3.05 | -3.64 | |
| Turnout | 3,508 | 37.28 | -2.78 | ||
| Green gain from Labour | |||||
| Green gain from Labour | |||||
Redland
| Party | Candidate | Votes | % | ±% | |
|---|---|---|---|---|---|
| Green | Fi Hance | 3,286 | 55.72 | +17.43 | |
| Green | Martin Fodor | 3,041 | 51.57 | +13.53 | |
| Labour | Kirsten Nicola Malcolm | 1,590 | 26.96 | -2.39 | |
| Labour | Andrew Milton | 1,138 | 19.30 | -2.70 | |
| Conservative | Richard James Manns | 570 | 9.67 | -5.78 | |
| Conservative | Malcolm Frederick Ravenscroft | 478 | 8.11 | -5.96 | |
| Liberal Democrats | Rebecca Louise Hutcheon | 455 | 7.72 | -6.17 | |
| Liberal Democrats | James Anthony Wetz | 406 | 6.88 | -6.07 | |
| Turnout | 5,897 | 56.47 | -0.47 | ||
| Green hold | |||||
| Green hold | |||||
Southmead
| Party | Candidate | Votes | % | ±% | |
|---|---|---|---|---|---|
| Labour | Helen Jayne Godwin Tiege | 1,147 | 44.65 | -2.65 | |
| Labour | Brenda Margaret Massey | 1,060 | 41.26 | -1.80 | |
| Conservative | James Anthony Martin | 748 | 29.12 | +13.68 | |
| Conservative | Roddy Jaques | 622 | 24.21 | +11.75 | |
| Green | Clare Hartland | 499 | 19.42 | +10.71 | |
| Green | Serena Kate Ralston | 370 | 14.40 | +14.40 | |
| Liberal Democrats | Clare Campion-Smith | 266 | 10.35 | +0.35 | |
| Liberal Democrats | Gill Brooks | 188 | 7.32 | -1.58 | |
| Turnout | 2,569 | 31.28 | -4.25 | ||
| Labour hold | |||||
| Labour hold | |||||
Southville
| Party | Candidate | Votes | % | ±% | |
|---|---|---|---|---|---|
| Green | Tony Dyer | 2,393 | 49.37 | +3.39 | |
| Green | Christine Charlotte Townsend | 1,867 | 38.52 | +1.64 | |
| Labour | Lisa Ann Durston | 1,781 | 36.74 | +0.20 | |
| Labour | Thomas Phipps | 1,630 | 33.63 | -0.71 | |
| Conservative | Iain Jenkins Dennis | 370 | 7.63 | -2.65 | |
| Conservative | James Callum MacQueen | 276 | 5.69 | -1.11 | |
| Liberal Democrats | Lena Clare Wright | 228 | 4.70 | -1.20 | |
| Liberal Democrats | Sam Merchant | 182 | 3.75 | -0.56 | |
| Turnout | 4,847 | 49.72 | -3.48 | ||
| Green hold | |||||
| Green hold | |||||
St George Central
| Party | Candidate | Votes | % | ±% | |
|---|---|---|---|---|---|
| Labour | Nicola Anne Beech | 1,676 | 49.29 | -4.87 | |
| Labour | Steve Pearce | 996 | 29.29 | -5.95 | |
| Green | Georgia Nelson | 817 | 24.03 | +9.31 | |
| Conservative | Anthony Paul Lee | 691 | 20.32 | +1.75 | |
| Conservative | Laura Saunders | 682 | 20.06 | +1.81 | |
| Green | Patrick John Toland | 417 | 12.26 | +12.26 | |
| Liberal Democrats | Chris Featonby | 280 | 8.24 | -1.75 | |
| Liberal Democrats | Tina Kaulbach | 155 | 4.56 | -4.75 | |
| Turnout | 3,400 | 34.32 | -2.03 | ||
| Labour hold | |||||
| Labour hold | |||||
St George Troopers Hill
| Party | Candidate | Votes | % | ±% | |
|---|---|---|---|---|---|
| Labour Co-op | Fabian Guy Breckels | 824 | 46.58 | -0.64 | |
| Conservative | Kevin Robert Rainey | 541 | 30.58 | -2.75 | |
| Green | Tom Cuthbertson | 294 | 16.62 | +7.88 | |
| Liberal Democrats | Adam Alexander Raphael | 80 | 4.52 | -2.37 | |
| Turnout | 1,769 | 37.94 | -6.32 | ||
| Labour hold | |||||
St George West
| Party | Candidate | Votes | % | ±% | |
|---|---|---|---|---|---|
| Labour | Asher Craig | 1,180 | 50.77 | +8.52 | |
| Green | Anna Bryher | 686 | 29.52 | +10.04 | |
| Conservative | Nick Hiscott | 205 | 8.82 | +0.91 | |
| Independent | Tony Potter | 122 | 5.25 | -3.82 | |
| Liberal Democrats | Simon Guilbert King | 68 | 2.93 | -15.58 | |
| TUSC | Chris Parry | 43 | 1.85 | -0.93 | |
| Turnout | 2,324 | 44.66 | -1.34 | ||
| Labour hold | |||||
Stockwood
| Party | Candidate | Votes | % | ±% | |
|---|---|---|---|---|---|
| Conservative | Graham David Morris | 1,796 | 53.97 | +11.17 | |
| Conservative | Jonathan Robert Hucker | 1,347 | 40.47 | -1.96 | |
| Labour Co-op | Samuel John Fox | 1,031 | 30.98 | -1.84 | |
| Labour Co-op | Justin William Ibbett | 567 | 17.04 | -12.86 | |
| Green | Stephen Lloyd | 239 | 7.18 | -1.18 | |
| Green | Jaz Fryer-Jones | 228 | 6.85 | -0.50 | |
| Liberal Democrats | Thomas Harry Brooks | 169 | 5.08 | -0.07 | |
| Liberal Democrats | Benjamin Goldstrom | 139 | 4.18 | -0.33 | |
| Turnout | 3,328 | 36.33 | -4.91 | ||
| Conservative hold | |||||
| Conservative hold | |||||
Stoke Bishop
| Party | Candidate | Votes | % | ±% | |
|---|---|---|---|---|---|
| Conservative | John Goulandris | 2,242 | 52.67 | +2.07 | |
| Conservative | Henry Michallat | 1,786 | 41.95 | -1.63 | |
| Labour | Mohammed Omer | 744 | 17.48 | +1.51 | |
| Labour | James Henry Lavington Wood | 678 | 15.93 | +3.03 | |
| Green | Poppy Silk | 673 | 15.81 | +5.79 | |
| Green | Luke Cox | 647 | 15.20 | +8.10 | |
| Liberal Democrats | Timothy James Leaman | 460 | 10.81 | -3.01 | |
| Liberal Democrats | Nwakasi Belisle-Nweke | 303 | 7.12 | -4.63 | |
| TUSC | Kyle Philip Walker | 55 | 1.29 | +1.29 | |
| Turnout | 4,257 | 45.35 | -6.30 | ||
| Conservative hold | |||||
| Conservative hold | |||||
Westbury-on-Trym & Henleaze
| Party | Candidate | Votes | % | ±% | |
|---|---|---|---|---|---|
| Conservative | Geoff Gollop | 3,389 | 38.51 | -5.52 | |
| Conservative | Steve Smith | 2,914 | 33.11 | -7.24 | |
| Conservative | Sharon Anne Scott | 2,673 | 30.38 | -4.76 | |
| Liberal Democrats | Caroline Gooch | 2,449 | 27.83 | -8.07 | |
| Green | Georgia Barnes | 1,764 | 20.05 | +5.75 | |
| Labour | Lesley Miranda McCabe | 1,729 | 19.65 | +2.24 | |
| Liberal Democrats | Simon Cook | 1,609 | 18.28 | -7.82 | |
| Labour | Sam Taylor-Elliott | 1,580 | 17.95 | +4.45 | |
| Green | Alex Dunn | 1,535 | 17.44 | +3.14 | |
| Labour | Simon Mark Geoffrey Crew | 1,512 | 17.18 | +3.70 | |
| Green | Robin Coode | 1,477 | 16.78 | +16.78 | |
| Liberal Democrats | Christopher Harris | 1,351 | 15.35 | -5.32 | |
| Turnout | 8,800 | 57.21 | -3.35 | ||
| Conservative hold | |||||
| Conservative hold | |||||
| Conservative gain from Liberal Democrats | |||||
Windmill Hill
| Party | Candidate | Votes | % | ±% | |
|---|---|---|---|---|---|
| Green | Ed Plowden | 2,655 | 48.95 | +17.13 | |
| Green | Lisa Stone | 2,467 | 45.48 | +18.80 | |
| Labour | Aileen McLoughlin | 2,008 | 37.02 | +0.28 | |
| Labour | Ted Powell | 1,323 | 24.39 | -8.68 | |
| Conservative | Daniel Tristan Ford Angell | 349 | 6.43 | -0.13 | |
| Conservative | Anthony Frederick Scrase | 348 | 6.41 | +1.27 | |
| Liberal Democrats | Finn Conway | 315 | 5.81 | -14.79 | |
| Liberal Democrats | Vitor Manuel Brandao Moreira Da Silva | 200 | 3.69 | -13.78 | |
| Burning Pink | Rachel Lunnon | 90 | 1.66 | +1.66 | |
| Turnout | 5,424 | 50.97 | -0.02 | ||
| Green gain from Labour | |||||
| Green gain from Labour | |||||
By-elections
Southmead
| Party | Candidate | Votes | % | ±% | |
|---|---|---|---|---|---|
| Labour | Kye Dudd | 780 | 41.2 | -1.9 | |
| Green | Edward Burnham | 728 | 38.5 | +19.7 | |
| Conservative | Roddy Jaques | 279 | 14.8 | -13.4 | |
| Liberal Democrats | Gill Brooks | 82 | 4.3 | -5.7 | |
| TUSC | Tom Baldwin | 22 | 1.2 | N/A | |
| Majority | 52 | 2.7 | |||
| Turnout | 1,891 | 21.2 | |||
| Labour hold | Swing | ||||
Hotwells & Harbourside
At the time of this by-election, both Labour and Green Party held 24 seats on Bristol Council, making them the joint-largest parties. The Green gain in this by-election meant the Greens became the largest group on the council.
| Party | Candidate | Votes | % | ±% | |
|---|---|---|---|---|---|
| Green | Patrick McAllister | 537 | 43.0 | +11.0 | |
| Liberal Democrats | Stephen Williams | 511 | 40.9 | +7.6 | |
| Labour | Beryl Eileen Means | 153 | 12.2 | -13.1 | |
| Conservative | Eliana Barbosa | 34 | 2.7 | -6.6 | |
| Independent | Martin Booth (withdrawn) | 14 | 1.1 | N/A | |
| Majority | 26 | 2.1 | |||
| Turnout | 1,249 | ||||
| Green gain from Liberal Democrats | Swing | ||||
References
- ^ "Local elections postponed for a year over coronavirus". BBC News. 13 March 2020. Retrieved 13 March 2020.
- ^ a b c d e f g h i j k l m n o p q r s t u v w x y z aa ab ac ad ae af ag "Bristol City Council elections 2021: candidate list in full released". Bristol Live. Retrieved 17 April 2021.
- ^ "Local councillor elections turnout and results". Bristol City Council. 7 May 2021. Retrieved 7 May 2021.
- ^ "Labour loses its majority on Bristol City Council after 'purge' of Corbyn supporters". The Independent. 20 September 2016. Archived from the original on 21 September 2016. Retrieved 8 July 2019.
- ^ "Westbury-on-Trym and Henleaze by-election". Bristol City Council. Retrieved 8 July 2019.
- ^ "Labour calls on Bristol councillor to resign and trigger by-election after quitting party". BristolLive. 22 March 2019. Retrieved 8 July 2019.
- ^ "Brislington East councillor resigns from Tory party". Bristol247. 19 July 2019. Retrieved 20 July 2019.
- ^ "Brislington East By-election - bristol.gov.uk". Bristol City Council.
- ^ Teale, Andrew (16 January 2020). "Preview: 16 Jan 2020 – Britain Elects". Britain Elects. Retrieved 31 January 2020.
- ^ Gogarty, Conor (1 February 2020). "Bristol's longest-serving councillor 'deselected' by Tories". Bristol Post. Local World. Retrieved 3 February 2020.
- ^ "Entire Labour Party branch committee resigns en masse in row over election candidate selection". Bristol Live. 18 March 2021.
- ^ "Labour set for shake up ahead of local elections in Bristol". Meeting Place Communications. 3 July 2019. Archived from the original on 31 January 2020. Retrieved 31 January 2020.
- ^ Kate Wilson (24 April 2019). "Marvin Rees will be Labour's Bristol mayoral candidate after winning party ballot". Bristol Post. Retrieved 1 August 2019.
- ^ Esme Ashcroft (20 September 2018). "'Bristol needs a Mayor with the courage to get things done' says Green candidate". Bristol Post. Retrieved 1 August 2019.
- ^ a b Wilson, Kate (25 October 2019). "The Conservative candidate for Bristol's mayoral election next year". Bristol Post. Local World. Retrieved 3 February 2020.
- ^ "Tory candidate pulls out of Bristol mayoral election". 19 December 2020.
- ^ "Alastair Watson is new Tory mayoral candidate". 29 January 2021.
- ^ "'It's time to scrap the mayor, and we have a chance to do it'". 16 March 2021.
- ^ "Tory councillors launch petition for referendum on elected mayor". 25 March 2021.
- ^ "Ashley Ward". Bristol City Council.
- ^ "Avonmouth and Lawrence Weston Ward". Bristol City Council. Archived from the original on 1 December 2021.
- ^ "Bedminster Ward". Bristol City Council. 9 May 2021. Retrieved 9 May 2021.
- ^ "Bishopston and Ashley Down Ward". Bristol City Council.
- ^ "Bishopsworth Ward". Bristol City Council. 9 May 2021. Retrieved 9 May 2021.
- ^ "Central Ward". Bristol City Council. 9 May 2021. Retrieved 9 May 2021.
- ^ "Cotham Ward". Bristol City Council.
- ^ "Easton Ward". Bristol City Council. 9 May 2021. Retrieved 9 May 2021.
- ^ "Eastville Ward". Bristol City Council. 9 May 2021. Retrieved 9 May 2021.
- ^ "Frome Vale Ward". Bristol City Council. 9 May 2021. Retrieved 9 May 2021.
- ^ "Henbury and Brentry Ward". Bristol City Council. 9 May 2021. Retrieved 9 May 2021.
- ^ "Hengrove and Whitchurch Park Ward". Bristol City Council. 9 May 2021. Retrieved 9 May 2021.
- ^ "Hillfields Ward". Bristol City Council. 9 May 2021. Retrieved 9 May 2021.
- ^ "Horfield Ward". Bristol City Council. 9 May 2021. Retrieved 9 May 2021.
- ^ "Hotwells and Harbourside Ward". Bristol City Council. 9 May 2021. Retrieved 9 May 2021.
- ^ "Knowle Ward". Bristol City Council. 9 May 2021. Retrieved 9 May 2021.
- ^ "Lawrence Hill Ward". Bristol City Council.
- ^ "Local councillors elections results for Redland Ward". Bristol City Council. Archived from the original on 1 December 2021. Retrieved 9 May 2021.
- ^ "Southville Ward". Bristol City Council. 9 May 2021. Retrieved 9 May 2021.
- ^ "Local councillors elections results for St George Central Ward". Bristol City Council. Archived from the original on 9 May 2021.
- ^ "Local councillors elections results for St George Troopers Hill Ward". Bristol City Council. Archived from the original on 10 May 2021.
- ^ "Stockwood Ward". Bristol City Council. 9 May 2021. Retrieved 9 May 2021.
- ^ "Stoke Bishop Ward". Bristol City Council. 9 May 2021. Retrieved 9 May 2021.
- ^ "Westbury-on-Trym and Henleaze Ward". Bristol City Council. 9 May 2021. Retrieved 9 May 2021.
- ^ "Windmill Hill Ward". Bristol City Council.
| Bristol City Council | |
|---|---|
| Mayor of Bristol | |
| West of England Mayor | |
| Avon County Council |
|
| |