
| 2019 Atlantic hurricane season | |
|---|---|
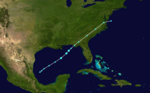
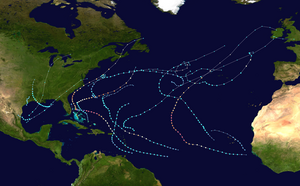 Season summary map | |
| Seasonal boundaries | |
| First system formed | May 20, 2019 |
| Last system dissipated | November 24, 2019 |
| Strongest storm | |
| Name | Dorian |
| • Maximum winds | 185 mph (295 km/h) (1-minute sustained) |
| • Lowest pressure | 910 mbar (hPa; 26.87 inHg) |
| Seasonal statistics | |
| Total depressions | 20 |
| Total storms | 18 |
| Hurricanes | 6 |
| Major hurricanes (Cat. 3+) | 3 |
| Total fatalities | 121 total |
| Total damage | $11.6 billion (2019 USD) |
| Related articles | |
The 2019 Atlantic hurricane season was the fourth consecutive above-average and damaging season dating back to 2016. The season featured eighteen named storms, however, many storms were weak and short-lived, especially towards the end of the season. Six of those named storms achieved hurricane status, while three intensified into major hurricanes.[nb 1] Two storms became Category 5 hurricanes, marking the fourth consecutive season with at least one Category 5 hurricane, the third consecutive season to feature at least one storm making landfall at Category 5 intensity, and the seventh on record to have multiple tropical cyclones reaching Category 5 strength. The season officially began on June 1 and ended on November 30. These dates historically describe the period each year when most tropical cyclones form in the Atlantic basin and are adopted by convention. However, tropical cyclogenesis is possible at any time of the year, as demonstrated by the formation of Subtropical Storm Andrea on May 20, making this the fifth consecutive year in which a tropical or subtropical cyclone developed outside of the official season.[2]
The season's first hurricane, Barry, formed in mid-July in the northern Gulf of Mexico and struck Louisiana. Barry caused two deaths and produced flooding in Arkansas, Alabama, Louisiana, and Mississippi, with damage totaling about $600 million (2019 USD).[nb 2] Hurricane Dorian, the most intense tropical cyclone of the season, proved to be the costliest natural disaster in the history of the Bahamas, becoming the strongest hurricane to strike the country. Overall, Dorian caused about $5.1 billion in damage and 84 fatalities, mostly in the Bahamas. The 2019 season was the record fourth consecutive season to feature at least one Category 5 hurricane. Tropical Storm Fernand left flooding in Mexico, with approximately $11.3 million in damage and one death. Hurricane Humberto produced extensive damage in Bermuda, totaling at least $25 million.
Drifting over Texas, Tropical Storm Imelda resulted in a devastating flood in the eastern portions of the state, with about $5 billion in damage and five fatalities. Lorenzo, which became the easternmost Category 5 Atlantic hurricane on record, caused 11 deaths after sinking the French tugboat Bourbon Rhode and 8 other fatalities from rough surf along the East Coast of the United States. With Dorian and Lorenzo both intensifying into Category 5 hurricanes, the season became one of seven seasons to feature multiple Category 5 hurricanes. Additionally, Tropical Storm Nestor caused a tornado outbreak across west Florida in mid-October, leaving $125 million in damage, while a car crash in South Carolina killed three people. Tropical Storm Olga caused moderate damage and heavy flooding over the central Gulf Coast and generated hurricane-force wind gusts as far north as Tennessee. The storm left one dead and around $400 million in damage. Hurricane Pablo became the easternmost hurricane formation on record, beating 2005's Hurricane Vince. The season concluded with Tropical Storm Sebastien, which became extratropical on November 24.
Most forecasting agencies projected a near-average or slightly above season, with many expecting near-normal sea surface temperatures but expressing uncertainty about the intensity of El Niño. Ultimately, activity in regards to number of named storms exceeded all forecasts, but the number of hurricanes and major hurricanes remained within the predicted range.
YouTube Encyclopedic
-
1/1Views:2 862
-
2019 ATLANTIC HURRICANE SEASON 19 DAYS!
Transcription
Seasonal forecasts
| Source | Date | Named storms |
Hurricanes | Major hurricanes | |
| Average (1981–2010)[3] | 12.1 | 6.4 | 2.7 | ||
| Record high activity[4] | 30 | 15 | 7† | ||
| Record low activity[4] | 1 | 0† | 0† | ||
| TSR[5] | December 11, 2018 | 12 | 5 | 2 | |
| CSU[6] | April 4, 2019 | 13 | 5 | 2 | |
| TSR[7] | April 5, 2019 | 12 | 5 | 2 | |
| NCSU[8] | April 16, 2019 | 13–16 | 5–7 | 2–3 | |
| TWC[9] | May 6, 2019 | 14 | 7 | 3 | |
| UKMO[10] | May 21, 2019 | 13* | 7* | 3* | |
| NOAA[11] | May 23, 2019 | 9–15 | 4–8 | 2–4 | |
| TSR[12] | May 30, 2019 | 12 | 6 | 2 | |
| CSU[13] | June 4, 2019 | 14 | 6 | 2 | |
| UA[14] | June 11, 2019 | 16 | 8 | 3 | |
| TSR[15] | July 4, 2019 | 12 | 6 | 2 | |
| CSU[16] | July 9, 2019 | 14 | 6 | 2 | |
| CSU[17] | August 5, 2019 | 14 | 7 | 2 | |
| TSR[18] | August 6, 2019 | 13 | 6 | 2 | |
| NOAA[19] | August 8, 2019 | 10–17 | 5–9 | 2–4 | |
| Actual activity | 18 | 6 | 3 | ||
| * June–November only. † Most recent of several such occurrences. (See all) | |||||
Ahead of and during the hurricane season, several national meteorological services and scientific agencies forecast how many named storms, hurricanes, and major hurricanes (Category 3 or higher on the Saffir–Simpson scale) are likely to form during a season and/or how many tropical cyclones will affect a particular country. These agencies include the Tropical Storm Risk (TSR) Consortium of University College London, the National Oceanic and Atmospheric Administration (NOAA) and Colorado State University (CSU). The forecasts include weekly and monthly changes in significant factors that help determine the number of tropical storms, hurricanes, and major hurricanes within a particular year. Some of these forecasts also take into consideration what happened in previous seasons and the state of the El Niño–Southern Oscillation (ENSO). On average, an Atlantic hurricane season between 1981 and 2010 contained twelve tropical storms, six hurricanes, and three major hurricanes, with an accumulated cyclone energy (ACE) index of between 66 and 103 units.[3] ACE is, broadly speaking, a measure of the power of a hurricane multiplied by the length of time it existed; therefore, long-lived storms and particularly strong systems result in high levels of ACE. The measure is calculated at full advisories for cyclones at tropical storm strength — storms with winds in excess of 39 mph (63 km/h).[20]
Pre-season outlooks
The first forecast for the year was released by TSR on December 11, 2018, which predicted a slightly below-average season in 2019, with a total of 12 named storms, 5 hurricanes, and 2 major hurricanes, due to the anticipated presence of El Niño conditions during the season.[5] CSU released their first forecast on April 4, 2019, predicting a near-average season with 13 named storms, 5 hurricanes and 2 major hurricanes, citing the persistence of the weak El Niño and slightly colder than average sea surface temperatures.[6] On April 5, TSR released an updated forecast that reiterated their earlier predictions.[7] North Carolina State University released their forecast on April 16, predicting slightly-above average activity with 13–16 named storms, 5–7 hurricanes and 2–3 major hurricanes.[8] On May 6, the Weather Company predicted a slightly-above average season, with 14 named storms, 7 hurricanes, and 3 major hurricanes.[9] The UK Met Office released their forecast on May 21, predicting 13 named storms, 7 hurricanes, 3 major hurricanes, and an accumulated cyclone energy of 109 units.[10] On May 23, NOAA released their first prediction, calling for a near-normal season with 9–15 named systems, 4–8 hurricanes, and 2–4 major hurricanes.[11] TSR released an updated forecast on May 30, which increased the number of forecast hurricanes from 5 to 6.[12]
Mid-season outlooks
On June 4, CSU updated their forecast to include a total of 14 named storms, 6 hurricanes, and 2 major hurricanes, including Subtropical Storm Andrea. CSU noted continuing uncertainty about the intensity of the El Niño, but also increasing ocean temperatures, which were near-normal by then.[13] The University of Arizona (UA) predicted on June 11 that the season would feature above-average activity – 16 named storms, 8 hurricanes, 3 major hurricanes, and accumulated cyclone energy index of 150 units.[14] On July 4, the TSR released their first mid-season outlook, still retaining their numbers from the previous forecast.[15] CSU released their second mid-season outlook on July 9, with the same remaining numbers from their previous forecast.[16] On August 5, the CSU released their third mid-season outlook, still retaining the same numbers from their previous forecast, albeit slightly revising the numbers of hurricanes from 6 to 7.[17] TSR released their second and final mid-season outlook on August 6, with the only changes of increasing the number of named storms from 12 to 13.[18] On August 8, NOAA released their second prediction with increasing the chances for 10–17 named storms, 5–9 hurricanes, and 2–4 major hurricanes, suggesting above-average activity.[19]
Seasonal summary


The 2019 Atlantic hurricane season officially began on June 1.[11] The season featured twenty tropical depressions, eighteen of which became tropical or subtropical storms.[21] With eighteen named storms, the season was at the time, along with 1969, the fourth most active since records began.[22] Six of those intensified into hurricanes, with three further strengthening into major hurricanes.[21] It was the fourth consecutive Atlantic hurricane season with above average activity, which last occurred from 1998–2001. Five systems developed in the Gulf of Mexico, tying with 1957 and 2003 for highest number of tropical cyclones forming in the region in a season.[23] Factors contributing to abnormally high activity included a stronger west-African monsoon, warmer than average ocean temperatures, and low wind shear, particularly over the western Atlantic and Gulf of Mexico.[11] Overall, the Atlantic tropical cyclones of 2019 collectively resulted in 116 deaths and around $11.62 billion in damage.[24] The season officially ended on November 30.[11]
Activity began before the official start of the season when Subtropical Storm Andrea formed on May 20. This marked the fifth consecutive year with a pre-season named storm, surpassing the previous record of four between 1951 and 1954.[25] No storms formed in the month of June, but activity resumed in July when Hurricane Barry developed on July 11 and Tropical Depression Three formed on July 22. Thereafter, tropical cyclogenesis ceased again for nearly one month,[21] until Tropical Storm Chantal developed on August 20.[26] The month of August featured two other systems, Hurricane Dorian and Tropical Storm Erin, with the former being the most intense tropical cyclone of the season.[21] Dorian peaked as a Category 5 hurricane with maximum sustained winds of 185 mph (295 km/h) and a minimum barometric pressure of 910 mbar (27 inHg).[27] The 2019 season also marked the fourth consecutive year with at least one Category 5 hurricane in the Atlantic basin, exceeding the previous record of three seasons between 2003 and 2005.[28]
September was the most active month of the season, featuring seven named storms, including Fernand, Gabrielle, Humberto, Imelda, Jerry, Karen, and Lorenzo.[21] On September 29, Lorenzo became the easternmost Category 5 hurricane on record. The season became only the seventh to feature multiple Category 5 hurricanes, the others being 1932, 1933, 1961, 2005, 2007, and 2017.[29] October featured above average activity, with the formation of Melissa, Nestor, Olga, Pablo, and Rebekah, though none remained a tropical or subtropical cyclone for more than three days.[21] Pablo became the easternmost hurricane on record, reaching that intensity east of the previous record-holder, Vince in 2005.[30] Aside from Rebekah persisting into November, the month featured one other system, Tropical Storm Sebastien. Activity during the 2019 Atlantic hurricane season concluded when Sebastien transitioned into an extratropical cyclone on November 24.[21] The seasonal activity was reflected with an Accumulated Cyclone Energy (ACE) index value of 132 units.[31]
Systems
Subtropical Storm Andrea

An upper-level trough originating in the mid-latitudes cut off into a broad upper-level low over Florida on May 17. The low moved eastward over the western Atlantic during the next day as a large area of convection formed to its east. It began interacting with low-level vorticity along the western edge of a dissipating cold front on May 19, with the two systems coalescing into a broad area of low pressure by 12:00 UTC on May 20. Convection associated with the low became better organized throughout that day as the system moved northward, with an Air Force reconnaissance later that day flight finding that the system had acquired a well-defined center of circulation, and was producing gale-force winds well away from the center. Based on the aircraft data and the structure of the system, the system became Subtropical Storm Andrea at 18:00 UTC on May 20 about 370 mi (595 km) southwest of Bermuda. However, the cyclone soon began to entrain dry air into its circulation while southwesterly wind shear increased, resulting in a rapid waning of the convection. By 12:00 UTC on May 21, the cyclone had degenerated into a remnant low after convection diminished. The remnant low moved east-northeastward through the following day until being absorbed by a cold front about 24 hours later roughly 70 mi (115 km) southwest of Bermuda.[32]
Hurricane Barry

A mesoscale convective vortex formed over the Central United States on July 2 and moved slowly eastward, southeastward, and then southwestward, reaching the Gulf of Mexico about a week later. The low, which had a large area of deep convection, gradually organized, becoming a tropical depression around 00:00 UTC on July 11 roughly 190 mi (305 km) south of Mobile, Alabama. With an increase in convective banding on the south side of the cyclone's circulation, the system quickly intensified into Tropical Storm Barry just six hours later. The cyclone moved westward and then west-northwestward along the periphery of a low- to mid-level ridge. Barry's convective structure remained asymmetrical, with nearly all of the convection location south of the circulation due to wind shear and dry air. Around 12:00 UTC on July 13, Barry intensified into a hurricane and peaked with winds of 75 mph (120 km/h). Three hours later, Barry made landfall near Intracoastal City, Louisiana. The system weakened to a tropical storm later on July 13 and to a tropical depression early on July 15, before transitioning into a remnant low over Arkansas by 12:00 UTC on July 15. The low continued north-northeastward until degenerating into a trough over Missouri on the next day.[33]
Barry caused two fatalities: a man was killed by a rip current off the coast of the Florida Panhandle on July 15, and another man was killed in Connecticut from fallen trees and wires after Barry's remnants passed through Connecticut.[34][35] In Mississippi, abnormally high tides caused minor coastal flooding in the vicinity of Biloxi. Widespread but minor wind and flood damage occurred across southern Louisiana. However, dozens of homes received extensive flood damage in Calcasieu Parish, where more than 20 people were rescued from floodwaters. Over 300,000 people throughout the state lost electricity. In Arkansas, the storm dropped 16.59 in (421 mm) of precipitation in Dierks. As a result, Barry became the rainiest tropical cyclone in the state's history.[33] Flooding damaged a number of homes, businesses, and roads in a narrow swath of southwestern Arkansas, while several roadways were closed, including a portion of Interstate 30.[36] Damage from Barry totaled roughly $600 million.[33]
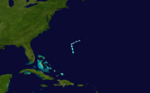
Tropical Depression Three


A tropical wave moved off the west coast of Africa on July 12, producing minimal convection as it moved westward across the tropical Atlantic for several days thereafter. The wave fractured as it approached the Lesser Antilles on July 18, with the northern portion turning northwestward and the southern portion continuing westward across the Caribbean Sea. The northern portion of the wave produced intermittent disorganized convection until reaching the southeastern Bahamas on July 21. Early the following day, a concentrated area of deep convection developed, resulting in the formation of a tropical depression just east of Andros at 12:00 UTC on July 22. However, environmental conditions caused deep convection to decrease substantially shortly after formation. Although a small area of convection re-developed on July 23, it was insufficient to maintain the cyclone, and it degenerated into an open trough at 12:00 UTC on July 23 about 35 mi (55 km) east-northeast of Cape Canaveral, Florida.[37]
Numerous thunderstorms developed across South Florida on July 23 in association with the tropical depression. A woman was injured by a lightning strike in Aventura by a storm.[38]
Tropical Storm Chantal


On August 14, a cold front moved across the Southeastern United States, becoming nearly stationary over subsequent days. The interaction between the stalled cold front and a high-pressure system led to the formation of a low-pressure area near Savannah, Georgia, on August 17. By 18:00 UTC on August 20, the small system gained enough organization to be declared a tropical depression about 370 mi (595 km) southeast of Halifax, Nova Scotia. Six hours later, the depression intensified into Tropical Storm Chantal. The system failed to intensify further and soon encountered colder waters and increasing southwesterly wind shear. Instead, Chantal weakened to a tropical depression early on August 22 and ultimately degenerated to a remnant low by 18:00 UTC the next day. The remnant low executed a clockwise loop and dissipated three days later about 830 mi (1,335 km) southeast of Cape Race, Newfoundland.[26]
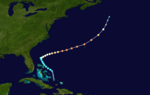
Hurricane Dorian


A tropical wave exited the west coast of Africa on August 19 and organized as it moved westward, becoming a tropical depression early on August 24 approximately 805 mi (1,295 km) east-southeast of Barbados. The depression quickly developed curved banding features and intensified into Tropical Storm Dorian later that day while heading west-northwestward. Dry air prevented any significant further intensification and organization for several days. Early on August 27, Dorian struck Barbados as a very compact cyclone with winds of 50 mph (85 km/h) and then passed over Saint Lucia later that day. The mountainous terrain of Saint Lucia disrupted the storm's circulation, though a new circulation formed farther to the north. Dorian resumed organizing while moving northeastward over the Caribbean, with a partial eyewall and inner core developing by August 28. The cyclone reached hurricane intensity at 15:30 UTC on August 28 while striking the eastern tip of Saint Croix in the U.S. Virgin Islands; another landfall occurred on Saint Thomas a few hours later. After emerging into the Atlantic on August 28, Dorian eventually began moving west-northwestward due to an upper-level low moving to the south and a subtropical ridge expanding westward.[27]
Encountering very warm water temperatures, ample moisture, and low wind shear, Dorian began rapidly intensifying on August 30, reaching major hurricane intensity around 18:00 UTC that day. Strengthening further, the cyclone became a Category 5 hurricane at 12:00 UTC on September 1, a few hours prior to making landfall on Elbow Cay in the Abaco Islands with winds of 185 mph (295 km/h); Dorian became the strongest tropical cyclone on record to strike the Bahamas. A weakening high pressure area to the north and collapsing steering currents caused Dorian to move very slowly. The cyclone struck Grand Bahama early on September 2 while still a Category 5 hurricane. The storm weakened due to land interaction and upwelling, falling below major hurricane late on September 3. An eastward-moving, large mid-level trough forced Dorian to move north-northwestward and then northward, causing it to remain offshore Florida. The cyclone re-strengthened into a Category 3 hurricane over the Gulf Stream on September 5, but weakened back to a Category 2 later that day. Dorian then curved northeastward and scraped the Outer Banks of North Carolina on September 6 before moving ashore at Cape Hatteras with winds of 100 mph (155 km/h). Embedded within the mid-latitude flow, the cyclone accelerated northeastward and transitioned into an extratropical cyclone late on September 7. The remnant extratropical storm struck Nova Scotia and later Newfoundland before being absorbed by an extratropical cyclone on September 9.[27]
Throughout the Windward Islands, the storm produced wind gusts up to 61 mph (98 km/h), observed on Martinique. Approximately 4,000 homes lost electricity and many streets became impassable due to flooding.[39] Mostly minor damage occurred in Barbados.[40] Some areas of the U. S. Virgin Islands reported hurricane-force winds, with Buck Island observing sustained winds of 82 mph (132 km/h).[27] Winds from Dorian left island-wide blackouts on Saint Thomas and Saint John, while 25,000 customers lost power on Saint Croix.[41][42] In the British Virgin Islands, the storm caused flood and wind damage in the outskirts of Road Town.[43] One death occurred in Puerto Rico during preparations for the storm.[44] Gusty winds left roughly 23,000 households without electricity across the island.[41] Dorian inflicted catastrophic damage in some regions of the Bahamas. Approximately 87 percent of the damage nationwide occurred in the Abaco Islands, where the storm struck at peak intensity and generated winds of at least tropical storm-force for more than three days. Around 75 percent of homes there were damaged to some degree.[27] Further, Dorian damaged about 90 percent of infrastructure in Marsh Harbour and obliterated shanty-type homes in the town.[45][46] Grand Bahama also experienced extreme impacts,[27] with storm surge submerging at least 60 percent of the island. The hurricane severely damaged or destroyed around 300 homes on the island. Throughout the Bahamas, an estimated 13,000 homes suffered severe damage or were completely destroyed,[47] while at least 70,000 people were left homeless.[48] Dorian killed at least 70 people and caused at least $3.4 billion in damage, making it the costliest hurricane in the country's history.[27]
Over 160,000 electrical customers in Florida lost power during the storm.[49] Dorian caused coastal flooding in some areas, especially in immediate oceanfront or riverfront sections of St. Augustine and Jacksonville.[50] Six deaths occurred in the state.[51] Strong winds in South Carolina downed numerous trees and power lines,[27] leaving more than 270,000 residences and workplaces without power.[52] Coastal flooding and flash flooding impacted the Charleston and Georgetown areas. Three tornadoes in Horry County also caused damage.[53] The eastern portions of the state experienced storm surge ranging from 4 to 7 ft (1.2 to 2.1 m), wind gusts up to 110 mph (180 km/h), rainfall totals between 5 and 10 in (130 and 250 mm),[54] and 25 tornadoes.[55] Dare County was particularly hard hit, with 1,126 structures damaged.[56] The storm also destroyed 20-25 percent of the state's tobacco crop.[57] Three deaths were reported in North Carolina.[58] Gusty winds and beach erosion occurred in other states along the East Coast, especially in Delaware and New Jersey. Damage in the United States totaled roughly $1.6 billion.[27] In Canada, the extratropical remnants of Dorian left about 412,000 customers without power in Nova Scotia and another 80,000 in New Brunswick, with the former representing approximately 80 percent of the province.[59] The storm damaged homes, buildings, and boats, as well as downed trees, across Canadian Maritimes, though the worst impacts occurred in Halifax, Moncton, and much of Prince Edward Island. Insured damage alone reached $78.9 million.[60]
Tropical Storm Erin


On August 20, a large upper-level trough with a large area of disorganized convection formed over the southwestern Atlantic. As the trough weakened, a shortwave moved into the western side of the trough over the Gulf of Mexico, resulting in the formation of a broad area of low pressure on August 22. The low drifted northwestward, moving over southeastern Florida on August 24 and degenerating into a trough of low pressure. However, deep convection increased along the trough early on August 26, and a new low developed, with a tropical depression forming at 12:00 UTC that day about 345 mi (555 km) south-southeast of Cape Hatteras, North Carolina. The depression moved southwestward in response to a mid-level high-pressure area near Florida. Initially poorly-organized due to northwesterly wind shear, the depression strengthened into Tropical Storm Erin late on August 27 following the development of a large burst of convection. Erin then turned sharply northwestward as the mid-level high weakened and a subtropical ridge strengthened to its northeast. Strong upper-level winds weakened the storm to a tropical depression late on August 28. Accelerating northeastward, Erin became extratropical at 12:00 UTC on August 29, and was absorbed by a larger extratropical low 12 hours later.[61]
In Nova Scotia, precipitation from the remnants of Erin was higher than for all of July and August combined before the storm. According to the Meteorological Service of Canada, the Annapolis Valley and the Bay of Fundy region received the most precipitation with a maximum of 6.4 in (162 mm) at Parrsboro and 5.0 in (127 mm) at Greenwood. Several stations reported rates greater than 1.2 in (30 mm), resulting in increased runoff, causing flash floods and the wash out of roads.[62] Rain affected the southern part of New Brunswick with maximum totals of 2.2 in (56 mm) in Fredericton, 2.0 in (50 mm) in Moncton, and 1.7 in (44 mm) in Saint John.[63] In Prince Edward Island, accumulations reached 2.6 in (66 mm) in Summerside.[64] In Quebec, regions near the Gulf of St. Lawrence observed about 2.0 in (50 mm) of rain.[65]
Tropical Storm Fernand


Throughout the second half of August, an upper-level low progressed eastward from the southeastern United States to Bermuda, southward to Puerto Rico, and westward across Hispaniola and Cuba. A weak and broad area of low pressure formed near western Cuba on August 30 and drifted slowly west across the Gulf of Mexico. Deep convection coalesced within curved bands around the center, leading to the formation of Tropical Storm Fernand around 12:00 UTC on September 3. Despite the influence of moderate east-southeasterly wind shear, the cyclone attained peak winds of 50 mph (85 km/h) by early on September 4 before beginning a steady weakening trend. Fernand progressed south of a ridge over the south-central United States, making landfall about 30 mi (50 km) north-northeast of La Pesca, Tamaulipas, at 15:30 UTC on September 4. It weakened quickly once inland and dissipated over the rugged terrain of Mexico by 06:00 UTC on September 5.[66]
Fernand brought torrential rainfall to the Mexican states of Coahuila, Nuevo León, Tamaulipas, and San Luis Potosí. Fernand also dumped heavy rainfall over South Texas. In preparation for the storm, the Mexican government activated Plan DN-III-E, sending 4,000 troops to the northeastern states to assist in disaster relief. In Nuevo León, schools and public transport lines were closed on September 5 but resumed operations the next day. In some areas six months of rain fell in six hours. Landslides were reported near the state's capital, Monterrey. Homes, roads, bridges, and at least 400 schools were damaged. In García, a Venezuelan man died after he was swept away by floodwaters while attempting to clear a drain; the two people he was working with managed to escape. On September 7, governor of Nuevo León, Jaime Rodríguez Calderón, declared a state of emergency to request for state funds to address the damage. Elsewhere, in Tamaulipas, 12 in (300 mm) of rain fell in 48 hours, leading to some localized flooding.[67][68] Damage throughout Mexico totaled approximately $11.3 million.[69]
Tropical Storm Gabrielle


A tropical wave moved westward from Africa on August 30, organizing into a tropical depression around 18:00 UTC on September 3 about 455 mi (730 km) west of the northern Capo Verde Islands. Though the nascent tropical cyclone tracked northwest in an environment of moderate southwesterly wind shear and dry mid-level air, it intensified into Tropical Storm Gabrielle six hours after genesis. Interaction with an upper-level low further compounded negative environmental factors, causing the system to lose a majority of its convection for nearly a day. As the steering regime transitioned to be dictated by a break in the subtropical ridge, Gabrielle curved west-northwest and then north. A decrease in upper-level winds led to the formation of a well-defined inner core, and Gabrielle attained peak winds of 65 mph (100 km/h) on September 8. Thereafter, the influence of mid-latitude westerlies caused the cyclone to turn northeast and begin extratropical transition, completing it by 12:00 UTC on September 10 490 mi (790 km) northwest of the western Azores islands. The post-tropical cyclone persisted for a day before degenerating to an open trough.[70]
Hurricane Humberto

A tropical wave left Africa on August 27 and moved steadily westward for several days. Throughout early September, the wave underwent prolonged interaction with an upper-level trough in the central and southwestern Atlantic that culminated in the formation of a tropical depression at 18:00 UTC on September 13 east of Eleuthera in The Bahamas. The depression intensified into Tropical Storm Humberto six hours later and tracked northwest, where steadily improving environmental conditions allowed it to become a hurricane by September 16. After turning sharply northeast, the storm continued to intensify. At 00:00 UTC on September 18, Humberto attained peak winds of 125 mph (205 km/h), and the Category 3 hurricane passed about 65 mi (100 km) northwest of Bermuda at that intensity. High wind shear and dry air caused Humberto to embark on a weakening trend thereafter, and it transitioned into an extratropical cyclone by 00:00 UTC on September 20 about 575 mi (925 km) south-southwest of Cape Race after being stripped of its convection. The extratropical low was absorbed by a larger non-tropical feature eighteen hours later.[71]
Breezy winds and light rainfall were recorded in The Bahamas, where Dorian caused devastation two weeks prior. Humberto's large size caused choppy seas along the East Coast of the United States for several days; rip currents killed one person in Florida and a second in North Carolina. In addition, 21 water rescues were performed in St. Johns County, Florida. Tropical storm-force wind gusts, light rainfall, and minor storm surge were felt along the eastern shores of the state.[71] Extensive beach erosion and minor structural damage were reported along the northwestern coast of Puerto Rico.[72] On Bermuda, the most significant impacts were wrought by sustained winds up to 110 mph (177 km/h), causing widespread damage to trees, roofs, crops, and power lines. As many as 600 buildings—including L.F. Wade International Airport, Royal Naval Dockyard, and the Bermuda Weather Service—suffered damage,[73][74][75] around 28,000 customers were left without power,[71] and the island's banana crop suffered a 90 percent loss.[76] Overall, Bermuda reported at least $25 million in damage.[71]
Hurricane Jerry


A tropical wave crossed Africa's western coast late on September 11. It spawned an elongated area of low pressure four days later, and that feature gradually organized into a tropical depression by 06:00 UTC on September 17 while located about 1,100 mi (1,770 km) east of the Windward Islands. A strong ridge steered the system west-northwest for several days. Although moderate northeasterly wind shear initially hampered its development, the depression intensified into Tropical Storm Jerry by 06:00 UTC on September 18 and began rapid intensification eighteen hours later. Jerry attained hurricane strength early on September 19 and reached its peak at Category 2 intensity, with winds of 105 mph (165 km/h), early on September 20; this peak was attained despite a fairly asymmetric cloud pattern. Shortly thereafter, increasing upper-level winds and dry air caused the cyclone to weaken while it curved northwest. Jerry fell to tropical storm intensity early on September 21, and it degenerated to a post-tropical cyclone by 18:00 UTC on September 24 roughly 280 mi (450 km) west-southwest of Bermuda, having lost organized deep convection over its center. The remnants of Jerry passed near Bermuda before dissipating northeast of the island on September 28.[77]
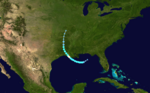
Tropical Storm Imelda


An upper-level low detached from a broader trough over the eastern United States in early September, moving southwestward into the eastern Gulf of Mexico by September 12. A weak trough formed in the vicinity of this feature and moved toward the west, ultimately leading to the formation of a tropical depression around 12:00 UTC on September 17 a short distance southwest of Freeport, Texas, despite the NHC estimating a low chance of tropical cyclone development. The depression quickly intensified into Tropical Storm Imelda three hours later and peaked with maximum sustained winds of 45 mph (75 km/h) before striking Freeport at 17:45 UTC. Imelda drifted slowly northward once inland, weakening to a tropical depression by 00:00 UTC on September 18 and degenerating into a trough 24 hours later. The remnants of Imelda drifted over Texas and Oklahoma for several days before dissipating.[78]
Imelda brought catastrophic flooding to Southeast Texas, with a peak total of 44.29 in (1,125 mm) near Fannett. The storm ranks as the fifth-wettest tropical cyclone to strike the continental United States. Numerous roadways in Greater Houston and eastward became submerged, including Interstate 10, with floodwaters entering thousands of cars. In Jefferson County, flooding resulted in several hundreds of high-water rescues. Approximately 5,100 homes suffered water damage in Jefferson County alone, while roughly 3,100 others were damaged in Harris, Liberty, and Montgomery counties combined. An EF1 tornado in Harris County ripped off a metal roof and a few tree branches while destroying a barn. Damage from Imelda totaled close to $5 billion. Heavy rainfall also extended eastward into Louisiana, though flooding impact was mostly minor. In Cameron Parish, an EF0 tornado damaged two recreational vehicles and toppled several trees. The storm caused at least five deaths, all in Texas.[78]
Tropical Storm Karen


On September 14, a tropical wave emerged into the Atlantic from the west coast of Africa. By early on September 21, a low developed along the axis of the wave, resulting in an increase in deep convection. The system developed a closed center of circulation and became a tropical depression around 00:00 UTC on September 22 roughly 115 mi (185 km) east of Trinidad. About six hours later, the depression intensified into Tropical Storm Karen. The cyclone moved west-northwestward around the southwestern periphery of an Atlantic subtropical ridge and passed through the Windward Islands as a minimal tropical storm late on September 22. Dry air and strong wind shear weakened Karen back to a tropical depression early on September 23 as it turned northward, before re-intensifying into a tropical storm about 24 hours later after encountering favorable conditions again. Late on September 24, Karen struck the Puerto Rican islands of Culebra and Vieques before entering the Atlantic. Tracking north-northeastward, the cyclone eventually began interacting with a surface trough and encountered strong wind shear again. As a result, Karen weakened to a tropical depression on September 27 and dissipated about six hours later approximately 345 mi (555 km) southeast of Bermuda.[79]
With the formation of Karen, tropical storm warnings and red alerts were issued for Trinidad and Tobago.[80] Karen brought severe flash floods to Tobago, trapping some people in their houses, as well as uprooting trees and causing several power outages.[81] Several roads were blocked due to mudslides and downed trees. In addition, seven boats in Plymouth sank after a jetty broke.[82] It was also announced that all schools would be closed on September 23.[83] Swells generated by Karen in Venezuela caused flooding and power outages in Caracas and La Guaira.[84] Tropical storm watches were issued for Puerto Rico and the Virgin Islands in anticipation of Karen.[79] Puerto Rico governor Wanda Vázquez Garced declared a state of emergency on September 23 and ordered schools and government offices to close. The Virgin Islands also closed their schools as the storm approached.[85] People who were living in flood-prone areas were asked to seek shelter.[86] The U.S. Virgin Islands and Puerto Rico experienced heavy rains, mudslides, and power outages, with more than 29,000 people losing power in the latter.[85][87] Mudslides and runoff blocked several roads in Puerto Rico, especially in Barranquitas, Cayey, and Guayama.[79]
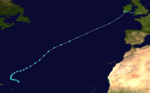
Hurricane Lorenzo


A tropical wave emerged into the Atlantic from the west coast of Africa on September 22. The wave rapidly organized into a tropical depression around 00:00 UTC on September 23 about 320 mi (515 km) southwest of Dakar, Senegal. Six hours later, the depression strengthened into Tropical Storm Lorenzo. A subtropical ridge to the north initially steered the storm westward to west-northwestward. Wind shear interrupted further strengthening on September 24. However, decreasing wind shear on the following day allowed rapid intensification to commence. Lorenzo attained hurricane intensity early on September 25 and then reached an initial peak as a Category 4 hurricane with winds of 145 mph (230 km/h). The system then curved northwestward due to a break in the subtropical ridge. An eyewall replacement cycle and intruding dry air caused the storm to weaken to a Category 3 hurricane late on September 27. The storm then curved northward across the western end of the subtropical ridge.[88]
After completing the eyewall replacement cycle, Lorenzo underwent a second bout of rapid intensification. At 03:00 UTC on September 29, the cyclone peaked as a Category 5 hurricane with maximum sustained winds of 160 mph (260 km/h). This made Lorenzo the easternmost Category 5 Atlantic hurricane on record. After reaching peak intensity, Lorenzo began weakening due to upwelling and rapidly increasing southwesterly wind shear. Lorenzo dropped below major hurricane intensity at 18:00 UTC on September 29, only 15 hours after its peak intensity. Lorenzo then slowly weakened and its windfield expanded as the storm began an extratropical transition while passing northwest of the Azores. The storm became fully extratropical at 12:00 UTC on October 2 roughly 240 mi (385 km) north of Graciosa. On October 3 and October 4, the system impacted the British Isles before dissipating entirely.[88]
The French tugboat Bourbon Rhode sank on September 26 near the storm's center with 14 crew members. Three people were rescued due to search and rescue operations, while four bodies were found; the other seven people were presumed to have drowned. Although the storm remained more than 2,000 mi (3,220 km) offshore the United States, swells and rip currents resulted in eight deaths, with one in Florida, four in North Carolina, two in New York, and one in Rhode Island. In the Azores, Lorenzo caused the worst impacts on Corvo and Flores, with both islands reporting many downed trees and power lines. On the latter, the storm destroyed the commercial port at Lajes Field. Corvo recorded sustained winds of 74 mph (119 km/h) and gusts reaching 101 mph (163 km/h). Rough seas resulted in the evacuations of about 100 people from their homes throughout the Azores, with waves approaching streets and homes in the city of Horta. In Ireland, the remnants of Lorenzo produced wind gusts up to 66 mph (105 km/h) at the Mace Head Atmospheric Research Station. Downed trees and power lines left roughly 20,000 customers without electricity throughout Ireland.[88]
Tropical Storm Melissa


A potent nor'easter, which originated from the tail-end of a cold front across the southwestern Atlantic on October 6, detached from the frontal boundary and attained maximum 1-minute winds of 65 mph (100 km/h) by October 10. Deep convection formed north of the low's center, leading to the formation of Subtropical Storm Melissa by 06:00 UTC on October 11 about 205 mi (330 km) south-southeast of Nantucket, Massachusetts. Although the system's peak winds decreased over the next day, the radius of tropical storm-force winds contracted significantly while thunderstorm activity became concentrated over the center. This marked Melissa's transition into a tropical storm by 12:00 UTC on October 12. As the system moved east-northeast, it lost its associated convection under the influence of moderate westerly shear and colder water temperatures early on October 14. Melissa soon merged with a nearby front and became extratropical by 12:00 UTC about 370 mi (595 km) south of Cape Race. The post-tropical low degenerated into a trough a few hours later.[89]
The nor'easter and subsequent (sub)tropical storm caused heavy surf and storm surge along the coast of the Mid-Atlantic States. In Maryland, flooding from increased high tides from the storm forced street closures in Crisfield and Salisbury.[90] In Delaware, waves from the storm caused beach erosion and flooded streets in Bethany Beach while homes and streets were flooded in Dewey Beach.[91][92] Waves from the storm caused coastal flooding in various parts of the Jersey Shore, including Long Beach Island and Atlantic City. The flooding forced the cancellation of the first day of the LBI International Kite Festival.[93] Rainfall accumulations from the system peaked at 3.43 in (87 mm) in Nantucket, Massachusetts. Parts of southeastern Massachusetts experienced sustained tropical-storm-force winds, with a peak sustained wind of 49 mph (80 km/h) and a peak gust of 66 mph (106 km/h) recorded at Wellfleet.[89]
Tropical Depression Fifteen


A vigorous late-season tropical wave, accompanied by a broad area of low pressure and a large mass of deep convection, moved off the west coast of Africa on October 13. The broad low separated from the parent wave, moving slowly northwestward as the wave continued westward across the tropical Atlantic. Thunderstorm activity associated with the low became better organized early the following day, resulting in the formation of a tropical depression at 12:00 UTC on October 14 roughly 345 mi (555 km) southeast of the Cabo Verde Islands. As the depression moved northwestward toward the Cape Verde islands, it encountered a hostile environment of high wind shear and abundant dry air, which prevented further strengthening. The depression quickly became poorly organized, and it degenerated into a broad area of low pressure by 06:00 UTC on October 16. The remnant low continued northwestward, producing intermittent convection until its dissipation late on October 17.[94]
Tropical Storm Nestor

A tropical wave exited the west coast of Africa on October 3. Convection increased slightly as the wave entered the eastern Caribbean on October 8. Another increase in convection occurred as the wave crossed Central America, partially due to interaction with the Central American gyre. The wave split, with the southern portion becoming Tropical Storm Priscilla in the eastern Pacific basin and the northern portion reaching the Bay of Campeche. A gale-force low formed over the Gulf of Mexico on October 17, which became Tropical Storm Nestor late on October 18. With sustained winds already at 60 mph (95 km/h), the storm moved rapidly northeastward toward the Florida Panhandle. However, an approaching mid- to upper-level trough and associated frontal system caused Nestor to become elongated and left little convection near the center. As a result, Nestor became extratropical around 12:00 UTC on October 19. About five hours later, the extratropical storm made landfall near St. Vincent Island. The remnants of Nestor continued northeastward across the Southeastern United States before dissipating offshore the Delmarva Peninsula on October 21.[95]
Rainfall and storm surge from Nestor caused coastal flooding and flash flooding across the Florida Panhandle and the state's gulf coast. Freshwater flooding inundated several roads in the St. Petersburg area. However, tornadoes also caused significant damage,[95] with the storm spawning four in the state.[96] The strongest was rated EF2 and remained on the ground for roughly 30 minutes for a distance of about 11.45 mi (18.43 km)—an uncommonly long track for the region—through western Polk County, from the Lakeland Linder International Airport to northwest Polk County. The tornado caused modest damage to homes, overturned a semi-truck on Interstate 4, and ripped off a large portion of a roof of a middle school.[97] In Pinellas County, an EF0 tornado damaged several mobile parks and downed trees in Seminole.[98] An EF1 tornado briefly touched down in northwest Cape Coral, causing damage to 18 homes and vehicles.[99] The fourth tornado, rated EF0, caused no damage in Brevard County.[100] Two other tornadoes were confirmed in Georgia and South Carolina as well. Heavy rains from Nestor caused a car crash in South Carolina, which killed three people and left five injured. The storm inflicted approximately $125 million in damage throughout the United States.[95]
Hurricane Pablo


On October 22, a baroclinic low developed over the central Atlantic. The low soon generated gale-force winds, while vorticity centers formed by the following day. The easternmost center became dominant, with convection developing around it by early on October 25. As a result, the low became Subtropical Storm Pablo approximately 405 mi (650 km) west-southwest of the western Azores. Pablo moved east-northeastward and acquired tropical characteristics, becoming a tropical storm late on October 25 after developing central dense overcast and anticyclonic outflow. An eye-like feature also briefly appeared on satellite imagery around this time. The system then curved east-southeastward early on October 26, before turning east-northeastward later that day and then northeastward by October 27. After passing just southeast of the Azores, the storm intensified further and developed more convection and a small eye. Pablo reached hurricane intensity on October 27 and peaked with maximum sustained winds of 80 mph (130 km/h). Pablo reached hurricane intensity at 18.8°W,[101] farther east than any other Atlantic hurricane, beating Hurricane Vince's record of 18.9°W.[30] Pablo then weakened due to cold sea surface temperatures, falling to tropical storm intensity early on October 28. The storm then became extratropical after merging with a cold front about 720 mi (1,160 km) north-northeast of the Azores, before dissipating completely on October 29.[101]
Tropical Storm Olga


A well-organized tropical wave crossed the west coast of Africa on October 8 and entered the Atlantic Ocean. The wave headed westward with intermittent convection, reaching the Caribbean on October 17 and Central America by October 22. After reaching the Gulf of Mexico, a low-pressure formed on October 24. After scatterometer data and satellite imagery indicated the presence of a closed circulation, the system developed into Tropical Storm Olga at 12:00 UTC the following day roughly 390 mi (630 km) south-southwest of Lake Charles, Louisiana. Olga moved north-northeastward and peaked with winds of 45 mph (75 km/h). However, the storm transitioned into an extratropical cyclone by 00:00 UTC on October 26 after becoming embedded within a cold front. The remnants of the cyclone struck central Louisiana about seven hours later and continued across the Eastern United States and into Ontario, where they dissipated on October 28.[102]
In Louisiana, the remnants of Olga produced sustained winds of 55 mph (89 km/h) and gusts up to 72 mph (116 km/h), the former observed in Baton Rouge and the latter in Mendeville.[102] Gusty winds resulted in 132,000 customers losing electricity.[103] Louisiana also reported up to 10.24 in (260 mm) of precipitation near Ponchatoula, with lesser amounts elsewhere in the state. Hurricane-force wind gusts impacted parts of Mississippi,[102] where the remnants of Olga damaged or destroyed 772 homes, 26 businesses, and 27 roads; Tupelo was particularly hard hit. At least 154,000 power outages occurred in Mississippi.[104] One person died in Newton County when a tree struck him while he while cleaning-up debris.[105] In Tennessee, a wide swath of winds up to 96 mph (154 km/h) caused almost 65,000 power outages,[106][107] forcing school closures for up to two weeks in several counties.[107] Falling trees resulted in one death in Adamsville. Total damage along the path of the cyclone was estimated at $400 million.[102]
Subtropical Storm Rebekah


On October 27, a large extratropical cyclone formed about 460 mi (760 km) south of Cape Race. Moving eastward, the cyclone quickly gained hurricane-force winds, before weakening as it turned north and west in a large counterclockwise loop, making another smaller loop on its way. A smaller low-pressure area formed on near the center of the original extratropical cyclone on October 29, possessing a small wind field more characteristic of a tropical cyclone. Deep convection formed around the center of the new low on October 30 due to increased atmospheric instability despite sea surface temperatures of only 70 °F (21 °C), leading to the development of Subtropical Storm Rebekah at 12:00 UTC. The system was designated as a subtropical storm due to a lack of both separation with the parent upper-level low and significant outflow, which are common characteristic of tropical cyclones. At this time, Rebekah possessed sustained winds of 50 mph (85 km/h), representing the system's peak intensity. On October 31, Rebekah turned to the east then east-northeast, entering a region of low relative humidity, increasing wind shear, and even colder sea surface temperatures. The system rapidly weakened as a result of these unfavorable environmental factors. Rebekah became extratropical once again on November 1 at 06:00 UTC and dissipated later that day about 115 mi (185 km) north of the Azores.[108]
Tropical Storm Sebastien

In late November, a series of mid- to upper-level troughs progressed across the central subtropical Atlantic, giving way to a large area of disturbed weather. Enhanced by a convectively-coupled kelvin wave, the disturbance coalesced over the next few days and was designated as Tropical Storm Sebastien around 06:00 UTC on November 19 to the northeast of the Leeward Islands. The system, initially moving west-northwest, curved toward the east-northeast ahead of an approaching upper-level trough. At the same time, Sebastien gradually intensified despite an impinging cold front and moderate wind shear. The cyclone attained peak winds of 70 mph (110 km/h) early on November 23, when it exhibited a mid-level eye feature. Significantly colder waters and strong shear soon took their toll on Sebastien, causing it to become an extratropical cyclone by 00:00 UTC on November 25. The post-tropical cyclone continued northeast, crossing southwestern Ireland before turning southeast into the Irish Sea and across western England by November 27. The low dissipated just west of London around 18:00 UTC that day.[109]
Storm names
The following list of names was used for named storms that formed in the North Atlantic in 2019.[110] This was the same list used in the 2013 season, with the exception of the name Imelda, which replaced Ingrid.[111] Imelda was used as a storm name for the first time in 2019, as were Nestor, and Rebekah.
Retirement
On March 17, 2021, during the joint 42nd and 43rd Sessions of the RA IV Hurricane Committee, the World Meteorological Organization retired the name Dorian from its rotating name lists due to the catastrophic damage it caused, and it will not be used again in the North Atlantic basin. Dorian was replaced with Dexter, which will first appear on the 2025 season list.[112][113][114] Originally, any names retired from the 2019 list were to have been announced in the spring of 2020, but this was delayed to the following year due to the COVID-19 pandemic.[115][116]
Season effects
This is a table of all of the tropical cyclones that formed in the 2019 Atlantic hurricane season. It includes their name, duration, peak classification and intensities, areas affected, damage, and death totals. Deaths in parentheses are additional and indirect (an example of an indirect death would be a traffic accident), but were still related to that storm. Damage and deaths include totals while the storm was extratropical, a wave, or a low, and all of the damage figures are in 2019 USD.
| Saffir–Simpson scale | ||||||
| TD | TS | C1 | C2 | C3 | C4 | C5 |
| Storm name |
Dates active | Storm category at peak intensity |
Max 1-min wind mph (km/h) |
Min. press. (mbar) |
Areas affected | Damage (USD) |
Deaths | Ref(s) | ||
|---|---|---|---|---|---|---|---|---|---|---|
| Andrea | May 20–21 | Subtropical storm | 40 (65) | 1006 | Bermuda | None | None | |||
| Barry | July 11–15 | Category 1 hurricane | 75 (120) | 993 | Midwestern United States, Eastern United States, Louisiana, Arkansas, Oklahoma, Great Lakes region | $600 million | 1 (1) | [34][35][33] | ||
| Three | July 22–23 | Tropical depression | 35 (55) | 1013 | The Bahamas, Florida | None | None | |||
| Chantal | August 20–23 | Tropical storm | 40 (65) | 1007 | East Coast of the United States | None | None | |||
| Dorian | August 24 – September 7 | Category 5 hurricane | 185 (295) | 910 | Windward Islands, Leeward Islands, Puerto Rico, the Bahamas, East Coast of the United States, Eastern Canada | >$5.07 billion | 77 (7) | [44][27] [51][58] [60] | ||
| Erin | August 26–29 | Tropical storm | 40 (65) | 1002 | Cuba, The Bahamas, East Coast of the United States, Atlantic Canada | Minimal | None | |||
| Fernand | September 3–5 | Tropical storm | 50 (85) | 1000 | Northeastern Mexico, South Texas | $11.3 million | 1 | [67][68] [69] | ||
| Gabrielle | September 3–10 | Tropical storm | 65 (100) | 995 | Cape Verde, Ireland, United Kingdom | None | None | |||
| Humberto | September 13–19 | Category 3 hurricane | 125 (205) | 950 | Hispaniola, Cuba, Bahamas, Southeastern United States, Bermuda, Atlantic Canada, Ireland, United Kingdom | >$25 million | 2 | [117][71] | ||
| Jerry | September 17–24 | Category 2 hurricane | 105 (165) | 976 | Leeward Islands, Puerto Rico, Bermuda | None | None | |||
| Imelda | September 17–19 | Tropical storm | 45 (75) | 1003 | Texas, Louisiana, Oklahoma, Arkansas | $5 billion | 6 (1) | [78] | ||
| Karen | September 22–27 | Tropical storm | 45 (75) | 1003 | Windward Islands, Trinidad and Tobago, Venezuela, U.S. Virgin Islands, British Virgin Islands, Puerto Rico | $3.5 million | None | [118] | ||
| Lorenzo | September 23 – October 2 | Category 5 hurricane | 160 (260) | 925 | West Africa, Cape Verde, Azores, Ireland, United Kingdom | $362 million | 20 | [88][119] | ||
| Melissa | October 11–14 | Tropical storm | 65 (100) | 994[nb 3] | Mid-Atlantic States, New England, Nova Scotia | Minimal | None | |||
| Fifteen | October 14–16 | Tropical depression | 35 (55) | 1006 | West Africa, Cape Verde | None | None | |||
| Nestor | October 18–19 | Tropical storm | 60 (95) | 996 | Central America, Mexico, Southeastern United States | $125 million | 0 (3) | [95] | ||
| Pablo | October 25–28 | Category 1 hurricane | 80 (130) | 977 | Azores | None | None | |||
| Olga | October 25 | Tropical storm | 45 (75) | 998 | United States Gulf Coast, Louisiana, Alabama, Mississippi | $400 million | 0 (2) | [102][120] | ||
| Rebekah | October 30 – November 1 | Subtropical storm | 50 (85) | 982 | Azores | None | None | |||
| Sebastien | November 19–24 | Tropical storm | 70 (110) | 991 | Leeward Islands, Azores, British Isles | Minimal | None | |||
| Season aggregates | ||||||||||
| 20 systems | May 20 – November 24 | 185 (295) | 910 | >$11.59 billion | 107 (14) | |||||
See also
- Weather of 2019
- Tropical cyclones in 2019
- 2019 Pacific hurricane season
- 2019 Pacific typhoon season
- 2019 North Indian Ocean cyclone season
- South-West Indian Ocean cyclone seasons: 2018–19, 2019–20
- Australian region cyclone seasons: 2018–19, 2019–20
- South Pacific cyclone seasons: 2018–19, 2019–20
- South Atlantic tropical cyclone
Notes
- ^ A major hurricane is a storm that ranks as Category 3 or higher on the Saffir–Simpson hurricane wind scale.[1]
- ^ All damage figures are in 2019 USD, unless otherwise noted
- ^ Melissa reached its peak intensity of 65 mph (100 km/h) and 994 mbar as a subtropical storm but later became fully tropical.
References
- ^ Saffir–Simpson Hurricane Wind Scale. National Hurricane Center (Report). Miami, Florida: National Oceanic and Atmospheric Administration. May 23, 2013. Archived from the original on January 11, 2014. Retrieved July 1, 2019.
- ^ Forbes, Alex (June 1, 2022). "No Atlantic storms develop before hurricane season for first time in seven years". Macon, Georgia: WMAZ-TV. Archived from the original on January 28, 2024. Retrieved August 12, 2022.
- ^ a b "Background Information: The North Atlantic Hurricane Season". Climate Prediction Center. National Oceanic and Atmospheric Administration. August 9, 2012. Archived from the original on May 3, 2013. Retrieved May 2, 2020.
- ^ a b "North Atlantic Ocean Historical Tropical Cyclone Statistics". Fort Collins, Colorado: Colorado State University. Archived from the original on June 4, 2023. Retrieved July 19, 2023.
- ^ a b Mark Saunders; Adam Lea (December 11, 2018). "Extended Range Forecast for Atlantic Hurricane Activity in 2019" (PDF). London, United Kingdom: Tropical Storm Risk. Archived (PDF) from the original on February 25, 2021. Retrieved May 2, 2020.
- ^ a b Philip J. Klotzbach; Michael M. Bell; Jhordanne Jones (April 4, 2019). "Extended Range Forecast of Atlantic Seasonal Hurricane Activity and Landfall Strike Probability for 2019" (PDF). Fort Collins, Colorado: Colorado State University. Archived (PDF) from the original on July 15, 2021. Retrieved September 17, 2021.
- ^ a b Mark Saunders; Adam Lea (April 5, 2019). "April Forecast Update for North Atlantic Hurricane Activity in 2019" (PDF). London, United Kingdom: Tropical Storm Risk. Archived (PDF) from the original on April 11, 2019. Retrieved May 2, 2020.
- ^ a b Tracey Peake (April 16, 2019). "NC State Researchers Predict Normal 2019 Hurricane Season for East Coast". Raleigh, North Carolina: North Carolina State University. Archived from the original on May 2, 2020. Retrieved May 2, 2020.
- ^ a b Jonathan Erdman; Brian Donegan (May 6, 2019). "2019 Hurricane Season Expected to be Slightly Above Average But Less Active Than Last Year". The Weather Company. Archived from the original on May 7, 2019. Retrieved May 7, 2019.
- ^ a b "North Atlantic tropical storm seasonal forecast 2019". Met Office. May 21, 2019. Archived from the original on May 23, 2019. Retrieved May 23, 2019.
- ^ a b c d e Lauren Gaches (May 23, 2019). "NOAA predicts near-normal 2019 Atlantic hurricane season". National Oceanic and Atmospheric Administration. Archived from the original on May 23, 2019. Retrieved May 23, 2019.
- ^ a b Mark Saunders; Adam Lea (May 30, 2019). "Pre-Season Forecast for North Atlantic Hurricane Activity in 2019" (PDF). London, United Kingdom: Tropical Storm Risk. Archived (PDF) from the original on June 3, 2019. Retrieved June 3, 2019.
- ^ a b Philip J. Klotzbach; Michael M. Bell; Jhordanne Jones (June 4, 2019). "Extended Range Forecast of Atlantic Seasonal Hurricane Activity and Landfall Strike Probability for 2019" (PDF). Fort Collins, Colorado: Colorado State University. Retrieved September 17, 2021.
- ^ a b Kyle Davis; Xubin Zeng (June 11, 2019). "University of Arizona (UA) Forecasts an Above-Average Hurricane Season" (PDF). University of Arizona. Archived from the original (PDF) on June 16, 2019. Retrieved May 3, 2020.
- ^ a b Mark Saunders; Adam Lea (July 4, 2019). "July Forecast Update for North Atlantic Hurricane Activity in 2019" (PDF). London, United Kingdom: Tropical Storm Risk. Archived (PDF) from the original on September 11, 2020. Retrieved May 2, 2020.
- ^ a b Philip J. Klotzbach; Michael M. Bell; Jhordanne Jones (July 9, 2019). "Forecast of Atlantic Seasonal Hurricane Activity and Landfall Strike Probability for 2019" (PDF). Fort Collins, Colorado: Colorado State University. Archived (PDF) from the original on July 15, 2021. Retrieved September 17, 2021.
- ^ a b Philip J. Klotzbach; Michael M. Bell; Jhordanne Jones (August 5, 2019). "Forecast of Atlantic Seasonal Hurricane Activity and Landfall Strike Probability for 2019" (PDF). Fort Collins, Colorado: Colorado State University. Archived (PDF) from the original on July 17, 2021. Retrieved September 17, 2021.
- ^ a b Mark Saunders; Adam Lea (August 6, 2019). "August Forecast Update for North Atlantic Hurricane Activity in 2019" (PDF). London, United Kingdom: Tropical Storm Risk. Archived (PDF) from the original on October 29, 2019. Retrieved May 2, 2020.
- ^ a b "NOAA to issue updated 2019 Atlantic hurricane season outlook". WEAR-TV. August 8, 2019. Archived from the original on June 20, 2020. Retrieved May 2, 2020.
- ^ "Atlantic basin Comparison of Original and Revised HURDAT". Hurricane Research Division; Atlantic Oceanographic and Meteorological Laboratory. National Oceanic and Atmospheric Administration. March 2011. Archived from the original on March 29, 2014. Retrieved May 4, 2020.
- ^ a b c d e f g Hurricane Specialist Unit (December 1, 2019). Monthly Tropical Weather Summary 800 AM EST Mon Dec 1 2019 (Report). Miami, Florida: National Hurricane Center. Archived from the original on June 10, 2020. Retrieved May 3, 2020.
- ^ Dennis Mersereau (November 27, 2018). "The Active 2019 Atlantic Hurricane Season Broke Five Big Records". Forbes. Archived from the original on June 3, 2020. Retrieved May 4, 2020.
- ^ Doyle Rice (November 27, 2019). "Ferocious hurricane season that saw 18 named storms comes to an end". USA Today. Archived from the original on May 11, 2021. Retrieved May 10, 2021.
- ^ * John P. Cangialosi; Andrew B. Hagen; Robbie Berg (November 18, 2019). Tropical Cyclone Report: Hurricane Barry (PDF) (Report). Miami, Florida: National Hurricane Center. Archived (PDF) from the original on November 22, 2019. Retrieved February 27, 2020.
- Char Adams (July 15, 2019). "Good Samaritans Form Human Chain to Rescue Swimmers from Rip Current in Florida". People. Archived from the original on July 16, 2019. Retrieved July 18, 2019.
- Lixion A. Avila; Stacy R. Stewart; Robbie Berg; Andrew B. Hagen (April 20, 2020). Tropical Cyclone Report: Hurricane Dorian (PDF) (Report). Miami, Florida: National Hurricane Center. Archived (PDF) from the original on March 19, 2021. Retrieved April 27, 2020.
- Nelson Oliveira (August 28, 2019). "Man, 80, dies while preparing for Hurricane Dorian in Puerto Rico". New York Daily News. Archived from the original on September 5, 2019. Retrieved April 28, 2020.
- Kevin Connolly (September 5, 2019). "6 Florida Deaths Linked to Hurricane Dorian". News 13. Archived from the original on September 7, 2019. Retrieved April 30, 2020.
- Hayley Fowler (September 9, 2019). "Number of hurricane-related deaths in NC rises to 3, governor says". The Charlotte Observer. Archived from the original on March 13, 2020. Retrieved May 1, 2020.
- "Hurricane Dorian Caused Over $100 Million in Insured Damage". Newswire. October 4, 2019. Archived from the original on September 11, 2020. Retrieved May 1, 2020.
- Richard J. Pasch (January 14, 2020). Tropical Cyclone Report: Tropical Storm Fernand (PDF) (Report). Miami, Florida: National Hurricane Center. Archived (PDF) from the original on March 21, 2021. Retrieved February 27, 2020.
- "Minuto a minuto: Fernand azota Monterrey con lluvias torrenciales y deja un muerto". Infobae (in Spanish). September 4, 2019. Archived from the original on November 12, 2020. Retrieved September 7, 2019.
- "Fernand deja daños por 4 mil 200 mdp". Pulso Político (in Spanish). September 11, 2019. Archived from the original on September 12, 2019. Retrieved September 12, 2019.
- Stacy R. Stewart (February 19, 2020). Tropical Cyclone Report: Hurricane Humberto (PDF) (Report). Miami, Florida: National Hurricane Center. Archived (PDF) from the original on April 20, 2021. Retrieved February 25, 2020.
- "62-year-old man drowns after getting caught in rip current at Topsail Beach". WTVD-TV. Associated Press. September 19, 2019. Archived from the original on September 21, 2019. Retrieved September 19, 2019.
- Andrew S. Latto; Robbie J. Berg (February 7, 2020). Tropical Cyclone Report: Tropical Storm Imelda (PDF) (Report). Miami, Florida: National Hurricane Center. Archived (PDF) from the original on March 21, 2021. Retrieved February 28, 2020.
- David A. Zelinsky (December 16, 2019). Tropical Cyclone Report: Hurricane Lorenzo (PDF) (Report). Miami, Florida: National Hurricane Center. Archived (PDF) from the original on April 30, 2021. Retrieved May 1, 2020.
- Andrew B. Hagen; Eric Blake; Robbie Berg (February 28, 2020). Tropical Cyclone Report: Tropical Storm Nestor (PDF) (Report). Miami, Florida: National Hurricane Center. Archived (PDF) from the original on March 21, 2021. Retrieved May 1, 2020.
- Richard J. Pasch; Robert J. Berg; Andrew B. Hagen (March 19, 2020). Tropical Cyclone Report: Tropical Storm Olga (PDF) (Report). Miami, Florida: National Hurricane Center. Archived (PDF) from the original on March 21, 2021. Retrieved May 2, 2020.
- Bianca Moorman (October 27, 2019). "MDOT maintenance superintendent killed by falling tree in Newton County". The Meridian Star. Archived from the original on March 22, 2020. Retrieved May 2, 2020.
- ^ Philip Klotzbach [@philklotzbach] (May 20, 2019). "The Atlantic has now had named storms form prior to 1 June in five consecutive years: 2015–2019. This breaks the old record of named storm formations prior to 1 June in four consecutive years set in 1951–1954" (Tweet). Retrieved May 20, 2019 – via Twitter.
- ^ a b Robert J. Berg (October 25, 2019). Tropical Cyclone Report: Tropical Storm Chantal (PDF) (Report). Miami, Florida: National Hurricane Center. Archived (PDF) from the original on March 26, 2021. Retrieved November 4, 2019.
- ^ a b c d e f g h i j Lixion A. Avila; Stacy R. Stewart; Robbie Berg; Andrew B. Hagen (April 20, 2020). Tropical Cyclone Report: Hurricane Dorian (PDF) (Report). Miami, Florida: National Hurricane Center. Archived (PDF) from the original on March 19, 2021. Retrieved April 27, 2020.
- ^ "Hurricane Dorian Becomes the 5th Atlantic Category 5 in 4 Years". The Weather Company. September 1, 2019. Archived from the original on September 1, 2019. Retrieved May 3, 2020.
- ^ Matthew Cappucci; Jason Samenow (September 29, 2019). "Hurricane Lorenzo hit Category 5 strength the farthest northeast on record in the Atlantic". The Washington Post. Archived from the original on June 2, 2020. Retrieved May 4, 2020.
- ^ a b Philip Klotzbach [@philklotzbach] (October 27, 2019). "#Pablo is now a #hurricane. It became a hurricane at 18.3°W - the farthest east an Atlantic named storm has first become a hurricane on record - breaking the old record set by Vince in 2005 (18.9°W)" (Tweet). Retrieved March 21, 2020 – via Twitter.
- ^ Hurricanes and Tropical Storms - Annual 2019 (Report). National Climatic Data Center. January 2020. Archived from the original on April 29, 2021. Retrieved May 4, 2020.
- ^ Andrew S. Latto (August 6, 2019). Tropical Cyclone Report: Subtropical Storm Andrea (PDF) (Report). Miami, Florida: National Hurricane Center. Archived (PDF) from the original on March 20, 2021. Retrieved September 21, 2019.
- ^ a b c d John P. Cangialosi; Andrew B. Hagen; Robbie Berg (November 18, 2019). Tropical Cyclone Report: Hurricane Barry (PDF) (Report). Miami, Florida: National Hurricane Center. Archived (PDF) from the original on November 22, 2019. Retrieved February 27, 2020.
- ^ a b Char Adams (July 15, 2019). "Good Samaritans Form Human Chain to Rescue Swimmers from Rip Current in Florida". People. Archived from the original on July 16, 2019. Retrieved July 18, 2019.
- ^ a b Fry, Ethan (July 17, 2019). "Man dies after wires, tree fall on vehicle on Fairfield-Bridgeport line". Connecticut Post. Archived from the original on September 17, 2021. Retrieved September 17, 2021.
- ^ Event Details: Heavy Rain (Report). National Centers for Environmental Information. 2019. Archived from the original on September 12, 2020. Retrieved February 27, 2020.
- ^ David A. Zelinsky (August 19, 2019). Tropical Cyclone Report: Tropical Depression Three (PDF) (Report). Miami, Florida: National Hurricane Center. Archived (PDF) from the original on March 26, 2021. Retrieved August 22, 2019.
- ^ Florida Event Report: Lightning (Report). National Centers for Environmental Information. 2019. Archived from the original on September 11, 2020. Retrieved April 2, 2020.
{{cite report}}: Unknown parameter|agency=ignored (help) - ^ Cyrille Duchesne (August 28, 2019). "Tempête tropicale Dorian: Porto Rico touché ce soir". La Chaîne Météo (in French). Archived from the original on September 3, 2019. Retrieved April 28, 2020.
- ^ Sandy Deane (August 27, 2019). "Barbados escapes major impact from TS Dorian". Barbados Today. Archived from the original on September 3, 2019. Retrieved April 28, 2020.
- ^ a b "Hurricane Dorian does little damage to U.S. Virgin Islands". CBC. Associated Press. August 28, 2019. Archived from the original on September 1, 2019. Retrieved April 28, 2020.
- ^ Chaffin Mitchell; Mark Puleo (August 29, 2019). "While Puerto Rico avoids direct hit, Virgin Islands take significant blow from Dorian". AccuWeather. Archived from the original on September 3, 2019. Retrieved April 28, 2020.
- ^ "BVI under curfew till 6am Thursday, centre of Dorian now passed". BVI News. August 28, 2019. Archived from the original on August 29, 2019. Retrieved April 28, 2020.
- ^ a b Nelson Oliveira (August 28, 2019). "Man, 80, dies while preparing for Hurricane Dorian in Puerto Rico". New York Daily News. Archived from the original on September 5, 2019. Retrieved April 28, 2020.
- ^ Hurricane Dorian: WFP Support to the NEMA/CDEMA-led humanitarian response in the Bahamas Situation Report #02, 06 September 2019. World Food Programme (Report). September 6, 2019. ReliefWeb. Archived from the original on September 14, 2019. Retrieved May 1, 2020.
- ^ Kirk Semple (September 8, 2019). "Corpses Strewn, People Missing a Week After Dorian Hit the Bahamas". The New York Times. Archived from the original on September 9, 2019. Retrieved May 1, 2020.
- ^ "Bahamas reports 'total devastation' in wake of Hurricane Dorian". Al Jazeera. September 4, 2019. Archived from the original on September 8, 2019. Retrieved April 28, 2020.
- ^ IOM to provide temporary roofing solutions for houses affected by Hurricane Dorian in the Bahamas. International Organization for Migration (Report). ReliefWeb. September 6, 2019. Archived from the original on September 9, 2019. Retrieved April 28, 2020.
- ^ "FPL says all Dorian power outages resolved". WPEC. September 5, 2019. Archived from the original on July 2, 2020. Retrieved April 30, 2020.
- ^ Event Details: Tropical Storm. National Weather Service Jacksonville, Florida (Report). National Climatic Data Center. 2019. Archived from the original on July 16, 2020. Retrieved April 30, 2020.
- ^ a b Kevin Connolly (September 5, 2019). "6 Florida Deaths Linked to Hurricane Dorian". News 13. Archived from the original on September 7, 2019. Retrieved April 30, 2020.
- ^ Jenna Schiferl (September 6, 2019). "Thousands left without power in Charleston County in Hurricane Dorian's wake". The Post and Courier. Archived from the original on July 2, 2020. Retrieved April 30, 2020.
- ^ "Storm Events Database (South Carolina)". 2019. Archived from the original on July 15, 2020. Retrieved April 30, 2020.
- ^ Tim Armstrong (January 25, 2020). Hurricane Dorian: September 5-6, 2019 (Report). National Weather Service Newport, North Carolina. Archived from the original on April 14, 2020. Retrieved May 1, 2020.
- ^ "Storm Events Database (North Carolina)". 2019. Archived from the original on July 14, 2020. Retrieved May 1, 2020.
- ^ Kari Pugh (September 11, 2019). "Hurricane Dorian left nearly $15 million in damages from Duck to Hatteras Island". The Island Free Press. Archived from the original on July 3, 2020. Retrieved May 1, 2020.
- ^ Celeste Gracia (September 16, 2019). "Hurricane Dorian Hits NC Tobacco Farmers". WUNC. Archived from the original on July 15, 2020. Retrieved May 1, 2020.
- ^ a b Hayley Fowler (September 9, 2019). "Number of hurricane-related deaths in NC rises to 3, governor says". The Charlotte Observer. Archived from the original on March 13, 2020. Retrieved May 1, 2020.
- ^ Alexander Quon (September 8, 2019). "New Brunswick picks up the pieces after Hurricane Dorian". Global News. Archived from the original on September 11, 2019. Retrieved May 1, 2020.
- ^ a b "Hurricane Dorian Caused Over $100 Million in Insured Damage". Newswire. October 4, 2019. Archived from the original on September 11, 2020. Retrieved May 1, 2020.
- ^ Eric S. Blake (November 15, 2019). Tropical Cyclone Report: Tropical Storm Erin (PDF) (Report). Miami, Florida: National Hurricane Center. Archived (PDF) from the original on March 26, 2021. Retrieved November 24, 2019.
- ^ "Post-tropical storm Erin drenches parts of Nova Scotia, washes out road". CBC News. August 30, 2019. Archived from the original on August 30, 2019. Retrieved August 30, 2019..
- ^ "La tempête Erin a laissé jusqu'à 160 mm de pluie par endroits". Acadie Nouvelle (in French). Canadian Press. August 30, 2019. Archived from the original on August 30, 2019. Retrieved August 30, 2019.
- ^ Meteorological Service of Canada (2019). "Daily Data Report for August 2019: Summerside, PE". Environment Canada. Archived from the original on September 13, 2020. Retrieved August 30, 2019.
- ^ Meteorological Service of Canada (2019). "Daily Data Report for August 2019: Chevery, Qc". Environment Canada. Archived from the original on September 13, 2020. Retrieved August 30, 2019..
- ^ Richard J. Pasch (January 14, 2020). Tropical Cyclone Report: Tropical Storm Fernand (PDF) (Report). Miami, Florida: National Hurricane Center. Archived (PDF) from the original on March 21, 2021. Retrieved February 27, 2020.
- ^ a b "Minuto a minuto: Fernand azota Monterrey con lluvias torrenciales y deja un muerto". Infobae (in Spanish). September 4, 2019. Archived from the original on November 12, 2020. Retrieved September 7, 2019.
- ^ a b "Fernand deja daños por 4 mil 200 mdp". Pulso Político (in Spanish). September 11, 2019. Archived from the original on September 12, 2019. Retrieved September 12, 2019.
- ^ a b Kevin Recio (November 15, 2019). "Daños por 'Fernand' cierran en 221.9 mdp". ABC Noticias. Archived from the original on June 8, 2020. Retrieved November 16, 2019.
- ^ John L. Beven II (January 3, 2020). Tropical Cyclone Report: Tropical Storm Gabrielle (PDF) (Report). Miami, Florida: National Hurricane Center. Archived (PDF) from the original on March 25, 2021. Retrieved February 28, 2020.
- ^ a b c d e Stacy R. Stewart (February 19, 2020). Tropical Cyclone Report: Hurricane Humberto (PDF) (Report). Miami, Florida: National Hurricane Center. Archived (PDF) from the original on April 20, 2021. Retrieved February 25, 2020.
- ^ "Storm Events Database: Coastal Flood". National Oceanic and Atmospheric Administration. National Centers for Environmental Information. Archived from the original on September 17, 2021. Retrieved February 6, 2020.
- ^ Paul Johnston (October 7, 2019). "Repairs slowed by slate shortage". The Royal Gazette. Archived from the original on October 8, 2019. Retrieved March 1, 2020.
- ^ "Bermudian Engineers Introduce "Slate 2.0"". Bernews. November 26, 2019. Archived from the original on April 20, 2020. Retrieved March 2, 2020.
- ^ James Dodgson (February 21, 2020). "Country Report from Bermuda for the 42nd Session of the WMO Regional Association IV Hurricane Committee" (PDF). Bermuda Weather Service. Archived (PDF) from the original on September 18, 2021. Retrieved February 28, 2020.
- ^ "Minister: Working To Find Ways To Import Bananas". Bernews. February 28, 2020. Archived from the original on April 7, 2020. Retrieved March 2, 2020.
- ^ Daniel P. Brown (December 11, 2019). Tropical Cyclone Report: Hurricane Jerry (PDF) (Report). Miami, Florida: National Hurricane Center. Archived (PDF) from the original on March 26, 2021. Retrieved December 28, 2019.
- ^ a b c Andrew S. Latto; Robbie J. Berg (February 7, 2020). Tropical Cyclone Report: Tropical Storm Imelda (PDF) (Report). Miami, Florida: National Hurricane Center. Archived (PDF) from the original on March 21, 2021. Retrieved February 28, 2020.
- ^ a b c John P. Cangialosi; Nelsie A. Ramos (December 16, 2019). Tropical Cyclone Report: Tropical Storm Karen (PDF) (Report). Miami, Florida: National Hurricane Center. Archived (PDF) from the original on March 21, 2021. Retrieved February 29, 2020.
- ^ Camille Moreno (September 22, 2019). "TT under warning for Tropical Storm Karen". Newsday. Archived from the original on October 26, 2020. Retrieved February 29, 2020.
- ^ Julie Celestial (September 23, 2019). "Severe flooding hits Trinidad and Tobago, Karen heading toward Puerto Rico and Virgin Islands". The Watchers. Archived from the original on December 7, 2019. Retrieved February 29, 2020.
- ^ Ron Brackett (September 22, 2019). "Tropical Storm Karen Floods Streets, Traps People in Homes in Tobago". The Weather Channel. Archived from the original on December 23, 2020. Retrieved February 29, 2020.
- ^ Carolyn Kissoon (September 22, 2019). "No school on Monday". Trinidad Express. Archived from the original on June 20, 2020. Retrieved February 29, 2020.
- ^ "Tormenta Tropical Karen provocó inundaciones en Caracas y La Guaira". Descifrado (in Spanish). September 22, 2019. Archived from the original on October 20, 2020. Retrieved February 29, 2020.
- ^ a b Ron Brackett; Jan Wesner Childs (September 25, 2019). "Tropical Storm Karen Causes Landslides, Power Outages in Puerto Rico, U.S. Virgin Islands". The Weather Channel. Archived from the original on October 5, 2019. Retrieved February 29, 2020.
- ^ Travis Fedschun (September 24, 2019). "Tropical systems menace Puerto Rico, Bermuda as Lorenzo forecast to become 'large and powerful' hurricane". Fox News. Archived from the original on January 7, 2020. Retrieved February 29, 2020.
- ^ "Tropical Storm Karen dumps heavy rain over Puerto Rico as storm moves slowly north". CBS News. Associated Press. September 25, 2019. Archived from the original on January 12, 2020. Retrieved February 29, 2020.
- ^ a b c d David A. Zelinsky (December 16, 2019). Tropical Cyclone Report: Hurricane Lorenzo (PDF) (Report). Miami, Florida: National Hurricane Center. Archived (PDF) from the original on April 30, 2021. Retrieved May 1, 2020.
- ^ a b Robbie J. Berg (December 31, 2019). Tropical Cyclone Report: Tropical Storm Melissa (PDF) (Report). Miami, Florida: National Hurricane Center. Archived (PDF) from the original on March 26, 2021. Retrieved February 29, 2020.
- ^ "Crisfield, Salisbury Officials Close Off Some Streets Due to Tidal Flooding". WBOC-TV. Salisbury, Maryland. October 11, 2019. Archived from the original on October 11, 2019. Retrieved October 11, 2019.
- ^ Mallory Metzner (October 11, 2019). "Nor'easter Causes Bethany Beach Erosion". WBOC-TV. Salisbury, Maryland. Archived from the original on October 11, 2019. Retrieved October 11, 2019.
- ^ Spencer Tracy (October 11, 2019). "Coastal Flooding Impacts Dewey Beach". WBOC-TV. Salisbury, Maryland. Archived from the original on October 11, 2019. Retrieved October 11, 2019.
- ^ Katherine Scott (October 11, 2019). "Storm off the coast causes flooding at Jersey Shore". WPVI-TV. Philadelphia, Pennsylvania. Archived from the original on October 11, 2019. Retrieved October 11, 2019.
- ^ Lixion A. Avila (November 1, 2019). Tropical Cyclone Report: Tropical Depression Fifteen (PDF) (Report). Miami, Florida: National Hurricane Center. Archived (PDF) from the original on March 26, 2021. Retrieved November 3, 2019.
- ^ a b c d Andrew B. Hagen; Eric Blake; Robbie Berg (February 28, 2020). Tropical Cyclone Report: Tropical Storm Nestor (PDF) (Report). Miami, Florida: National Hurricane Center. Archived (PDF) from the original on March 21, 2021. Retrieved May 1, 2020.
- ^ "Storm Events Database". National Climatic Data Center. 2019. Archived from the original on September 11, 2020. Retrieved May 1, 2020.
- ^ Event Details: Tornado. National Weather Service Tampa Bay, Florida (Report). National Climatic Data Center. 2019. Archived from the original on September 12, 2020. Retrieved May 1, 2020.
- ^ Event Details: Tornado. National Weather Service Tampa Bay, Florida (Report). National Climatic Data Center. 2019. Archived from the original on September 11, 2020. Retrieved May 1, 2020.
- ^ Event Details: Tornado. National Weather Service Tampa Bay, Florida (Report). National Climatic Data Center. 2019. Archived from the original on September 11, 2020. Retrieved May 1, 2020.
- ^ Event Details: Tornado. National Weather Service Melbourne, Florida (Report). National Climatic Data Center. 2019. Archived from the original on September 11, 2020. Retrieved May 1, 2020.
- ^ a b John L. Beven II (January 27, 2020). Tropical Cyclone Report: Hurricane Pablo (PDF) (Report). Miami, Florida: National Hurricane Center. Archived (PDF) from the original on February 18, 2020. Retrieved March 21, 2020.
- ^ a b c d e Richard J. Pasch; Robert J. Berg; Andrew B. Hagen (March 19, 2020). Tropical Cyclone Report: Tropical Storm Olga (PDF) (Report). Miami, Florida: National Hurricane Center. Archived (PDF) from the original on March 21, 2021. Retrieved May 2, 2020.
- ^ "'Worst-case scenario' Olga catches many in Louisiana off guard". KMBT. October 26, 2019. Archived from the original on March 21, 2020. Retrieved May 2, 2020.
- ^ "President Trump approves Mississippi disaster declaration". WLOX. WDAM-TV. December 9, 2019. Archived from the original on March 22, 2020. Retrieved May 2, 2020.
- ^ Bianca Moorman (October 27, 2019). "MDOT maintenance superintendent killed by falling tree in Newton County". The Meridian Star. Archived from the original on March 22, 2020. Retrieved May 2, 2020.
- ^ Adrian Mojica (December 3, 2019). "Tennessee lawmakers send letter to President Trump supporting disaster assistance". WZTV. Archived from the original on March 22, 2020. Retrieved May 2, 2020.
- ^ a b Tennessee Event Report: Thunderstorm Wind (Report). National Climatic Data Center. 2019. Archived from the original on September 11, 2020. Retrieved May 2, 2020.
{{cite report}}: Unknown parameter|agency=ignored (help) - ^ Stacy R. Stewart (December 9, 2019). Tropical Cyclone Report: Subtropical Storm Rebekah (PDF) (Report). Miami, Florida: National Hurricane Center. Archived (PDF) from the original on January 11, 2020. Retrieved January 11, 2020.
- ^ Daniel P. Brown (February 3, 2020). Tropical Cyclone Report: Tropical Storm Sebastien (PDF) (Report). Miami, Florida: National Hurricane Center. Archived (PDF) from the original on March 26, 2021. Retrieved March 7, 2020.
- ^ "U.S. forecasters reveal outlook for 2019 Atlantic hurricane season". CBS. AP. May 23, 2019. Archived from the original on September 25, 2023. Retrieved January 22, 2024.
- ^ "WMO retires Ingrid and Manuel for Atlantic and eastern North Pacific basins". Washington, D.C.: National Oceanic and Atmospheric Administration. Archived from the original on January 20, 2018. Retrieved January 22, 2024.
- ^ "WMO Hurricane Committee retires tropical cyclone names and ends the use of Greek alphabet". World Meteorological Organization. March 17, 2021. Archived from the original on December 18, 2023. Retrieved March 17, 2021.
- ^ Masters, Jeff (March 19, 2021). "WMO: Atlantic hurricanes no longer to receive names from Greek alphabet". New Haven, Connecticut: Yale Climate Connections. Archived from the original on March 19, 2021. Retrieved March 19, 2021.
- ^ Erdman, Jonathan (March 19, 2021). "These 2019 and 2020 Atlantic Hurricane Names Were Not Retired, But Were Strong Candidates". The Weather Channel. Archived from the original on March 20, 2021. Retrieved January 22, 2024.
- ^ Donegan, Brian; Dolce, Chris (March 30, 2020). "Why 2019's Hurricane Dorian Wasn't Retired by the World Meteorological Organization". The Weather Channel. Archived from the original on April 2, 2020. Retrieved March 31, 2020.
- ^ Olesky, Lauren (April 16, 2020). "Dorian not retired as a storm name". West Palm Beach, Florida: WPEC. Archived from the original on January 23, 2024. Retrieved January 22, 2024.
- ^ "62-year-old man drowns after getting caught in rip current at Topsail Beach". WTVD-TV. Associated Press. September 19, 2019. Archived from the original on September 21, 2019. Retrieved September 19, 2019.
- ^ Stephon Nicolas (October 22, 2019). "Karen leaves $24m damage". newsday.co.tt. Trinidad and Tobago Newsday. Archived from the original on November 25, 2020. Retrieved December 25, 2020.
- ^ "Man dies after being struck by tree amid Storm Lorenzo". October 3, 2019. Archived from the original on May 16, 2021. Retrieved September 17, 2021.
- ^ Bianca Moorman (October 27, 2019). "MDOT maintenance superintendent killed by falling tree in Newton County". The Meridian Star. Archived from the original on March 22, 2020. Retrieved March 23, 2020.
External links
Tropical cyclones of the 2019 Atlantic hurricane season | ||
|---|---|---|
 | ||