
| |||||||||||||||||||||||||||||||||||||||||||||||||||||||||||||||||||||||
All 18 seats in Northern Ireland to the House of Commons | |||||||||||||||||||||||||||||||||||||||||||||||||||||||||||||||||||||||
|---|---|---|---|---|---|---|---|---|---|---|---|---|---|---|---|---|---|---|---|---|---|---|---|---|---|---|---|---|---|---|---|---|---|---|---|---|---|---|---|---|---|---|---|---|---|---|---|---|---|---|---|---|---|---|---|---|---|---|---|---|---|---|---|---|---|---|---|---|---|---|---|
| Turnout | 58.5% ( | ||||||||||||||||||||||||||||||||||||||||||||||||||||||||||||||||||||||
| |||||||||||||||||||||||||||||||||||||||||||||||||||||||||||||||||||||||
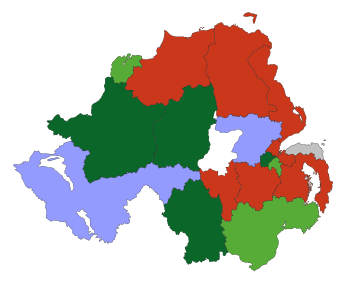 Colours on map indicate winning party for each constituency. | |||||||||||||||||||||||||||||||||||||||||||||||||||||||||||||||||||||||


The 2015 United Kingdom general election in Northern Ireland was held on 7 May 2015 and all 18 seats were contested. 1,236,765 people were eligible to vote, up 67,581 from the 2010 general election. 58.45% of eligible voters turned out, an increase of half a percentage point from the last general election. This election saw the return of Ulster Unionists to the House of Commons, after they targeted 4 seats but secured 2.[1]
YouTube Encyclopedic
-
1/5Views:6 702 58229 0981 410120 5761 702
-
Why the UK Election Results are the Worst in History.
-
The General Election of 2015 - Professor Vernon Bogdanor
-
Northern Ireland General Election (1969)
-
The 2015 UK Election Explained
-
Understanding the 2017 UK General Election
Transcription
Hello Internet The UK had an election we need to talk about because after the debates finished, the people voted and the ballots tallied the results were this: But parliament ended up looking like this: Which isn't, exactly, representative. And by not exactly, I mean at all. Red earned 30% of the vote and 36% of the seats, which is sort of close, but the rest is madness: Orange earned 8% of the vote but got one eighth of that while Yellow's 5% just about doubled, and purple earned 13% and got squat. Meanwhile blue's 37% of the people booted to 51% of the seats in parliament. The blue boost is even bigger when you consider that 51% of the seats gives basically 100% the control. How'd this happen? In the UK -- national elections aren't really national, they're a bunch of local elections. The UK is divided into constituencies, each of which elects one member of parliament (M.P.) to represent them. This local / national divide is where the trouble begins. Imagine a parliament with just three constituencies, and it's easy to see how it wouldn't always align with citizens. Some people think this sort of result is fine -- “it's all *about* winning local elections,” they’ll say. “Each M.P. represents their constituency.” And while the imbalance in this example is dumb, but it's the same problem in the real election and this same argument is given, but there are two more problems with it in reality land. 1) Few citizens have any idea who their MP is, they just know what party they voted for -- what party they want to represent their views on the national level. And pretending like it's a local election is a bit disingenuous. -- in practice it's an election for now the nation will run -- not really for who is going to represent a tiny part of it. and even if it were 2) The individual constituencies are worse at representing their citizens than parliament. Indulge this spreadsheet-loving nerd for a moment, will you? The difference between what a party earned at the polls and what they got in parliament is the amount of misrepresentation error. If we calculate all the errors for all the parties and add them up we can say the Parliament as a whole has 47% percentage points of misrepresentation error. That sounds bad looks like a utopian rainbow of diversity compared to any local election because the local elections have *one* winner. Out of the 650 constituencies 647 have a higher representation error than parliament. These are the only three that don't and they're really unusual for having so many of a single kind of voter in one place. Most places look the The Wrekin which is dead in the middle a mere one-hundred and one points off. Note that the winning candidate didn't reach a majority here. Which means more than half of constituencies elected their MP with a minority of voters. The worst is Belfast South at the bottom of the list. Hilariously unrepresentative. Less than a quarter of the voters get to speak for the entire place in parliament. This is the the lowest percentage an M.P. has ever been elected by. So when people argue that the UK election is a bunch of local elections 1) people don't act like it, and 2) It's even more of an argument that the elections are broken because they're worse on this level. These local elections are unrepresentative because of the terrible 'First Past the Post' voting system -- which I have complained mightily about and won't repeat everything here -- go watch the video -- but TL;DR it only 'works' when citizens are limited to two choices. Voting for any party except the biggest makes it more likely the biggest will win by a minority -- which is exactly what happened. That citizens keep voting for smaller parties despite knowing the result is against their strategic interests demonstrates the citizenry wants diverse representation -- but that successes is the very thing that's made this the most unrepresentative parliament in the history of the UK. People happy with the results argue the system is working fine -- of course they do. Their team won. Government isn't a sport where a singular 'winner' must be determined. It's a system to make rules that everyone follows and so, we need a system where everyone can agree the process is fair even if the results don't go in their favor. If you support a system that disenfranchises people you don't like and turbo-franchises people you do -- then it doesn't look like you sport representative democracy, it looks like you support a kind of dictatorship light. Where a small group of people (including you) makes the rules for everyone. But as it is now, on election day the more people express what they want the worse the system looks which makes them disengaged at best or angry at worst and GEE I CAN'T IMAGINE WHY. This is fixable, there are many, many better ways the UK could vote -- here are two that even keep local representatives. And fixing voting really matters, because this is a kind of government illegitimacy score -- and it's been going up and may continue to do so unless this fundamentally broken voting system is changed.
Debate
A political debate was held between the leaders of the five main parties in Northern Ireland: the Democratic Unionist Party, Sinn Féin, the Ulster Unionist Party, Social Democratic and Labour Party and Alliance Party of Northern Ireland as part of BBC Newsnight on 16 April 2015.[2]
Constituencies and MPs
Northern Ireland returned eighteen members of parliament to House of Commons, one for each of its 18 parliamentary constituencies.
Results
In total, three seats changed hands in Northern Ireland – Belfast East, Fermanagh and South Tyrone and South Antrim.
Unionists
Prior to the election, the two main unionist parties – the Democratic Unionist Party (DUP) and the Ulster Unionist Party (UUP) – had agreed not to stand against each other in certain seats. The DUP stood aside in Fermanagh and South Tyrone, and in Newry and Armagh, while the UUP did not contest Belfast East and Belfast North.[3]
The DUP retained their position as the largest unionist party, and also overtook Sinn Féin to once again poll the largest number of votes in Northern Ireland (they had last achieved this in 2005, with Sinn Féin taking the top position in 2010). The DUP succeeded in re-taking one of the unionist pact seats – Belfast East – which party leader Peter Robinson had lost to the Alliance Party's Naomi Long in 2010. Gavin Robinson (no relation to Peter) won the seat with a majority of over 2,500 votes. Elsewhere, the DUP retained Belfast North where the UUP had also stood aside, as well as East Antrim, East Londonderry, Lagan Valley, North Antrim, Strangford and Upper Bann.
In a surprise result, the UUP gained South Antrim from the DUP, where Danny Kinahan defeated veteran MP William McCrea by 949 votes. They also gained Fermanagh and South Tyrone from Sinn Féin, as former leader Tom Elliott took the seat from Michelle Gildernew by 530 votes. The seat had been the site of a unionist pact in 2010, when the DUP and UUP both supported an independent candidate, who went on to be defeated by Gildernew by just four votes. The two seats for the UUP marked their best election since 2001, and they also managed to increase their vote share slightly to overtake the SDLP into third place in Northern Ireland.
No other unionist parties won seats, with Traditional Unionist Voice (TUV) seeing their vote fall by almost 10,000 (though with three fewer candidates). TUV did however retain second place in North Antrim, though they remained over 11,000 votes behind the DUP. They also saved their deposit in three other seats. The United Kingdom Independence Party contested their first general election in Northern Ireland. They polled 18,000 votes in ten constituencies, saving their deposit in four. Their best performance came in East Antrim where they won nearly 11% of the vote. The Northern Ireland Conservatives were contesting a general election as a separate party for the first time since 2005 (they had previously entered into an electoral alliance with the UUP). The party stood in 16 constituencies (not in Belfast North and Fermanagh and South Tyrone), polling just over 9,000 votes in total. They kept their deposit in one seat – Strangford.
Nationalists
Sinn Féin were the second largest Northern Ireland party, and the largest nationalist party in terms of both votes and seats, despite their loss of Fermanagh and South Tyrone and a small drop in vote share. They easily retained Belfast West, Mid Ulster and West Tyrone – the first of these being the safest seat in Northern Ireland with a 35% majority. In Newry and Armagh, new candidate Mickey Brady saw off the UUP's Danny Kennedy despite the unionist unity pact in the constituency. Brady secured a majority of over 4,000 votes, though this was about half the Sinn Féin majority in 2010.
The SDLP came fourth in terms of vote, but third in terms of seats. They saw the largest change in vote share for any of the four largest parties – a decrease of 2.6 percentage points. They retained both Foyle and South Down in the face of strong Sinn Féin challenges. In South Down, Margaret Ritchie was re-elected with a majority reduced from over 8,000 to just under 6,000, although her colleague Mark Durkan in Foyle saw a small swing to the SDLP. Party leader Alasdair McDonnell narrowly retained Belfast South with just 9,560 votes (a share of only 24.5% – the lowest of any winning candidate in the UK in 2015). The DUP came second with 22%, followed by the Alliance Party on 17% and Sinn Féin on 14%.
Independents and other parties
Independent MP Sylvia Hermon polled 17,689 votes to retain her North Down seat, though with a reduced majority of 9,202 (down from over 14,000 in 2010). Four other independent candidates stood, taking 1,508 votes between them.
The Alliance Party saw a growth in support, going from 6.4% to 8.6% of the vote. They retained their deposit in 10 of the 18 constituencies, and even managed to secure an increase in their vote of 5.6% in Belfast East, which they lost to the DUP. Apart from Belfast East, their best performances were in Belfast South where they took 17%, followed by East Antrim at 15%.
The Green Party stood five candidates – one more than in 2010. They polled 6,822 votes, a 1% share of the NI total. Belfast South provided their best result at 5.7%, while party leader Steven Agnew took 5.4% in North Down. The People Before Profit Alliance stood a single candidate, Gerry Carroll, in Belfast West. He had previously contested the by-election in 2011 where he came third with 8% of the vote. In 2015 he substantially improved on this result, coming second behind Sinn Féin with 6,798 votes, or 19%.
Two parties contested the 2015 election who had not stood in 2010 – the Workers' Party stood five candidates and polled 2,724 votes, and Cannabis Is Safer Than Alcohol had four candidates who polled a total of 1,853 votes. Neither of these parties retained any deposits.
Full results
| Political Party |
Candidates |
Number of votes |
Elected |
Seats gained |
Seats lost |
Net change in seats |
% of seats |
% of votes |
Change in % of vote | |
|---|---|---|---|---|---|---|---|---|---|---|
| DUP | 16 | 184,260 | 8 | 1 | 1 | 0 | 44.4 | 25.7 | +0.7 | |
| Sinn Féin | 18 | 176,232 | 4 | 0 | 1 | −1 | 22.2 | 24.5 | −1.0 | |
| Ulster Unionist | 15 | 114,935 | 2 | 2 | 0 | +2 | 11.1 | 16.0 | +0.8 | |
| SDLP | 18 | 99,809 | 3 | 0 | 0 | 0 | 16.7 | 13.9 | −2.6 | |
| Alliance | 18 | 61,556 | 0 | 0 | 1 | −1 | 0 | 8.6 | +2.2 | |
| Independent | 5 | 19,177 | 1 | 0 | 0 | 0 | 5.6 | 2.7 | −4.0 | |
| UKIP | 10 | 18,324 | 0 | 0 | 0 | 0 | 0 | 2.6 | New | |
| TUV | 7 | 16,538 | 0 | 0 | 0 | 0 | 0 | 2.3 | −1.6 | |
| NI Conservatives | 16 | 9,055 | 0 | 0 | 0 | 0 | 0 | 1.3 | New | |
| Green (NI) | 5 | 6,822 | 0 | 0 | 0 | 0 | 0 | 1.0 | +0.4 | |
| People Before Profit | 1 | 6,798 | 0 | 0 | 0 | 0 | 0 | 0.9 | +0.5 | |
| Workers' Party | 5 | 2,724 | 0 | 0 | 0 | 0 | 0 | 0.4 | New | |
| Cannabis Is Safer Than Alcohol | 4 | 1,853 | 0 | 0 | 0 | 0 | 0 | 0.3 | New | |
Note that in 2010, the Ulster Unionist Party and the Northern Ireland Conservatives formed an electoral alliance in which their candidates stood as "Ulster Conservatives and Unionists - New Force". The UUP vote in the table above is compared to the UCU-NF vote in 2010. The NI Conservatives who contested the 2015 election as a separate entity are treated in the table as a new party.
Votes summary
See also
- 2015 United Kingdom general election in England
- 2015 United Kingdom general election in Scotland
- 2015 United Kingdom general election in Wales
Notes
- ^ Peter Robinson sat as an MLA in the Northern Ireland Assembly for Belfast East. The party's leader in the Commons was Nigel Dodds, the MP for Belfast North
- ^ Gerry Adams sat as a TD in the Dáil Éireann for Louth.
- ^ Mike Nesbitt sat as an MLA in the Northern Ireland Assembly for Strangford.
- ^ As Ulster Conservatives and Unionists.
References
- ^ "UK Parliamentary Election 2015 - Turnout". EONI. 7 May 2015. Archived from the original on 6 August 2019. Retrieved 15 December 2019.
- ^ "Election 2015: NI political parties in first TV election debate". BBC News. 17 April 2015. Archived from the original on 17 April 2015. Retrieved 17 April 2015.
- ^ Ferguson, Amanda (13 November 2014). "SDLP rejects call for electoral pact with Sinn Fein". Belfast Telegraph. Archived from the original on 27 May 2015. Retrieved 27 May 2015.