
| 2015 Pacific hurricane season | |
|---|---|
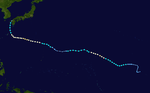
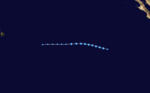
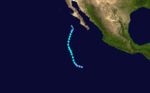
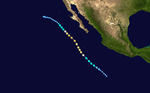
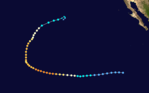
 Season summary map | |
| Seasonal boundaries | |
| First system formed | May 28, 2015 |
| Last system dissipated | December 31, 2015 (record latest) |
| Strongest storm | |
| Name | Patricia (Most intense hurricane in the Western Hemisphere) |
| • Maximum winds | 215 mph (345 km/h) (1-minute sustained) |
| • Lowest pressure | 872 mbar (hPa; 25.75 inHg) |
| Seasonal statistics | |
| Total depressions | 31 (record high) |
| Total storms | 26 |
| Hurricanes | 16 (record high, tied with 1990, 1992 and 2014) |
| Major hurricanes (Cat. 3+) | 11 (record high) |
| Total fatalities | 45 total |
| Total damage | $566 million (2015 USD) |
| Related articles | |
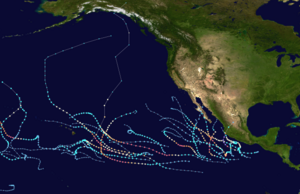
The 2015 Pacific hurricane season is the second-most active Pacific hurricane season on record, with 26 named storms, only behind the 1992 season. A record-tying 16 of those storms became hurricanes, and a record 11 storms further intensified into major hurricanes throughout the season.[nb 1] The Central Pacific, the portion of the Northeast Pacific Ocean between the International Date Line and the 140th meridian west, had its most active year on record, with 16 tropical cyclones forming in or entering the basin. Moreover, the season was the third-most active season in terms of accumulated cyclone energy, amassing a total of 290 units. The season officially started on May 15 in the Eastern Pacific and on June 1 in the Central Pacific; they both ended on November 30. These dates conventionally delimit the period of each year when most tropical cyclones form in the Northeast Pacific basin. However, the formation of tropical cyclones is possible at any time of the year. This was shown when a tropical depression formed on December 31. The above-average activity during the season was attributed in part to the very strong 2014–16 El Niño event.[nb 2]
The season featured several long-tracking and powerful storms, although land impacts were often minimal. In June, Hurricane Blanca, an early season Category 4 hurricane, killed four people due to rough seas. Hurricane Carlos caused minor damage while passing a short distance off the coast of Mexico. In July, the remnants of Hurricane Dolores brought record rainfall to Southern California, killing one and causing losses worth over $50 million.[nb 3] On August 29, three Category 4 hurricanes (Kilo, Ignacio, Jimena) were all active simultaneously in the Pacific east of the International Date Line for the first time in recorded history. In September, moisture from Hurricane Linda contributed to storms that killed 21 people in Utah. Later that month, Hurricane Marty inflicted $30 million in damage to the southwestern coast of Mexico. In October, Hurricane Patricia became the most intense hurricane ever recorded in the Western Hemisphere, with a central pressure of 872 mbar (hPa; 25.75 inHg) and 1-minute sustained winds of 215 mph (345 km/h). After also becoming the strongest landfalling Pacific hurricane on record at the time, Patricia claimed 13 lives and was responsible for $463 million in damage. The season's activity continued into November when Hurricane Sandra became the strongest Pacific hurricane ever recorded in that month. Damage across the basin reached $566 million, while 45 people were killed by the various storms.
YouTube Encyclopedic
-
1/2Views:6911 627
-
2015 Central Pacific Hurricane Season: Tracked Storm #05 - Tropical Storm Malia
-
2015-16 Individual South Pacific Cyclone season Satellite Animation
Transcription
Seasonal forecasts
| Record | Named storms |
Hurricanes | Major hurricanes |
Ref | |
|---|---|---|---|---|---|
| Average (1981–2010): | 15.4 | 8.4 | 3.9 | [3] | |
| Record high activity: | 1992: 27 | 2015: 16 | 2015: 11 | [4] | |
| Record low activity: | 2010: 8 | 2010: 3 | 2003: 0 | [4] | |
| Date | Source | Named storms |
Hurricanes | Major hurricanes |
Ref |
| April 10, 2015 | SMN | 19 | 11 | 4 | [5] |
| May 27, 2015 | CPC | 15–22 | 7–12 | 5–8 | [2] |
| Area | Named storms |
Hurricanes | Major hurricanes |
Ref | |
| Actual activity: | EPAC | 18 | 13 | 10 | |
| Actual activity: | CPAC | 8 | 3 | 1 | |
| Actual activity: | 26 | 16 | 11 | ||
On April 10, 2015, the Servicio Meteorológico Nacional (SMN) issued its first outlook for the Pacific hurricane season, forecasting 19 named storms, 11 hurricanes, and 4 major hurricanes. The organization listed a set of seasons with similar atmospheric and oceanic conditions, including 1982, 1986, 1991, 1994, 2002, and 2014.[5] On May 27, the National Oceanic and Atmospheric Administration's Climate Prediction Center (CPC) released its forecast for the year, highlighting a 70% chance of an above-average season with 15–22 named storms, 7–12 hurricanes, 5–8 major hurricanes, and an accumulated cyclone energy (ACE) index range of 110–190% of the median. While both organizations cited an intensifying El Niño as a cause of increased activity, the CPC also highlighted the difference in global sea surface temperature patterns in 2015 versus the 1995–2014 period.[5][2] The season ended up exceeding all of these forecasts with 26 named storms, 16 hurricanes, 11 major hurricanes, and an ACE index at more than 200% of the median.[4]
Seasonal summary

The accumulated cyclone energy (ACE) index for the 2015 Pacific hurricane season (Eastern Pacific and Central Pacific combined), as calculated by Colorado State University using data from the National Hurricane Center, was 290.2 units.[nb 4][6] ACE is a rough measure of the energy generated by a tropical or subtropical cyclone over its lifespan, and is calculated every six hours when the tropical cyclone has sustained wind speeds of at least of 39 mph (63 km/h). Therefore, more intense and longer-lived tropical cyclones will generate more ACE, while tropical depressions are excluded from ACE calculations.[7]

Overall, 31 tropical cyclones formed, of which 26 reached tropical storm intensity and were named. A total of 16 of these storms became hurricanes, and a record-breaking 11 became major hurricanes.[nb 1] These values make the 2015 season the second-most active on record.[4][8] The Central Pacific, meanwhile, had its most active year on record, with 16 systems systems (8 formed in the basin and 8 others entered into it),[9] surpassing the old record of 11 set in 1992 and 1994.[10] The season officially began on May 15 in the Eastern Pacific, and on June 1 in the Central Pacific; the season ended officially on November 30,[11] though a tropical depression formed well after that on December 31.[12] The well-above-average activity levels were largely attributed to the strong 2014–16 El Niño event, which brought anomalously high sea surface temperatures and low vertical wind shear to western parts of the basin.[10][13] In fact, for the region between the 116th meridian west and the International Date Line, sea surface temperatures from July to October averaged 28 °C (82 °F), the highest value on record since reliable data records began in 1979.[14] Around Hawaii, sea surface temperatures were 0.9 °C (1.6 °F) higher than at any point during the past 60 years.[15] Wind shear in the region was also at its lowest on record during that period.[14] The existence of a large region of rising air over the basin during much of the season, a feature typical of El Niño events, further facilitated the development and intensification of the season's numerous tropical cyclones.[13]
The season started off with three successive hurricanes, with Andres and Blanca both reaching Category 4 status.[16] On June 3, Blanca became both earliest second hurricane and second major hurricane in the basin since reliable records began in 1971, and became the earliest instance of a landfall on the Baja California Peninsula.[17] Ten days later, Carlos became the second-earliest third hurricane on record.[18] After about a month of inactivity, eight systems formed in July, including five between July 8 and July 12. Ela became the earliest named storm to form in the Central Pacific within the bounds of the official season, and one of the earliest in the calendar year.[19] When Halola and Iune formed soon thereafter, that marked the first month in the satellite era where three tropical cyclones were observed in the Central Pacific simultaneously.[20][21] Six more systems formed in an active August.[22][23] Early on August 30, Hurricanes Kilo, Ignacio and Jimena intensified into Category 4 hurricanes. This was the first time in the historical record that three or more major hurricanes existed simultaneously in the Pacific east of the International Date Line, and that two or more major hurricanes existed simultaneously in the Central Pacific.[15][24]

September saw the formation of five systems, excluding Kevin which was named in September but formed on August 31.[25][26] Three systems—Linda, Sixteen-E, and Marty—affected Mexico, with the first two also bringing floods to the Southwestern United States.[27][28][29] The flood event caused by Linda in Utah was also the state's deadliest.[27] October saw another five systems.[30][31] With the formation of Oho on October 3, the 2015 season surpassed 1992 and 1994 as the most active year on record in the Central Pacific.[32] During October 18–19, Olaf became the southernmost-forming hurricane and major hurricane in the Eastern Pacific.[33][34] Olaf later became the first system on record to cross from the Eastern Pacific into the Central Pacific and then back into the Eastern Pacific while still a tropical cyclone.[35] Patricia became the strongest hurricane in the basin on October 23 when its pressure fell to 892 mbar (hPa; 26.34 inHg), breaking the previous record of 902 mbar (hPa; 26.64 inHg) set by 1997's Hurricane Linda.[36] Patricia subsequently became the strongest tropical cyclone on record in the Western Hemisphere in terms of barometric pressure, with a central pressure of 872 mbar (hPa; 25.75 inHg). This value was also the second-lowest globally, behind Typhoon Tip of 1979 which had a central pressure of 870 mbar (hPa; 25.69 inHg). Additionally, its maximum sustained winds of 215 mph (345 km/h) were the strongest ever reliably recorded or estimated anywhere globally.[37] Patricia later became the strongest Pacific hurricane to strike Mexico after making landfall in Jalisco as a strong Category 4 hurricane.[37]
The following month tied for the most active November with the development of two systems, Rick and Sandra.[4][38] Sandra subsequently strengthened into a major hurricane, bringing the season total to a record 11.[4] Its peak winds of 150 mph (240 km/h) and minimum central pressure of 934 mbar (hPa; 27.58 inHg) surpassed Hurricane Kenneth of 2011 for the strongest November Pacific hurricane in terms of both sustained winds and central pressure.[39] Despite the official end of the season on November 30,[11] anomalously favorable conditions in the Central Pacific gave rise to the final storm of the season, Tropical Depression Nine-C, which formed on December 31 and dissipated late the same day.[12] This marked the latest end to a Pacific hurricane season on record.[4]
Systems
Hurricane Andres

On May 23, the National Hurricane Center (NHC) began monitoring the potential for tropical cyclogenesis well south of Mexico over the following days.[40] A broad low-pressure area formed three days later, steadily organizing to become Tropical Depression One-E at 06:00 UTC on May 28.[41] With an increase in spiral banding and an expanding central dense overcast, the depression was upgraded to Tropical Storm Andres six hours later.[42] Directed west-northwest and eventually northwest by a subtropical ridge over Mexico, the cyclone quickly organized and became a hurricane on May 29. A spurt of intensification saw Andres strengthen into a strong Category 2 hurricane late the next day. Andres's intensification trend leveled off thereafter due to an eyewall replacement cycle and a brief increase in vertical wind shear, but Andres still managed to reach major hurricane status early on May 31, becoming one of only five major hurricanes during the month of May.[41] Although forecasts did not indicate additional strengthening,[43] Andres began a period of rapid deepening the following day as wind shear decreased, intensifying into a Category 4 hurricane at 00:00 UTC on June 1. Andres reached its peak intensity six hours later with maximum sustained winds of 145 mph (235 km/h) and a minimum pressure of 937 mbar (hPa; 27.67 inHg).[41] Thereafter, the system moved west-northwestwards over cooler waters and into a more stable environment, which led to a swift weakening trend. Andres fell below hurricane strength on the morning of June 2, and weakened into a tropical storm a day later. Further weakening ensued as convection around Andres's center dissipated,[41] and the NHC declared Andres a remnant low on June 4.[44]
Moisture extending from the remnants of Andres brought light rain to parts of the Southwest United States, with Phoenix, Arizona having measurable precipitation on June 5 for the first time since records began in 1896.[45] This moisture further extended into Colorado, resulting in scattered severe thunderstorms.[46]
Hurricane Blanca

A tropical wave first monitored by the NHC late on May 27 spawned a weak low-pressure area well south of Acapulco, Mexico, two days later.[47][48] Plagued by strong upper-level winds from Hurricane Andres, the disturbance slowly organized into the season's second tropical depression at 12:00 UTC on May 31 and further into Tropical Storm Blanca on the following day. Moving little within a weak steering regime, the cyclone began to rapidly deepen by June 2 as conditions aloft became more favorable; following the appearance of a pinhole eye, Blanca became a major hurricane at 12:00 UTC on June 3. Shortly thereafter, Blanca reached its peak intensity as a Category 4 hurricane with winds of 145 mph (235 km/h) and a pressure of 936 mbar (936 hPa; 27.6 inHg).[17] Tremendous upwelling of cooler waters, with some areas falling from 30 to 21 °C (86 to 70 °F),[49] resulted in weakening early on June 4. A concurrent eyewall replacement cycle spurred further weakening and Blanca degraded to Category 1 status by June 5. The next day, a shifting ridge steered Blanca northwest back over warm waters, allowing Blanca to quickly reintensify to a secondary peak of 130 mph (210 km/h). However, as Blanca tracked poleward, waters beneath the cyclone cooled yet again, prompting a quick weakening trend. After weakening to a tropical storm on June 7, Blanca made landfall around 12:00 UTC on June 8, near Puerto Cortés with winds of 45 mph (70 km/h),[17] and became the earliest instance of a landfall in the Baja California Peninsula since records began in 1949.[49] Swiftly weakening over land, Blanca degenerated to a remnant low on June 9 and dissipated shortly after.[17]
On June 3, precautionary alerts were raised across the southern Baja California Peninsula and much of Western Mexico, due to potential impacts from the hurricane.[50] A collective 3,300 troops from the Mexican Army and Navy were deployed to Baja California Sur to ensure the safety of residents.[51] Although Blanca remained far from Jalisco, large swells and rip currents produced by the hurricane claimed four lives.[52] Across Baja California Sur, high winds downed power lines and left 104,106 residents without electricity. However, around 90 percent of the outages were fixed within 12 hours of the storm.[53] The remnants of Blanca later brought much-needed rain to parts of the Southwestern United States.[54] Daily rainfall records were broken in several areas, though accumulations were generally less than 1 in (25 mm).[55] Some flooding took place in Santa Barbara County, California.[56] Flash floods across Nevada inundated homes and roads,[57][58] and also caused minor damage to landscaping.[59] In New Mexico, strong thunderstorms brought hail of up to 1.75 in (4.4 cm) in diameter,[60] and spawned a brief EF0 tornado near Napi Headquarters.[61] Damage across California amounted to $68,000,[62] while damage across Nevada totaled $46,000.[63] Damage in New Mexico reached $20,000.[64] Additionally, on June 10, some of Blanca's moisture moved north and brought light showers to the San Francisco Bay Area.[65]
Hurricane Carlos

In early June, a Kelvin wave interacted with a few tropical waves to the south of Mexico. The system gradually organized and was designated as a tropical depression on June 10, while situated about 290 mi (470 km) south-southeast of Puerto Escondido, Oaxaca. Drifting slowly northwestward, the depression was upgraded further to tropical storm intensity. Although persistent wind shear and dry air hampered intensification early on, Carlos strengthened into a hurricane on June 13 after moving into more favorable conditions. However, the return of dry air and upwelling caused the storm to deteriorate into a tropical storm. Paralleling the Mexican coast, Carlos regained hurricane intensity on June 15 and peaked with sustained winds of 90 mph (145 km/h) and a pressure of 978 mbar (978 hPa; 28.9 inHg) the next day. Wind shear and dry air afterwards caused Carlos to rapidly weaken, falling to tropical storm intensity on June 17 and degenerating into a remnant low-pressure area hours later.[66]
Carlos' formation prompted coastal authorities to enact precautionary measures along states deemed at risk. In Guerrero, 507 shelters were opened.[67] The NHC also issued several tropical cyclone warnings and watches between June 11 and June 17 from Jalisco to Guerrero. Rough seas along the shore generated by the hurricane caused widespread damage.[66] Twelve ships, including a yacht worth 11 million pesos (US$717,000),[68] sunk in Playa Manzanillo harbor.[69] The waves, along with heavy rain, inflicted at least 5 million pesos (US$326,000) of damage on Michoacán's coastal installations.[66] Strong winds produced by the passing storm also downed trees, power poles, and billboards, especially in Acapulco.[70] There, 16 homes were swept away by the waves.[71]
Tropical Storm Ela


A tropical wave crossing the Eastern Pacific spawned a low-pressure area on July 3.[72] The system gradually organized amid persistent wind shear and on July 8, the system intensified into Tropical Depression Four-E just before it entered the area of responsibility of the Central Pacific Hurricane Center (CPHC).[73] On July 9, the depression intensified into a tropical storm as it tracked to the northwest, and was named Ela by the CPHC,[74] becoming the first central Pacific tropical storm to form as a depression in the eastern Pacific but be named in the central since Lana in 2009. Ela intensified slightly to reach its peak intensity with winds of 45 mph (70 km/h) and a pressure of 1002 mbar (1002 hPa; 29.6 inHg), however, strong wind shear prevented Ela from intensifying further by removing thunderstorms from the circulation center, and eventually causing it to gradually weaken. Ela was downgraded to a depression on July 10, and not long after declared a remnant low well east of the Hawaiian Islands.[72]
Tropical Storm Halola
| Tropical storm (SSHWS) | |
  | |
| Duration | July 10 – July 12 (exited basin) |
|---|---|
| Peak intensity | 60 mph (95 km/h) (1-min); 998 mbar (hPa) |
A monsoon trough building across the Pacific Ocean spawned a large, ill-defined circulation well southwest of Hawaii on July 3. The circulation organized slightly and began to detach from the monsoon trough on July 6, but further development was halted for a while as an upper-level anticyclone imparted strong wind shear over the system. The anticyclone moved away on July 9, allowing the low-level circulation to move under the persistent convection to the northwest. As thunderstorm activity expanded in coverage, the system was declared Tropical Depression One-C by the CPHC at 06:00 UTC on July 10. Moving westwards under the influence a strong ridge to the north, the depression slowly strengthened into Tropical Storm Halola early on July 11. After intensifying to reach winds of 60 mph (95 km/h), a slight increase in wind shear prevented further strengthening. Maintaining that intensity, Halola crossed the International Date Line into the Western Pacific basin late on July 12, and entered the area of responsibility of the Japan Meteorological Agency.[75]
Tropical Storm Iune


A weak low-pressure area was first identified in the monsoon trough southeast of Hawaii on July 2. It drifted west-northwest, gradually becoming better defined as thunderstorm activity increased and it separated from the monsoon trough; by 06:00 UTC on July 10, there was sufficient organization to declare it a tropical depression. The small size of the cyclone made it especially susceptible to moderate upper-level winds, and it failed to intensify to Tropical Storm Iune until 18:00 UTC on July 11, when deep convection persisted near the center. No further intensification occurred amid light southerly wind shear, and Iune weakened to a tropical depression around 18:00 UTC on July 12 as it moved west-southwest. After being devoid of thunderstorm activity for 18 hours, the storm degenerated to a remnant low by 12:00 UTC the next day. The post-tropical cyclone moved west across the Central Pacific before finally dissipating around 12:00 UTC on July 17.[76]
Hurricane Dolores

A westward-moving tropical wave crossed Central America and entered the Eastern Pacific on July 9. On July 11, the system was declared Tropical Depression Five-E while located roughly 345 mi (555 km) south-southeast of Acapulco, Mexico. Amid moderate northwesterly wind shear, the depression gradually strengthened into Tropical Storm Dolores and reached hurricane status on July 13. As Dolores moved roughly parallel to the coast of Mexico, the shear over the system decreased, allowing for a burst of rapid intensification. Dolores peaked as a Category 4 hurricane with winds of 130 mph (210 km/h) and a minimum pressure of 946 mbar (hPa; 27.94 inHg) early on July 15. However, as Dolores approached Socorro Island, the cyclone underwent an eyewall replacement cycle and began to steadily weaken. The storm remained potent though as it passed Socorro Island, with an automated weather station on the island recording sustained hurricane-force winds. Despite completing the cycle on July 16, Dolores had moved over cooler sea surface temperatures, and hence continued its weakening trend. By the morning of July 17, Dolores had deteriorated to a tropical storm, and eventually degenerated into a post-tropical remnant low about 300 mi (485 km) west of the Baja California coast the next day. The remnant low slowly curved southwards and dissipated on July 22 well west of San Diego.[77][78]
Moisture extending from the storm's remnants brought record rains and thunderstorms to Southern California; record monthly rainfall totals include 1.70 in (43 mm) in San Diego, 1.30 in (33 mm) in Los Angeles, and 1.16 in (29.5 mm) in Paso Robles. In the foothills and mountains of east San Diego County, rainfall exceeded 4 in (100 mm).[79][80] This had the effect of helping firefighters contain the North Fire,[81] but also resulted in debris flows and rock slides that damaged about 90 homes and submerged cars.[78] The San Diego River reached levels of 8.9 ft (2.7 m)—just below flood stage—and overflowed its banks in a few areas.[78] Flash flooding occurred in Moreno Valley, Perris, and La Mesa, while a microburst occurred in Tierrasanta. A haboob was also recorded in Anza-Borrego Desert State Park.[82] Strong winds blew over a semi truck as well as power poles and lines on Interstate 40 near the California-Nevada border, obstructing the road in both directions and causing $75,000 in damage.[83] In Kern County, a 62-year-old man was killed by a lightning strike.[84] A bridge along Interstate 10 near Desert Center was washed out, injuring one. Damage to the bridge was placed at $50 million.[85][86] Another road was washed out by flash flooding, this time along State Route 78 southwest of Cibola, Arizona, with damage totaling $50,000.[87] Hail the size of golf balls was recorded in Bear Valley, Alpine County, damaging a police vehicle.[88] Losses across California reached $50.477 million.[89]
Tropical Storm Enrique

A tropical wave about 1,150 mi (1,850 km) southwest of the tip of the Baja California Peninsula spawned a broad low-pressure area on July 10. The low's circulation became increasingly well-defined as the tropical wave moved away from the system, leading to the classification of Tropical Depression Six-E at 12:00 UTC on July 12. Gradually organizing as it crawled west-northwestwards, the depression intensified to become Tropical Storm Enrique 18 hours later. Despite being situated in a generally favorable environment, dry air to the northwest of Enrique entrained into its circulation, causing the system to struggle to intensify. Eventually, the system reached its peak intensity late on July 14 with 50 mph (80 km/h) winds and a minimum pressure of 1,000 mbar (hPa; 29.53 inHg). Thereafter, increasing southwesterly vertical wind shear threatened to expose the low-level circulation, and Enrique started to weaken on July 15. Despite moving over cooler waters, Enrique maintained its intensity over the next two days as it began to slow down and turn to the southwest under the influence of Hurricane Dolores to its east. During the afternoon of July 17, Enrique weakened to a tropical depression, and degenerated to a remnant low the next day. The remnants curved back to the east over the next few days, dissipating entirely well west of the Baja California Peninsula by July 22.[90]
Tropical Storm Felicia

A westward-tracking tropical wave moved off Africa on July 7, crossing into the East Pacific nine days later. The disturbance was initially disorganized, with a broad, elongated circulation and intermittent convection; by 06:00 UTC on July 23, however, it acquired sufficient organization to be declared a tropical depression about 430 mi (690 km) southwest of Baja California. Six hours later, the depression intensified into Tropical Storm Felicia and attained peak intensity with winds of 40 mph (65 km/h) and a pressure of 1004 mbar (hPa; 29.65 inHg). The negative effects of shear, dry air, and cooler waters began to affect Felicia almost immediately, and the cyclone weakened to a tropical depression by 00:00 UTC on July 24. All associated convection with the storm dissipated by 18:00 UTC that day, marking Felicia's degeneration into a remnant low 545 mi (875 km) west of the southern tip of Baja California. The low turned west and southwest prior to opening into a trough on July 28.[91]
Tropical Depression Eight-E

A tropical wave accompanied by showers and thunderstorms entered the Eastern Pacific Ocean on July 19. Tracking steadily westwards, the wave formed a low-pressure area in the middle of the Eastern Pacific on July 27. Turning slightly to the west-northwest, the low slowly intensified into Tropical Depression Eight-E six hours later. However, strong north-northwesterly wind shear prevented it from intensifying into a tropical storm. As Eight-E moved into a drier environment, it failed to sustain deep convection near its center, and eventually degenerated into a remnant low late on July 29. Eight-E's remnants continued tracking in a westward direction and opened up into a trough by August 1 well east-southeast of Hawaii.[92]
Hurricane Guillermo

A tropical disturbance well south of the Baja California Peninsula gained enough organization to be declared Tropical Depression Nine-E on July 29. Located in an environment of low wind shear, high sea surface temperatures and abundant moisture, conditions were very favorable for strengthening, allowing Nine-E to intensify into Tropical Storm Guillermo just six hours later. Continuing to quickly intensify while tracking steadily west-northwestwards, Guillermo became a hurricane only 36 hours after its formation, and eventually reached peak intensity with winds of 110 mph (175 km/h) and a pressure of 967 mbar (967 hPa; 28.6 inHg)—a strong Category 2 hurricane. Guillermo weakened slightly afterwards, but remained at Category 2 strength as it crossed 140°W into the Central Pacific late on August 1. However, as Guillermo neared Hawaii, increasing southwesterly wind shear began to weaken the cyclone, and Guillermo eventually degraded to a tropical storm on August 3. Wobbling towards the west-northwest following a break in the subtropical ridge, Guillermo weakened further to a tropical depression on August 7, located 90 mi (145 km) north of Maui. Not long after, Guillermo degenerated to a post-tropical low, and dissipated altogether by August 9.[93]
On August 6, some of Guillermo's moisture was brought to Northern California and the San Francisco Bay Area by the jet stream, bringing rare dry lightning storms to those areas during the night.[94]
Hurricane Hilda


A tropical wave behind Guillermo spawned a well-defined low-pressure area well to the west of Mexico, which became Tropical Depression Ten-E on August 6. The depression intensified into Tropical Storm Hilda the next day. Amid moderate northeasterly wind shear and warm waters, Hilda gradually strengthened into a hurricane on August 7 while moving steadily westwards. Rapid intensification ensued thereafter as the shear diminished and a small inner core developed, and Hilda became a major hurricane just before entering the Central Pacific. Continuing to rapidly intensify, Hilda eventually reached its peak intensity as a Category 4 hurricane late on August 8, possessing 145 mph (235 km/h) sustained winds and a minimum pressure of 937 mbar (hPa; 27.67 inHg). Hilda then moved over slightly cooler waters and into a drier environment, resulting in a weakening trend that saw Hilda drop below major hurricane status late on August 9. The next two days saw Hilda turn to the northwest and slow down while rounding the southwestern part of a subtropical ridge. Weakening continued and accelerated on August 10–11 as the subtropical jet stream over Hawaii inflicted strong wind shear over Hilda, exposing the low-level circulation. Under the influence of both the strong westerly jet stream and the easterly trade winds, Hilda became almost stationary as it rapidly dropped below hurricane strength on August 12. Convection over Hilda mostly dissipated by August 13, and the shallower system began to track to the west-southwest. Hilda degenerated to a remnant low south of Hawaii by August 14,[95] after bringing heavy rain to the Big Island.[96]
Tropical Depression Eleven-E

A broad low-pressure area around 485 mi (780 km) south-southwest of Cabo San Lucas organized into Tropical Depression Eleven-E on August 16. Moving on a northwesterly to west-northwesterly path, the cyclone failed to intensify due to its large circulation and entered an area of unfavorable conditions late on August 17. Southeasterly shear, dry air entrainment, and cooler waters caused the depression to lose its deep convection and eventually degenerate into a remnant low by August 18. The low turned to the north-northwest and dissipated into a trough two days later around 980 mi (1,580 km) west of Punta Eugenia.[97]
Hurricane Loke


A low-level trough developed along the Intertropical Convergence Zone southeast of Hawaii on August 13. It merged with the remnants of Hurricane Hilda into the monsoon trough by August 18, and continued west with intermittent bursts of convection. One such burst detached a well-defined circulation from the monsoon trough and pulled it northeastwards, leading to the formation of a tropical depression by 00:00 UTC on August 21, which became Tropical Storm Loke later that day. A nearby upper-level trough restricted the outflow of the storm shortly after formation, causing it to briefly weaken to a tropical depression early on August 22 while it moved in an undulating fashion. However, as Loke accelerated to the northeast with the trough positioned to the northwest, the upper-level environment became more favorable, and the system regained tropical storm strength early on August 23. Developing a cloud-filled eye, Loke reached hurricane intensity around 18:00 UTC on August 24, simultaneously peaking with winds of 75 mph (120 km/h) and a pressure of 985 mbar (985 hPa; 29.1 inHg). Afterwards, Loke was once again hindered by the aforementioned nearby trough, which served to impart strong wind shear over the system and pull it to the north. The cyclone weakened to a tropical storm late on August 25 as it underwent extratropical transition, before it was rapidly drawn northwestwards into the circulation of a large extratropical low (formerly Typhoon Atsani) by 00:00 UTC on August 27.[98]
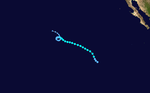
Hurricane Kilo
| Category 4 hurricane (SSHWS) | |
  | |
| Duration | August 22 – September 1 (Exited basin) |
|---|---|
| Peak intensity | 140 mph (220 km/h) (1-min); 940 mbar (hPa) |
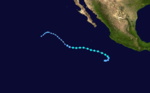
The disturbance that would become Kilo was first noticed by the CPHC within a trough on August 17, located 1,150 mi (1,850 km) southeast of the Big Island of Hawaii. The disturbance produced intermittent thunderstorm activity as it exited the trough on August 19–20. A mid-level ridge steered the disturbance west-northwestwards while imparting easterly wind shear over the system, serving to prevent the disturbance from organizing. Eventually, the shear decreased as the ridge weakened, and the disturbance became a tropical depression with convection near the center of circulation on August 22. During the next two days, the depression turned to the northwest and then the north around the western end of the weakening ridge, all the while remaining rather weak and disorganized. On August 26, however, the development of a new ridge directed the depression towards the southwest and caused the remaining wind shear to decrease. This led to the depression intensifying into Tropical Storm Kilo at 18:00 UTC as the system approached Johnston Atoll. Tropical storm warnings were issued for the atoll as Kilo passed within 35 mi (55 km) to the north at around 00:00 UTC on August 28.[15] Amid high sea surface temperatures and low vertical wind shear, Kilo began to quickly strengthen while being steered westwards by a mid-level ridge, attaining hurricane status on August 29. Over the next 24 hours, Kilo rapidly deepened into a Category 4 hurricane, with the winds nearly doubling from 75 to 140 mph (120 to 225 km/h). Kilo reached its peak intensity at the end of this strengthening phase, with the central pressure dropping to 940 mbar (hPa; 27.76 inHg). Around this time, Kilo was one of three hurricanes at Category 4 intensity spanning the Eastern and Central Pacific basins, the first such occurrence in recorded history. Thereafter, a slight weakening trend took place, with Kilo dropping to Category 3 status late on August 30. Turning to the northwest through a break in the ridge, Kilo maintained its intensity over the next couple of days as it approached the International Date Line. Between 12:00 UTC and 18:00 UTC on September 1, Kilo crossed the Date Line and entered the jurisdiction of the Japan Meteorological Agency, simultaneously becoming a typhoon. Kilo continued on as a tropical cyclone until September 10 when it dissipated near the western Kuril Islands of Russia, having traversed over 4,000 mi (6,400 km) from its genesis point south of the Hawaii islands.[15]
Operationally, Kilo was thought to have formed on August 20, and hence received a name before Loke, which formed on August 21. Kilo's date of formation was shifted to August 22 after post-storm analysis.[15]
Hurricane Ignacio


On August 25, a low-pressure system organized into Tropical Depression Twelve-E, before strengthening into Tropical Storm Ignacio later that day. Ignacio initially moved west-northwest, posing a threat to Hawaii. On August 26, Ignacio became a hurricane while continuing its trek towards Hawaii. Over the next few days, Ignacio struggled to intensify while being impacted by moderate wind shear. As wind shear relaxed, Ignacio was able to quickly intensify to major hurricane status on August 29.[99] At this time, the Big Island of Hawaii was placed under a tropical storm watch, as the island began feeling the effects of high surf.[100] Ignacio continued to rapidly intensify as it turned to the northwest and away from Hawaii, attaining peak intensity at Category 4 status with winds of 145 mph (235 km/h) and a minimum central pressure of 942 mbar (hPa; 27.82 inHg) on August 30.[99] Ignacio was also one of three simultaneous Category 4 Pacific hurricanes east of the International Date Line along with Kilo and Jimena, the first such occurrence in recorded history.[15][24]
After peaking in intensity, Ignacio began weakening as southwesterly wind shear increased. The system weakened to tropical storm strength at midnight on September 2 well north of Hawaii, but was soon able to reattain hurricane status while passing over anomalously warm waters and experiencing a brief respite in wind shear. Continuing to track northwards over decreasing sea surface temperatures, Ignacio weakened to a tropical storm for the last time on September 3, and became post-tropical late the next day. The remnants of Ignacio continued north across the Pacific, before turning to the east-northeast towards western Canada on September 6. On September 8, the extratropical remnants of Ignacio were absorbed by a cold front, hundreds of miles south of Alaska.[99]
Hurricane Jimena

A westward-moving low-pressure area organized into a tropical depression on August 26, around 735 mi (1,183 km) southwest of Manzanillo, Mexico. Moving over very warm waters and located in an environment of low wind shear and abundant moisture, the depression steadily strengthened, becoming Tropical Storm Jimena on August 27. Jimena soon developed a tight inner core, with the radius of maximum winds extending just 40 mi (65 km) from the center. This allowed Jimena to explosively deepen over the next two days—over a 48-hour period, its winds increased by 115 mph (185 km/h). At 06:00 UTC on August 29, Jimena reached its peak intensity as a strong Category 4 hurricane, possessing winds of 155 mph (250 km/h) and a minimum barometric pressure of 932 mbar (hPa; 27.52 inHg). Soon after, Jimena turned to the west-northwest and underwent an eyewall replacement cycle.[101] Despite weakening slightly, Jimena remained at Category 4 status, thus becoming one of three simultaneous Category 4 Pacific hurricanes east of the International Date Line on August 30—the first such occurrence of its kind.[15]
On August 30, Jimena completed the eyewall replacement cycle and quickly regained 150 mph (240 km/h) winds, this time with a larger eye of 40–45 mi (64–72 km) diameter. However, upwelling of cooler waters beneath the hurricane and entrainment of mid-level dry air into the circulation, as well as a second eyewall replacement cycle, resulted in a steady weakening beginning late on August 31. The next day, Jimena crossed 140°W as a Category 3 hurricane and entered the jurisdiction of the CPHC. Jimena continued to weaken slowly amid cooling sea surface temperatures and increasing westerly wind shear, eventually degrading below hurricane status on September 5.[101] Curving to the northwest, bursts of convection maintained Jimena as a tropical storm, in spite of westerly wind shear in excess of 25 mph (40 km/h) causing the low-level circulation center to be exposed.[102][103] Eventually, on September 9, Jimena weakened to a tropical depression as it turned west-southwestwards towards the Hawaiian islands. Succumbing to the strong shear, Jimena degenerated into a remnant low just before 00:00 UTC on September 10, roughly 230 mi (370 km) north of the Hawaiian islands.[101]
While passing north of the Hawaiian Islands on September 11, the remnants of Jimena diverted the winds to blow from the southeast, bringing humid air and atmospheric instability to the east-facing slopes of the Koʻolau Range on Oahu. This generated prolonged heavy rains that led to localized flash floods, made worse by saturated soils from earlier rainfall events. Flood advisories were issued early on September 11 and were cancelled the next morning. Flooding from the Waikane Stream forced the Kamehameha Highway to close for a few hours, reopening only in the evening. A peak rainfall total on Oahu of 9.37 in (238 mm) was recorded at Moanalua.[104][105]
Tropical Storm Kevin

A tropical wave crossed Central America on August 25. Although it initially only produced transient bursts of convection, slow organization of the feature led to the formation of a tropical depression by 18:00 UTC on August 31 while located well south of Baja California. Steered northwest and the north-northwest, the cyclone intensified into Tropical Storm Kevin by 18:00 UTC the next day while being plagued by moderate wind shear. After reaching peak intensity with winds of 60 mph (95 km/h) and a pressure of 998 mbar (998 hPa; 29.5 inHg) on September 3, a further increase in upper-level winds caused the low- and mid-level circulations to become displaced. Devoid of deep convection, Kevin degenerated to a remnant low by 12:00 UTC on September 5; the remnant circulation drifted northwest and dissipated the following day.[106]
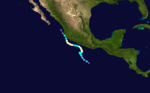
Hurricane Linda

Early in September, cluster of convection associated with a broad low-pressure area began to organize, becoming Tropical Depression Fifteen-E at 18:00 UTC on September 5. The next day, the depression organized enough to be classified as a tropical storm and was given the name Linda. The nascent system rapidly strengthened as it moved on a northwestward course, with large amounts of deep convection forming around the center. Just 12 hours after becoming a tropical storm, Linda reached hurricane status, and on September 7, the system became a Category 2 hurricane. Linda's strengthening stalled thereafter as wind shear increased slightly and dry air intruded on Linda's inner core. The next day, however, Linda again quickly intensified, this time to a strong Category 3 hurricane with winds of 125 mph (200 km/h) and a minimum pressure of 950 mbar (hPa; 28.05 inHg). From September 9 onward, Linda rapidly weakened as it moved into an area of dry, stable air and decreasing water temperatures, becoming a remnant low less than a week after forming. Linda's remnants slowed as they turned to the west-northwest and then back to the east before dissipating on September 14.[27]
Copious amounts of water vapor pulled north from Linda brought thunderstorms to portions of California beginning September 10. Flooding and rock slides prompted numerous road closures. One person drowned in the San Bernardino National Forest. Remnant moisture from Linda with a weak cold front also caused record heavy rainfall in Los Angeles on September 15,[107][108] with three swift water rescues and roughly 2 in (50 mm) of rain across the Los Angeles Basin.[109] Losses in the state reached $2.1 million.[110] Moisture from Linda also catalyzed the formation of scattered thunderstorms across Utah on September 14,[111] giving rise to two major flash flood incidents that became the deadliest flood event in Utah's history, with 21 people killed.[27] The first flash flood, occurring near Hildale, swept away two vehicles carrying a total of 16 people while they were watching the rising floodwaters, killing 13 of them.[112] Another death occurred when a man was swept away by floodwaters while traversing remote dirt roads.[113] The second flash flood occurred in Keyhole Canyon at Zion National Park, causing seven canyoneers within the area to perish.[114] Damage totals in Washington County, Utah reached $750,000,[115] while downstream flooding caused a further $500,000 of damage in Colorado City, Arizona.[116] The thunderstorms also caused some scattered damage across Arizona, with losses reaching $206,000.[117]
According to San Jose State University, Linda's remnants might have contributed to the severity of the Valley Fire.[118]
Tropical Storm Malia


A trough formed near the eastern reaches of the Central Pacific on September 9. It moved swiftly westward and slowly organized into a tropical depression around 18:00 UTC on September 18 as deep convection formed near its center. The nascent cyclone moved northeast after formation, steered between a ridge to its northeast and a trough to its northwest. Strong upper-level winds plagued the system throughout its duration, but the depression nonetheless intensified into Tropical Storm Malia around 00:00 UTC on September 21 and attained peak intensity with winds of 50 mph (80 km/h) and a pressure of 992 mbar (992 hPa; 29.3 inHg) twelve hours later. Malia turned northwest under increasing influence from the upper-trough, which simultaneously increased wind shear over the cyclone. After lacking deep convection for several hours, the storm degenerated to a remnant low by 18:00 UTC on September 22. The post-tropical cyclone moved north before being absorbed by an extratropical low over the north-central Pacific the next day.[119]
Tropical Depression Sixteen-E

A tropical wave gained enough organization to be declared Tropical Depression Sixteen-E on September 20. Located in an environment of strong southerly shear, the depression failed to intensify into a tropical storm. The next day, the heavily sheared system made landfall on Baja California, then on Isla Tiburon, and finally in Sonora, Mexico. It dissipated just hours later, with its remnants going on to affect parts of Arizona and New Mexico.[28]
Widespread heavy rains in Baja California and Sonora caused heavy flooding. Preliminary damage estimates in El Fuerte, Sinaloa, reached 300 million pesos (US$17.7 million).[28][120] The remnant low brought considerable moisture to the Desert Southwest, and later combined with other systems to produce flooding across the Great Plains and Upper Midwest.[28][121] In Arizona, severe thunderstorms occurred in Graham and Pima counties, resulting in $7,000 in property damage. Rainfall near Safford totaled up to 4 in (100 mm), while hail and winds gusting to 60 mph (97 km/h) were recorded at Davis–Monthan Air Force Base. In addition, an EF0 tornado briefly touched down in adjacent Cochise County.[122] Flash floods near Quartzsite forced the closure of Arizona State Route 95 and caused $5,000 in damage,[123] while flooding in Scottsdale caused $25,000 in damage.[124] Meanwhile, in New Mexico, rainfall in Roswell reached 3 in (80 mm). One person drowned along the Rio Grande in New Mexico. In Albuquerque, thunderstorms downed trees and flooded several streets. Property damage in New Mexico reached $85,000.[125] Further east, 8.00 in (203 mm) of rain fell in Council Bluffs, Iowa. Over 5,000 people lost power in the Omaha metropolitan area.[126]
Tropical Storm Niala


On September 20, a tropical disturbance was identified southeast of Hawaii, moving westward south of the subtropical ridge. The disturbance slowly organized and became Tropical Depression Six-C on September 25. The system was upgraded into Tropical Storm Niala soon after as it headed west-northwest towards Hawaii, prompting the issuance of a tropical storm watch for the Big Island. Despite moving over very warm waters, a mid- to upper-level low-pressure system well northeast of the Hawaiian islands inflicted moderate wind shear over Niala, causing it to struggle to intensify. Eventually, at 18:00 UTC on September 26, Niala achieved peak intensity with winds of 65 mph (105 km/h) and a central pressure of 992 mbar (hPa; 29.29 inHg). The detrimental effects of the wind shear soon began to show as Niala slowed and turned westwards away from Hawaii, with the low-level circulation becoming exposed as thunderstorms were sheared to the east. On September 28, Niala weakened to a tropical depression, and became a post-tropical low by September 29. The shallow remnant cyclone turned to the southwest under the influence of the low-level trade winds, dissipating by October 1.[127]
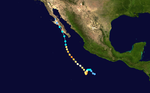
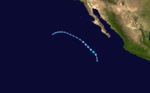
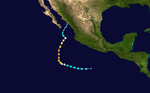
Hurricane Marty

A tropical wave, the northern portion of which led to the formation of the Atlantic's Tropical Depression Nine, emerged off the western coast of Africa on September 10. Steered steadily westward, the wave entered the East Pacific where deep convection coalesced around a well-defined center; this led to the formation of a tropical depression about 335 mi (540 km) southwest of Acapulco, Mexico by 18:00 UTC on September 26. The depression intensified into Tropical Storm Marty six hours later as it drifted north. Amid an environment conducive for strengthening, Marty reached hurricane intensity at 12:00 UTC on September 28 and attained peak intensity with winds of 80 mph (130 km/h) and a pressure of 987 mbar (987 hPa; 29.1 inHg) shortly thereafter. Wind shear abruptly increased following peak intensity, causing the cyclone to weaken quickly; it was downgraded to a tropical storm at 06:00 UTC on September 29 and degenerated into a remnant low a day later. The low eventually dissipated south of the Mexico coastline on October 4.[29]
Heavy rains and flooding from the remnants of Marty rendered 35,000 people homeless in Sonora. Flooding in Guaymas damaged 800 homes and 400 vehicles; three people sustained injuries.[128] Damage in the city reached 500 million pesos (US$30 million). Rains from Marty also caused several landslides in Guerrero, as well as flooding that damaged 300 homes west of Acapulco and injured two.[29]
Hurricane Oho


In an uncommon occurrence characteristic of El Niño years, a slow-moving disturbance detached from a monsoon trough southeast of Hawaii and became Tropical Depression Seven-C on October 3. The system became Tropical Storm Oho shortly after as it tracked to the east-northeast. Under southwesterly wind shear, Oho failed to intensify over the next day or so while moving erratically, eventually settling on a generally northeastward path. On October 5, convection finally began to cover the low-level circulation center, allowing Oho to strengthen. Following further improvement of the storm's structure as seen on infrared and microwave satellite imagery, the CPHC declared Oho a hurricane at 12:00 UTC on October 6. Accelerating northeastwards, Oho reached peak intensity as a strong Category 2 hurricane on October 7, with winds of 110 mph (175 km/h) and a minimum pressure of 957 mbar (hPa; 28.26 inHg). Immediately after, the combination of southwesterly wind shear and cooler sea surface temperatures caused Oho to begin a weakening trend. Oho transitioned to an extratropical cyclone by 12:00 UTC on October 8 as its winds dropped below hurricane-force. The extratropical remnant of Oho later regained hurricane-force winds due to strong baroclinicity, before moving over Alaska in a weakened state on October 10 and dissipating a few hours later.[129]
Tropical Depression Eight-C


On September 30, a tropical disturbance developed from a monsoon trough well east of the International Date Line. At that time, the system was about 1,035 mi (1,666 km) southwest of Hawaii. Slowly organizing over the next few days, the CPHC started to issue advisories on the system on October 3 and designated it as Tropical Depression Eight-C. Shortly after, however, increasing southerly wind shear prevented the storm from intensifying to a tropical storm and caused its convection to collapse. With the low-level circulation being displaced to the south of the quickly dissipating convection, the CPHC issued its final advisory on the next day. Eight-C's remnants slowly drifted west-northwestward, crossing the Date Line on October 6 and dissipating a few hours later.[130] The Japan Meteorological Agency, however, maintained the remnant system as a tropical depression when it crossed the Date Line.[131]
Tropical Storm Nora


A tropical wave departed the coast of Africa on September 19, eventually crossing Central America on October 3. It organized once in the Eastern Pacific, becoming a tropical depression around 12:00 UTC on October 9 and intensifying into Tropical Storm Nora 12 hours later. Moving along a west to west-northwest track, the cyclone entered the Central Pacific on October 11, where favorable environmental conditions allowed it to peak with winds of 70 mph (115 km/h) and a minimum pressure of 993 mbar (hPa; 29.32 inHg), just shy of hurricane strength. Upper-level winds soon became hostile, causing the system to weaken to a tropical depression early on October 14, degenerate to a remnant low late the next day, and ultimately dissipate just southeast of Hawaii around 00:00 UTC on October 16.[132]
The remnants of Nora brought heavy rains to the windward slopes of the Hawaiian Islands on October 16−17. Rainfall totals of 3–6 in (80–200 mm) caused minor flooding on the Big Island, Oahu, and Maui. On the Big Island, excessive surface runoff briefly forced the closure of a portion of Highway 19.[133]
Hurricane Olaf

A broad low-pressure area formed well south of Mexico late on October 9. At first, it showed some signs of organization, but convection associated with the system soon diminished as it tracked steadily westwards. Eventually the system reorganized, and by October 15, it had gained enough organization to be designated as Tropical Depression Nineteen-E. The depression organized very slowly due to its elongated circulation, and only became a tropical storm two days later, upon which the NHC named it Olaf. Soon after, Olaf began to rapidly intensify amid very favorable environmental conditions and became a hurricane on October 18, with hints of an eye starting to appear within a small central dense overcast.[35] Located at just 9.3°N, it broke the record for the lowest-latitude hurricane formation in the Eastern Pacific basin since reliable records began in 1971.[33] Olaf's intensification rate increased further overnight, and the next day, Olaf became a major hurricane with a well-defined pinhole eye.[35] At 9.8°N, it broke the record for the lowest-latitude major hurricane formation in the Eastern Pacific basin as well.[34] Six hours later, Olaf was upgraded to a Category 4 hurricane, the eighth of the season. Moving west-northwestwards, Olaf reached peak intensity with 150 mph (240 km/h) winds and a pressure of 938 mbar (hPa; 27.70 inHg), just as it crossed into the Central Pacific basin.[35]
After maintaining peak intensity for 12 hours, Olaf weakened to Category 3 status as it underwent an eyewall replacement cycle and encountered some dry mid-level air. Although the eye reappeared on satellite as the eyewall cycle completed, another one began while northwesterly wind shear increased, causing Olaf to weaken below major hurricane status while being pulled to the north by a passing trough. However, Olaf's northward movement resulted in a respite in shear, allowing Olaf to reintensify to a secondary peak intensity of 120 mph (195 km/h) on October 23. The next day, decreasing sea surface temperatures and another increase in wind shear finally began to weaken the storm for good. Despite maintaining a ragged eye until October 25, a further increase in wind shear from an approaching trough caused Olaf to weaken to a tropical storm while accelerating it to the east. On October 26, Olaf re-entered the Eastern Pacific, becoming the first storm on record to cross into the Central Pacific and turn back into the Eastern Pacific while still a tropical cyclone. The last of Olaf's deep convection continued to be sheared away, and the system became post-tropical on October 27 while still producing gale-force winds. Olaf's shallow remnants gradually weakened and turned back to the southwest, before dissipating on October 28.[35]
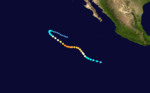
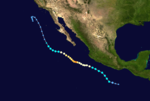
Hurricane Patricia

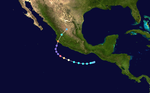
Tropical Depression Twenty-E formed from a broad low-pressure area off the southwestern coast of Mexico on October 20. It only slowly intensified at first, becoming Tropical Storm Patricia later that day. Entering an atmosphere highly conducive to rapid deepening on October 21, Patricia organized rapidly, and became a hurricane late that day. On October 22, explosive intensification occurred, and in only 24 hours, Patricia became a Category 5 hurricane with 175 mph (280 km/h) winds.[37] The intensification rate rivaled those of Hurricane Linda in 1997 and Hurricane Wilma in 2005. Patricia subsequently attained winds of 215 mph (345 km/h) and a central pressure of 872 mbar (hPa; 25.75 inHg), becoming the strongest tropical cyclone ever recorded in the Western Hemisphere, surpassing both the previous central pressure record set by Hurricane Wilma and the previous 1-minute sustained wind record set by Hurricane Allen. Afterwards, as it approached and later passed over Western Mexico, Patricia weakened even more rapidly than it intensified; just 30 hours after peaking in intensity, it was downgraded to a remnant low at 18:00 UTC on October 24.[134] However, Patricia's landfall near Cuixmala, Jalisco as a Category 4 hurricane with winds of 150 mph (240 km/h), was still sufficient to qualify as the second strongest landfall by any Pacific hurricane,[37] after only Hurricane Otis in 2023.
The precursor disturbance to Patricia brought heavy rain to Central America and parts of Mexico from October 18–20.[37] Approximately 223,000 people were affected by flooding and six were killed: four in El Salvador, one in Guatemala, and one in Nicaragua.[135][136][137][138] Damage in Chetumal, Mexico reached 1.4 billion pesos (US$85.3 million).[139] As a tropical cyclone, Patricia caused severe impacts when it made landfall in Jalisco, Mexico, killing six and causing at least 5.4 billion pesos (US$325 million) in damage.[37] An additional fatality occurred during evacuations in Jalisco.[140] In Emiliano Zapata and Chamela, the villages most badly affected by Patricia, violent winds tore off roofs, toppled concrete power poles and transmission lines, and defoliated trees. Hillsides were left barren and most small structures were severely damaged or completely destroyed.[37] Mexico's agricultural sector also suffered, with 42,000 ha (100,000 ac) of crops affected by Patricia, of which 15,000 hectares (37,000 acres) were deemed a total loss.[141] The papaya, banana, and plantain crops took the most damage.[37] The low death toll despite Patricia's landfall intensity was credited to the hurricane's small size, the low population density of the landfall area, as well as effective evacuations.[142] The remnants of Patricia's upper-level circulation later produced rains in South Texas,[143] causing flash floods that left $52.5 million in damage.[144][145]
Tropical Storm Rick

A tropical wave moved off the western coast of Africa on November 3, entering the East Pacific roughly two weeks later. The disturbance encountered a persistent area of convection in the Intertropical Convergence Zone, eventually coalescing into a tropical depression by 12:00 UTC on November 18 while located 715 mi (1,151 km) south-southeast of the southern tip of Baja California. Plagued by moderate southeasterly wind shear, the depression slowly intensified into Tropical Storm Rick and simultaneously attained peak intensity with winds of 40 mph (65 km/h) and a pressure of 1002 mbar (1002 hPa; 29.6 inHg) by 12:00 UTC on November 19. The cyclone failed to intensify further as it tracked west-northwest within a dry environment, weakening to a tropical depression by 06:00 UTC on November 22 and further degenerating into a remnant low 12 hours later. The low tracked northwest and eventually southwest prior to dissipating early on November 26.[146]
Hurricane Sandra

A tropical wave that emerged off the west coast of Africa on November 6 entered the Eastern Pacific on November 21. The system organized and was classified as a tropical depression on November 23 well south of Mexico. Environmental conditions, including high sea surface temperatures and low wind shear, were highly conducive to intensification and the storm quickly organized, becoming Tropical Storm Sandra early on November 25. A small central dense overcast developed atop the storm and Sandra reached hurricane status early on November 25 after the consolidation of an eye. The hurricane achieved its peak as a Category 4 hurricane with winds of 150 mph (240 km/h) and a pressure of 934 mbar (hPa; 27.58 inHg) early on November 26. This made Sandra the strongest November hurricane on record in the Northeastern Pacific, surpassing Hurricane Kenneth in 2011. Thereafter, increasing shear degraded the hurricane's structure and weakening ensued. Rapid weakening took place on November 27 and Sandra's circulation became devoid of convection as it diminished to a tropical storm that evening. The cyclone degenerated into a remnant low soon thereafter and ultimately dissipated just off the coast of Sinaloa, Mexico, on November 29.[39]
As the precursor to Sandra traversed Central America, it produced unseasonably heavy rainfall that triggered flooding and landslides. Four people died in various incidents related to the system: three in El Salvador and one in Honduras.[147] Initially expecting a landfalling storm, officials in Northwestern Mexico prepared equipment for power outages, closed schools, and evacuated 180 residents.[148] Sandra's effects largely consisted of light to moderate rainfall; some traffic accidents and landslides resulted from this, though the overall impacts were limited.[39][149]
Tropical Depression Nine-C


Despite the official end of the hurricane season about a month prior, a westerly wind burst in the equatorial waters of the Central Pacific led to the development of a tropical disturbance on December 27.[12] This feature also led to the formation of Cyclone Ula in the South Pacific.[150] Moving slowly eastward, the disturbance stayed in an environment with anomalously high sea surface temperatures and ample ocean heat content associated with the ongoing El Niño event, allowing thunderstorms in the system to develop and persist. Turning northwards, the system formed a closed low-level circulation and continued to slowly organize. At 00:00 UTC on December 31, Tropical Depression Nine-C formed at a very low latitude of 2.2°N. Moving slowly westwards, Nine-C never reached tropical storm strength due to its proximity to the equator and the presence of 20-knot vertical wind shear over the system, leaving the 2015 season one storm shy of the record from 1992. As convection in and around the depression was rapidly sheared to the west, the depression was unable to support itself and was downgraded into a remnant low at 00:00 UTC on January 1, 2016, marking the latest end to a Pacific hurricane season on record. The remnant low dissipated later that day.[12][151]
Storm names
The following list of names was used for named storms that formed in the North Pacific Ocean east of 140°W during 2015.[152] This is the same list used for the 2009 season.[153]
|
For storms that form in the North Pacific from 140°W to the International Date Line, the names come from a series of four rotating lists. Names are used one after the other without regard to year, and when the bottom of one list is reached, the next named storm receives the name at the top of the next list.[152] Eight named storms, listed below, formed within the area in 2015. Also, named storms in the table above that crossed into the area during the season are noted (*).[154]
|
|
|
|
Retirement
On April 25, 2016, at the 38th session of the RA IV Hurricane Committee, the World Meteorological Organization retired the name Patricia due to its extreme intensity, and it will not be used again for another Pacific hurricane. It was replaced with Pamela for the 2021 Pacific hurricane season.[155]
Season effects
This is a table of all of the tropical cyclones that formed in the 2015 Pacific hurricane season. It includes their name, duration (within the basin), peak classification and intensities, areas affected, damage, and death totals. Deaths in parentheses are additional and indirect (an example of an indirect death would be a traffic accident), but were still related to that storm. Damage and deaths include totals while the storm was extratropical, a wave, or a low, and all of the damage figures are in 2015 USD.
| Saffir–Simpson scale | ||||||
| TD | TS | C1 | C2 | C3 | C4 | C5 |
| Storm name |
Dates active | Storm category at peak intensity |
Max 1-min wind mph (km/h) |
Min. press. (mbar) |
Areas affected | Damage (USD) |
Deaths | Ref(s) | ||
|---|---|---|---|---|---|---|---|---|---|---|
| Andres | May 28 – June 4 | Category 4 hurricane | 145 (230) | 937 | Southwestern United States | None | None | |||
| Blanca | May 31 – June 9 | Category 4 hurricane | 145 (230) | 936 | Western Mexico, Baja California Peninsula, Southwestern United States | $134 thousand | 4 | |||
| Carlos | June 10–17 | Category 1 hurricane | 90 (150) | 978 | Southwestern Mexico, Western Mexico | $1.04 million | None | |||
| Ela | July 8–10 | Tropical storm | 45 (75) | 1002 | None | None | None | |||
| Halola | July 10–12 | Tropical storm | 60 (95) | 998 | None | None | None | |||
| Iune | July 10–13 | Tropical storm | 40 (65) | 1004 | None | None | None | |||
| Dolores | July 11–19 | Category 4 hurricane | 130 (215) | 946 | Southwestern Mexico, Western Mexico, Baja California Peninsula, Southwestern United States | $50.477 million | 1 | |||
| Enrique | July 12–18 | Tropical storm | 50 (85) | 1000 | None | None | None | |||
| Felicia | July 23–25 | Tropical storm | 40 (65) | 1004 | None | None | None | |||
| Eight-E | July 27–29 | Tropical depression | 35 (55) | 1006 | None | None | None | |||
| Guillermo | July 29 – August 7 | Category 2 hurricane | 110 (175) | 967 | Hawaii, Northern California | None | None | |||
| Hilda | August 6–14 | Category 4 hurricane | 145 (230) | 937 | Hawaii | None | None | |||
| Eleven-E | August 16–17 | Tropical depression | 35 (55) | 1003 | None | None | None | |||
| Loke | August 21–26 | Category 1 hurricane | 75 (120) | 985 | Hawaii | None | None | |||
| Kilo | August 22 – September 1 | Category 4 hurricane | 140 (220) | 940 | Hawaii, Johnston Atoll | None | None | |||
| Ignacio | August 25 – September 5 | Category 4 hurricane | 145 (230) | 942 | Hawaii, Western Canada | None | None | |||
| Jimena | August 26 – September 9 | Category 4 hurricane | 155 (250) | 932 | None | None | None | |||
| Kevin | August 31 – September 5 | Tropical storm | 60 (95) | 998 | Baja California Peninsula, Southwestern United States | None | None | |||
| Linda | September 5–10 | Category 3 hurricane | 125 (205) | 950 | Sinaloa, Oaxaca, Zacatecas, Southwestern United States | $3.59 million | 22 | |||
| Malia | September 18–22 | Tropical storm | 50 (85) | 992 | Hawaii | None | None | |||
| Sixteen-E | September 20–21 | Tropical depression | 35 (55) | 1001 | Baja California Peninsula, Northwestern Mexico, Southwestern United States | $17.8 million | 1 | |||
| Niala | September 25–28 | Tropical storm | 65 (100) | 992 | Hawaii | None | None | |||
| Marty | September 26–30 | Category 1 hurricane | 80 (130) | 987 | Southwestern Mexico, Western Mexico | $30 million | None | |||
| Oho | October 3–8 | Category 2 hurricane | 110 (175) | 957 | Western Canada, Alaska | None | None | |||
| Eight-C | October 3–4 | Tropical depression | 35 (55) | 1001 | None | None | None | |||
| Nora | October 9–15 | Tropical storm | 70 (110) | 993 | None | None | None | |||
| Olaf | October 15–27 | Category 4 hurricane | 150 (240) | 938 | None | None | None | |||
| Patricia | October 20–24 | Category 5 hurricane | 215 (345) | 872 | Central America, Mexico, Texas | $462.8 million | 8 (5) | |||
| Rick | November 18–22 | Tropical storm | 40 (65) | 1002 | None | None | None | |||
| Sandra | November 23–28 | Category 4 hurricane | 150 (240) | 934 | Central America, Baja California Peninsula, Northwestern Mexico | Minor | 4 | |||
| Nine-C | December 31 | Tropical depression | 35 (55) | 1001 | None | None | None | |||
| Season aggregates | ||||||||||
| 31 systems | May 28 – December 31 | 215 (345) | 872 | $566 million | 40 (5) | |||||
See also
- Tropical cyclones in 2015
- List of Pacific hurricanes
- Pacific hurricane season
- 2015 Atlantic hurricane season
- 2015 Pacific typhoon season
- 2015 North Indian Ocean cyclone season
- South-West Indian Ocean cyclone seasons: 2014–15, 2015–16
- Australian region cyclone seasons: 2014–15, 2015–16
- South Pacific cyclone seasons: 2014–15, 2015–16
- South Atlantic tropical cyclone
- 2014–16 El Niño event
Notes
- ^ a b A "major" hurricane is one that reaches Category 3 or higher on the five-level Saffir–Simpson scale; this corresponds to having winds of at least 110 miles per hour or 178 kilometers per hour.[1]
- ^ An average Pacific hurricane season, as defined by the National Oceanic and Atmospheric Administration, has fifteen tropical storms, eight hurricanes, and four major hurricanes.[2]
- ^ All damage totals are valued as of 2015 and in United States dollars, unless otherwise noted.
- ^ The total represents the sum of the squares of the maximum sustained wind speed (knots) for every (sub)tropical storm's intensity of over 33 knots (38 mph; 61 km/h), divided by 10,000 while they are above that threshold; therefore, tropical depressions are not included.
References
- ^ "The Saffir-Simpson Hurricane Wind Scale" (PDF). National Hurricane Center. May 2021. Retrieved November 28, 2023.
- ^ a b c Gerry Bell; Hui Wang; Eric S. Blake; Christopher W. Landsea (May 27, 2015). NOAA 2015 Eastern Pacific Hurricane Season Outlook (Report). Climate Prediction Center. Archived from the original on May 11, 2015. Retrieved May 28, 2015.
{{cite report}}: CS1 maint: unfit URL (link) - ^ "Background Information: East Pacific Hurricane Season". Climate Prediction Center. College Park, Maryland: National Oceanic and Atmospheric Administration. May 22, 2014. Retrieved May 29, 2014.
- ^ a b c d e f g National Hurricane Center; Hurricane Research Division; Central Pacific Hurricane Center (April 4, 2023). "The Northeast and North Central Pacific hurricane database 1949–2022". United States National Oceanic and Atmospheric Administration's National Weather Service. A guide on how to read the database is available here.
 This article incorporates text from this source, which is in the public domain.
- ^ a b c Presentan Primera Versión Del Pronóstico Para La Temporada De Ciclones Tropicales 2015 (PDF) (Report) (in Spanish). Servicio Meteorológico Nacional. April 10, 2015. Archived from the original (PDF) on 2015-05-28. Retrieved May 28, 2015.
- ^ "Basin Archives: Northeast Pacific Ocean Historical Tropical Cyclone Statistics". Fort Collins, Colorado: Colorado State University. Retrieved July 8, 2022.
- ^ "Background Information: The North Atlantic Hurricane Season". Climate Prediction Center. August 7, 2002. Retrieved March 5, 2019.
- ^ Kieran Hickey (August 2016). "A review of the 2015 hurricane, tropical cyclone and typhoon season". International Journal of Meteorology. 41 (398): 162–167. Retrieved March 3, 2019.
- ^ Tropical Weather Summary for the Central North Pacific (Report). Honolulu, Hawaii: Central Pacific Hurricane Center. January 1, 2016. Archived from the original on April 2, 2019. Retrieved March 2, 2019.
- ^ a b Chris Brenchley (December 18, 2015). Historic Hurricane Season – 2015 Summary for the Central Pacific Basin (PDF) (Report). Honolulu, Hawaii: Central Pacific Hurricane Center. Archived from the original (PDF) on April 2, 2019. Retrieved March 2, 2019.
- ^ a b Neal Dorst (January 21, 2010). "TCFAQ G1) When is hurricane season?". Atlantic Oceanographic and Meteorological Laboratory. Archived from the original on December 6, 2010. Retrieved March 5, 2019.
- ^ a b c d Sam Houston; Tom Birchard (December 22, 2016). Tropical Depression Nine-C (PDF) (Report). Tropical Cyclone Report. Honolulu, Hawaii: Central Pacific Hurricane Center. Archived from the original on March 20, 2018. Retrieved May 3, 2021.
- ^ a b Lixion A. Avila (February 26, 2016). 2015 Eastern North Pacific Hurricane Season (PDF) (Report). Annual Summary. Miami, Florida: National Hurricane Center. Retrieved March 2, 2019.
- ^ a b Jennifer M. Collins; Philip J. Klotzbach; Ryan N. Maue; David R. Roache; Eric S. Blake; Charles H. Paxton; Christopher A. Mehta (September 16, 2016). "The record-breaking 2015 hurricane season in the eastern North Pacific: An analysis of environmental conditions". Geophysical Research Letters. 43 (17): 9217–9224. Bibcode:2016GeoRL..43.9217C. doi:10.1002/2016GL070597. ISSN 1944-8007. S2CID 132207362.
- ^ a b c d e f g Thomas Birchard (October 10, 2018). Hurricane Kilo (PDF) (Report). Tropical Cyclone Report. Honolulu, Hawaii: Central Pacific Hurricane Center. Retrieved June 9, 2019.
- ^ 2015 Monthly Weather Tropical Summary (Report). Miami, Florida: National Hurricane Center. July 1, 2015. Retrieved March 2, 2019.
- ^ a b c d Richard J. Pasch; David P. Roberts (November 30, 2015). Hurricane Blanca (PDF) (Report). Tropical Cyclone Report. Miami, Florida: National Hurricane Center. Retrieved November 30, 2015.
- ^ Christopher W. Landsea (June 13, 2015). Hurricane Carlos Discussion Number 12 (Report). Miami, Florida: National Hurricane Center. Retrieved June 13, 2015.
- ^ Erdman, John. "Tropical Storm Ela Was One of the Earliest Tropical Storms of Record in the Central Pacific Basin". The Weather Channel. Retrieved 12 July 2015.
- ^ 2015 Monthly Weather Tropical Summary (Report). Miami, Florida: National Hurricane Center. August 1, 2015. Retrieved March 2, 2019.
- ^ Tropical Weather Summary for the Central North Pacific (Report). Honolulu, Hawaii: Central Pacific Hurricane Center. August 5, 2015. Archived from the original on April 2, 2019. Retrieved March 2, 2019.
- ^ 2015 Monthly Weather Tropical Summary (Report). Miami, Florida: National Hurricane Center. September 1, 2015. Retrieved March 2, 2019.
- ^ Tropical Weather Summary for the Central North Pacific (Report). Honolulu, Hawaii: Central Pacific Hurricane Center. September 2, 2015. Archived from the original on April 2, 2019. Retrieved March 2, 2019.
- ^ a b National Hurricane Center [@NWSNHC] (August 30, 2015). "1st time in history – 3 major hurricanes simultaneously in Pacific east of Int'l Dateline – Kilo, Ignacio & Jimena" (Tweet). Retrieved February 6, 2019 – via Twitter.
- ^ 2015 Monthly Weather Tropical Summary (Report). Miami, Florida: National Hurricane Center. October 1, 2015. Retrieved March 3, 2019.
- ^ Tropical Weather Summary for the Central North Pacific (Report). Honolulu, Hawaii: Central Pacific Hurricane Center. October 1, 2015. Archived from the original on March 6, 2019. Retrieved March 3, 2019.
- ^ a b c d Daniel P. Brown (November 12, 2015). Hurricane Linda (PDF) (Report). Tropical Cyclone Report. Miami, Florida: National Hurricane Center. Retrieved November 21, 2015.
- ^ a b c d John P. Cangialosi (January 11, 2016). Tropical Depression Sixteen-E (PDF) (Report). Tropical Cyclone Report. Miami, Florida: National Hurricane Center. Retrieved January 14, 2016.
- ^ a b c Robbie J. Berg (January 5, 2016). Hurricane Marty (PDF) (Report). Tropical Cyclone Report. Miami, Florida: National Hurricane Center. Retrieved January 15, 2016.
- ^ 2015 Monthly Weather Tropical Summary (Report). Miami, Florida: National Hurricane Center. November 1, 2015. Retrieved March 3, 2019.
- ^ Tropical Weather Summary for the Central North Pacific (Report). Honolulu, Hawaii: Central Pacific Hurricane Center. November 1, 2015. Archived from the original on March 6, 2019. Retrieved March 3, 2019.
- ^ Thomas Birchard (October 3, 2015). Tropical Depression Seven-C Discussion Number 1 (Report). Honolulu, Hawaii: Central Pacific hurricane Center. Archived from the original on July 18, 2018. Retrieved October 3, 2015.
- ^ a b Eric S. Blake (October 18, 2015). Hurricane Olaf Discussion Number 14 (Report). Miami, Florida: National Hurricane Center. Retrieved October 18, 2015.
- ^ a b Michael J. Brennan (October 19, 2015). Hurricane Olaf Discussion Number 19 (Report). Miami, Florida: National Hurricane Center. Retrieved October 19, 2015.
- ^ a b c d e Eric S. Blake; Jon Jelsema (February 9, 2016). Hurricane Olaf (PDF) (Report). Tropical Cyclone Report. Miami, Florida: National Hurricane Center. Retrieved May 7, 2016.
- ^ Richard J. Pasch (October 23, 2015). Hurricane Patricia Special Discussion Number 13 (Report). National Hurricane Center. Retrieved March 3, 2019.
- ^ a b c d e f g h Todd B. Kimberlain; Eric S. Blake; John P. Cangialosi (February 1, 2016). Hurricane Patricia (PDF) (Report). Tropical Cyclone Report. Miami, Florida: National Hurricane Center. Retrieved February 4, 2016.
- ^ 2015 Monthly Weather Tropical Summary (Report). Miami, Florida: National Hurricane Center. December 1, 2015. Retrieved March 3, 2019.
- ^ a b c Stacy R. Stewart (January 29, 2016). Hurricane Sandra (PDF) (Report). Tropical Cyclone Report. Miami, Florida: National Hurricane Center. Retrieved May 12, 2016.
- ^ Jack L. Beven II (May 23, 2015). "Tropical Weather Outlook valid 5 am PDT May 23, 2015" (TXT). Miami, Florida: National Hurricane Center. Retrieved May 28, 2015.
- ^ a b c d Michael J. Brennan (August 6, 2015). Hurricane Andres (PDF) (Report). Tropical Cyclone Report. Miami, Florida: National Hurricane Center. Retrieved August 11, 2015.
- ^ Daniel P. Brown (May 28, 2015). Tropical Storm Andres Discussion Number 2 (Report). Miami, Florida: National Hurricane Center. Retrieved May 28, 2015.
- ^ Michael J. Brennan (May 31, 2015). Hurricane Andres Discussion Number 15 (Report). Miami, Florida: National Hurricane Center. Retrieved May 31, 2015.
- ^ Todd B. Kimberlain (June 4, 2015). Post-Tropical Cyclone Andres Discussion Number 31 (Report). Miami, Florida: National Hurricane Center. Retrieved June 4, 2015.
- ^ Jeff Masters (June 5, 2015). "Category 2 Hurricane Blanca Headed Towards Baja Mexico". Weather Underground. Archived from the original on June 5, 2015. Retrieved June 5, 2015.
- ^ Tom Roeder; Chhun Sun (June 5, 2015). "Flood advisory issued for Colorado Springs". The Gazette. Retrieved June 9, 2015.
- ^ Eric S. Blake (May 27, 2015). "Tropical Weather Outlook valid 500 pm PDT Wed May 27, 2015". Miami, Florida: National Hurricane Center. Retrieved May 31, 2015.
- ^ Stacy R. Stewart (May 29, 2015). "Tropical Weather Outlook valid 1100 am PDT Wed May 29, 2015". Miami, Florida: National Hurricane Center. Retrieved May 31, 2015.
- ^ a b Jeff Masters (June 8, 2015). "Tropical Storm Blanca Hits Baja a Month Earlier Than Their Previous Earliest Landfall". Weather Underground. Retrieved June 8, 2015.
- ^ "Semar activa Plan Marina ante huracán Blanca". El Universal (in Spanish). June 3, 2015. Archived from the original on June 10, 2015. Retrieved June 3, 2015.
- ^ "Tormenta tropical Blanca sigue debilitándose". Economía Hoy (in Spanish). Notimex. June 8, 2015. Retrieved June 9, 2015.
- ^ Iván Suárez Jaramillo (June 10, 2015). "'Blanca' deja cuatro muertos a su paso por Jalisco". Noticieros Televisa (in Spanish). Jalisco, Mexico. Retrieved December 4, 2015.
- ^ "Blanca afectó 40% de usuarios de energía eléctrica en BCS". El Sol de Mexico (in Spanish). Los Cabos, Mexico. June 9, 2015. Archived from the original on June 10, 2015. Retrieved June 9, 2015.
- ^ Kristina Pydynowski (June 9, 2015). "Blanca to Raise Risk of Southwest US Downpours". AccuWeather. Archived from the original on December 8, 2015. Retrieved December 4, 2015.
- ^ Veronica Rocha (June 10, 2015). "The rain wasn't much, but it broke records for June". The Los Angeles Times. Retrieved June 11, 2015.
- ^ Preliminary Local Storm Report. National Weather Service Office in Los Angeles, California (Report). Los Angeles, California: National Oceanic and Atmospheric Administration. June 11, 2015. Archived from the original on June 14, 2015. Retrieved June 11, 2015.
- ^ Nevada Event Report: Flash Flood (Report). National Climatic Data Center. 2015. Retrieved December 4, 2015.
{{cite report}}: Unknown parameter|agency=ignored (help) - ^ Nevada Event Report: Flash Flood (Report). National Climatic Data Center. 2015. Retrieved December 4, 2015.
{{cite report}}: Unknown parameter|agency=ignored (help)- Nevada Event Report: Flash Flood (Report). National Climatic Data Center. 2015. Retrieved December 4, 2015.
{{cite report}}: Unknown parameter|agency=ignored (help) - Nevada Event Report: Flash Flood (Report). National Climatic Data Center. 2015. Retrieved December 4, 2015.
{{cite report}}: Unknown parameter|agency=ignored (help)
- Nevada Event Report: Flash Flood (Report). National Climatic Data Center. 2015. Retrieved December 4, 2015.
- ^ Nevada Event Report: Flash Flood (Report). National Climatic Data Center. 2015. Retrieved December 4, 2015.
{{cite report}}: Unknown parameter|agency=ignored (help) - ^ New Mexico Event Report: Hail (Report). National Climatic Data Center. 2015. Retrieved December 4, 2015.
{{cite report}}: Unknown parameter|agency=ignored (help) - ^ New Mexico Event Report: EF0 Tornado (Report). National Climatic Data Center. 2015. Retrieved December 4, 2015.
{{cite report}}: Unknown parameter|agency=ignored (help) - ^ California Event Reports: June 9–13, 2015 (Report). National Climatic Data Center. 2015. Retrieved October 18, 2015.
- ^ Nevada Event Reports: June 9–11, 2015 (Report). National Climatic Data Center. 2015. Retrieved December 4, 2015.
- ^ New Mexico Event Reports: June 9–11, 2015 (Report). National Climatic Data Center. 2015. Archived from the original on December 8, 2015. Retrieved December 4, 2015.
- ^ Evan Sernoffsky (June 10, 2015). "Bay Area showers break records, but dry weather to return". SFGate. Retrieved December 25, 2015.
- ^ a b c John L. Beven II; Christopher W. Landsea (October 27, 2015). Hurricane Carlos (PDF) (Report). Tropical Cyclone Report. Miami, Florida: National Hurricane Center. Retrieved November 10, 2015.
- ^ "Tropical Storm Carlos hits at Acapulco with high winds, surf". NewsOK. Acapulco, Mexico. June 14, 2014. Retrieved June 14, 2014.
- ^ "Tormenta causada por huracán Carlos hundió yate de Jorge Kahwagi en Acapulco". SPDnoticias.com (in Spanish). Mexico City. June 18, 2015. Retrieved May 21, 2017.
- ^ Héctor Briseño (June 21, 2015). "Dueños de lanchas dañadas por 'Carlos' en Guerrero, sin recursos para repararlas". La Jordana (in Spanish). Acapulco, Mexico. Archived from the original on 2015-06-22. Retrieved June 22, 2015.
- ^ "Se Registran, Hasta El Momento, Daños Menores Por 'Carlos' En Guerrero". Bajo Palabra (in Spanish). Acapulco, Guerrero. June 12, 2015. Archived from the original on 2015-06-14. Retrieved June 12, 2015.
- ^ "Tropical Storm Carlos hits at Acapulco with high winds, surf". Mercury News. Acapulco, Mexico. Associated Press. June 14, 2015. Retrieved June 14, 2015.
- ^ a b Stacy R. Stewart; Thomas Birchard (October 17, 2016). Tropical Storm Ela (PDF) (Report). Tropical Cyclone Report. Honolulu, Hawaii: Central Pacific Hurricane Center. Retrieved November 20, 2016.
- ^ Stacy R. Stewart (July 7, 2015). Tropical Depression Four-E Discussion Number 1 (Report). Miami, Florida: National Hurricane Center. Retrieved August 9, 2015.
- ^ Thomas Birchard (July 8, 2015). Tropical Storm Ela Discussion Number 6 (Report). Honolulu, Hawaii: Central Pacific Hurricane Center. Archived from the original on November 28, 2018. Retrieved August 9, 2015.
- ^ Derek Wroe (July 9, 2017). Tropical Storm Halola (PDF) (Report). Tropical Cyclone Report. Honolulu, Hawaii: Central Pacific Hurricane Center. Retrieved June 9, 2019.
- ^ Christopher Jacobson (April 16, 2018). Tropical Storm Iune (PDF) (Report). Tropical Cyclone Report. Honolulu, Hawaii: Central Pacific Hurricane Center. Retrieved June 9, 2019.
- ^ "Hurricane Dolores Recap". The Weather Channel. July 19, 2015. Retrieved August 8, 2015.
- ^ a b c Todd B. Kimberlain (October 27, 2015). Hurricane Dolores (PDF) (Report). Tropical Cyclone Report. Miami, Florida: National Hurricane Center. Retrieved November 11, 2015.
- ^ "California Gets 'Super Historic' July Rainfall Thanks to Former Hurricane Dolores; More Rain In the West Into Tuesday (FORECAST)". The Weather Channel. July 20, 2015. Retrieved March 21, 2019.
- ^ Record Event Report. National Weather Service (Report). July 19, 2015. Archived from the original on July 14, 2015.
- ^ Kevin Bryne (July 20, 2015). "Moisture to Help Firefighters Gain Upper Hand on Destructive North Fire Burning in California". Accuweather. Archived from the original on August 5, 2015. Retrieved July 20, 2015.
- ^ California Event Report: Flash Flood. National Weather Service Office in San Diego, California (Report). National Climatic Data Center. 2015. Retrieved May 26, 2015.
- ^ California Event Report: Thunderstorm Wind. National Weather Service Office in Las Vegas, Nevada (Report). National Climatic Data Center. 2015. Retrieved May 26, 2015.
- ^ California Event Report: Lightning. National Weather Service Office in Hanford, California (Report). National Climatic Data Center. 2015. Retrieved May 5, 2015.
- ^ California Event Report: Flash Flood. National Weather Service Office in Phoenix, Arizona (Report). National Climatic Data Center. 2015. Retrieved December 2, 2015.
- ^ Patrick Edgell; Megan Terlecky; Joe Galli; Bianca Rae (July 19, 2015). "I-10 bridge repair expected to cost $5M". KESQ-TV. Desert Center, California. Archived from the original on December 22, 2018. Retrieved July 19, 2015.
- ^ California Event Report: Flash Flood. National Weather Service Office in Phoenix, Arizona (Report). National Climatic Data Center. 2015. Retrieved May 26, 2015.
- ^ California Event Report: Hail. National Weather Service Office in Sacramento, California (Report). National Climatic Data Center. 2015. Retrieved May 7, 2015.
- ^ California Event Reports: July 17–20, 2015 (Report). National Climatic Data Center. 2015. Retrieved May 7, 2019.
- ^ Daniel P. Brown (September 16, 2015). Tropical Storm Enrique (PDF) (Report). Tropical Cyclone Report. Miami, Florida: National Hurricane Center. Retrieved April 29, 2017.
- ^ John P. Cangialosi (September 3, 2015). Tropical Storm Felicia (PDF) (Report). Tropical Cyclone Report. Miami, Florida: National Hurricane Center. Retrieved May 9, 2017.
- ^ Robbie J. Berg (September 9, 2015). Tropical Depression Eight-E (PDF) (Report). Tropical Cyclone Report. Miami, Florida: National Hurricane Center. Retrieved November 12, 2015.
- ^ Lixion A. Avila; Jeff Powell (February 22, 2016). Hurricane Guillermo (PDF) (Report). Tropical Cyclone Report. Miami, Florida: National Hurricane Center. Retrieved February 3, 2019.
- ^ Monica Woods (August 6, 2015). "Active Pacific hurricane season brings unusual summer rain, risk of lightning". USA Today. Retrieved April 25, 2019.
- ^ Eric S. Blake; Jon Jelsema (September 6, 2016). Hurricane Hilda (PDF) (Report). Tropical Cyclone Report. Miami, Florida: National Hurricane Center. Retrieved February 3, 2019.
- ^ "Remnants of Hilda Depart from Hawaii". The Weather Channel. August 14, 2015. Retrieved November 23, 2015.
- ^ Richard J. Pasch (February 16, 2016). Tropical Depression Eleven-E (PDF) (Report). Tropical Cyclone Report. Miami, Florida: National Hurricane Center. Retrieved February 27, 2016.
- ^ Derek Wroe (August 1, 2017). Hurricane Loke (PDF) (Report). Tropical Cyclone Report. Honolulu, Hawaii: Central Pacific Hurricane Center. Retrieved June 9, 2019.
- ^ a b c John L. Beven II; Christopher Jacobson (August 17, 2018). Hurricane Ignacio (PDF) (Report). Tropical Cyclone Report. Miami, Florida and Honolulu, Hawaii: National Hurricane Center. Retrieved August 21, 2018.
- ^ "Ignacio Becomes Major Hurricane Overnight, Tropical Storm Watch Issued". Big Island Video News. August 29, 2015. Retrieved September 11, 2015.
- ^ a b c Stacy R. Stewart; Jeffrey Powell (February 4, 2016). Hurricane Jimena (PDF) (Report). Tropical Cyclone Report. Miami, Florida: National Hurricane Center. Retrieved February 9, 2016.
- ^ Christopher Jacobson (September 6, 2015). Tropical Storm Jimena Discussion Number 47 (Report). Honolulu, Hawaii: Central Pacific Hurricane Center. Retrieved September 6, 2015.
- ^ Christopher Jacobson (September 7, 2015). Tropical Storm Jimena Discussion Number 48 (Report). Honolulu, Hawaii: Central Pacific Hurricane Center. Retrieved September 7, 2015.
- ^ Kevin R. Kodama (October 6, 2015). September 2015 Precipitation Summary (Report). National Weather Service Office in Honolulu, Hawaii. Archived from the original on April 7, 2019. Retrieved April 24, 2019.
- ^ Craig Gima (September 11, 2015). "Flash flood warnings canceled; flood watch remains for Oahu, Kauai County". Honolulu Star-Advertiser. Retrieved April 24, 2019.
- ^ Todd B. Kimberlain (November 28, 2015). Tropical Storm Kevin (PDF) (Report). Tropical Cyclone Report. Miami, Florida: National Hurricane Center. Retrieved December 3, 2015.
- ^ Jim Holt (September 10, 2015). "Fierce heat to give way to cooler weather in SCV". The Santa Clarita Valley Signal. Archived from the original on September 23, 2015. Retrieved September 11, 2015.
- ^ John Antczak; Linda S. Zhang (September 10, 2015). "Heat blankets California, mixed with lightning, storms". KBAK, KBFX. Associated Press. Archived from the original on September 27, 2015. Retrieved September 11, 2015.
- ^ Chris Dolce. "Los Angeles Sees Unusual September Rains From Remnants of Hurricane Linda; Water Rescues Reported on L.A. River". The Weather Channel. Retrieved September 19, 2015.
- ^ California Event Reports: September 8–15, 2015 (Report). National Climatic Data Center. 2015. Retrieved December 17, 2015.
- ^ Bob Henson (September 15, 2015). "Linda's Moisture Contributes to Heavy Rain, Deadly Flooding in Southwest". Weather Underground. Retrieved March 8, 2019. [permanent dead link]
- ^ David DeMille (September 29, 2015). "Results elusive in search for missing Hildale flood victim". The Spectrum. Gannett Company. Retrieved November 21, 2015.
- ^ Laura Wagner (September 17, 2015). "Authorities Search For Another Possible Victim In Utah Flash Floods". National Public Radio. Retrieved September 17, 2015.
- ^ Tim Stelloh (September 17, 2015). "After Devastating Utah Floods, Final Body Found in Zion National Park". NBC News. Retrieved September 17, 2015.
- ^ Utah Event Report: Flash Flood (Report). National Climatic Data Center. 2015. Retrieved December 17, 2015.
{{cite report}}: Unknown parameter|agency=ignored (help) - ^ Arizona Event Report: Flash Flood (Report). National Climatic Data Center. 2015. Retrieved December 17, 2015.
{{cite report}}: Unknown parameter|agency=ignored (help) - ^ Arizona Event Reports: September 12–14, 2015 (Report). National Climatic Data Center. 2015. Retrieved December 17, 2015.
- ^ Kevin Schultz (September 27, 2015). "Windy remnants of hurricane may have hastened Valley Fire". San Francisco Chronicle. Retrieved October 3, 2015.
- ^ Jon Jelsema (June 1, 2016). Tropical Storm Malia (PDF) (Report). Tropical Cyclone Report. Honolulu, Hawaii: Central Pacific Hurricane Center. Retrieved June 20, 2018.
- ^ "Desfogues dañan obras e inundan cultivos y granjas". El Debate (in Spanish). El Fuerte, Mexico. September 23, 2015. Retrieved September 30, 2015.
- ^ Erdman, Jon; Wiltgen, Nick (September 25, 2015). "Remnants of Tropical Depression Sixteen-E Bring Flash Floods to Phoenix, Albuquerque and Omaha Metro Areas". The Weather Channel. Retrieved September 27, 2015.
- ^ Arizona Event Report: Flash Flood. National Weather Service Office in Tucson, Arizona (Report). National Climatic Data Center. 2015. Retrieved April 30, 2019.
- ^ Arizona Event Report: Flash Flood. National Weather Service Office in Phoenix, Arizona (Report). National Climatic Data Center. 2015. Retrieved April 30, 2019.
- ^ Arizona Event Report: Flash Flood. National Weather Service Office in Phoenix, Arizona (Report). National Climatic Data Center. 2015. Retrieved April 30, 2019.
- ^ New Mexico Event Report: Flash Flood. National Weather Service Office in Albuquerque, New Mexico (Report). National Climatic Data Center. 2015. Retrieved April 30, 2019.
- ^ Remnants of Tropical Depression Sixteen-E Bring Flash Floods to Phoenix, Albuquerque and Omaha Metro Areas, The Weather Channel, September 26, 2015
- ^ Sam Houston; Tom Birchard (November 16, 2016). Tropical Storm Niala (PDF) (Report). Tropical Cyclone Report. Honolulu, Hawaii: Central Pacific Hurricane Center. Retrieved January 8, 2017.
- ^ "Lluvias dejan 35 mil danmificados en Sonora". Periódico Correo (in Spanish). Guaymas, Mexico. El Universal. October 5, 2015. Retrieved October 5, 2015.
- ^ Sam Houston; Derek Wroe (November 21, 2016). Hurricane Oho (PDF) (Report). Tropical Cyclone Report. Honolulu, Hawaii: Central Pacific Hurricane Center. Retrieved December 23, 2016.
- ^ Christopher Jacobson (October 10, 2017). Tropical Depression Eight-C (PDF) (Report). Tropical Cyclone Report. Honolulu, Hawaii: Central Pacific Hurricane Center. Retrieved June 9, 2019.
- ^ JMA WWJP25 Warning and Summary October 6, 2015 18z (Report). Japan Meteorological Agency. October 6, 2015. Archived from the original on October 8, 2015. Retrieved October 10, 2015.
- ^ Lixion A. Avila (December 8, 2015). Tropical Storm Nora (PDF) (Report). Tropical Cyclone Report. Miami, Florida: National Hurricane Center. Retrieved December 24, 2015.
- ^ Kevin R. Kodama (November 5, 2015). October 2015 Precipitation Summary (Report). National Weather Service Office in Honolulu, Hawaii. Archived from the original on April 30, 2019. Retrieved April 30, 2019.
- ^ Jonathan Belles (October 22, 2018). "Three Years Ago, Hurricane Patricia Became the Record Strongest Hurricane in the Western Hemisphere With 215 MPH Winds". The Weather Channel. Retrieved March 8, 2019.
- ^ J. Lopez; F. Rodriquez (October 20, 2015). "Lluvias han afectado a 223 mil guatemaltecos". El Periódico (in Spanish). Archived from the original on November 24, 2015. Retrieved October 22, 2015.
- ^ "Cuatro muertos, daños y suspensión de clases a causa de las lluvias". El Diario de Hoy (in Spanish). October 18, 2015. Archived from the original on October 22, 2015. Retrieved October 22, 2015.
- ^ "Un muerto y damnificados por inundaciones en Guatemala". La Tribuna (in Spanish). Guatemala City, Guatemala. Agence France-Presse. October 18, 2015. Archived from the original on October 20, 2015. Retrieved October 22, 2015.
- ^ "Merman lluvias en la región, pero autoridades mantendrán las alertas". El Heraldo (in Spanish). San Salvador, El Salvador. Agence France-Presse. October 21, 2015. Retrieved October 22, 2015.
- ^ "Daños por lluvias en Chetumal ascienden a 1,400 mdp: alcalde". Unión Cancún (in Spanish). Chetumal, Mexico. October 23, 2015. Archived from the original on October 25, 2015. Retrieved October 28, 2015.
- ^ "Reportan muerte de mujer coahuilense por 'Patricia'". El Siglo de Durango (in Spanish). October 24, 2015. Retrieved October 24, 2015.
- ^ Antonio Hernández (October 28, 2015). "Suman 40 mil hectáreas afectadas por "Patricia"". El Universal. Mexico City, Mexico. Retrieved October 28, 2015.
- ^ Bob Henson (October 26, 2015). "The Cataclysm That Wasn't: Hurricane Patricia Largely Spares Mexico, Texas". Weather Underground. Retrieved October 26, 2015.
- ^ Jeff Masters; Bob Henson (October 24, 2015). "Patricia's Remnants to Fuel Dangerous Rains in Texas". Weather Underground. Retrieved October 25, 2015.
- ^ Texas Event Report: Heavy Rain. National Weather Service Office in Brownsville, Texas (Report). National Climatic Data Center. 2016. Retrieved February 26, 2016.
- ^ Texas Event Report: Heavy Rain. National Weather Service Office in Brownsville, Texas (Report). National Climatic Data Center. 2016. Retrieved February 26, 2016.
- ^ John L. Beven II (January 20, 2016). Tropical Storm Rick (PDF) (Report). Tropical Cyclone Report. Miami, Florida: National Hurricane Center. Retrieved January 22, 2016.
- ^ Rezaye Álvarez M.; Sergio León (November 21, 2015). "Lluvia atípica causa estragos". La Prensa (in Spanish). Retrieved May 12, 2016.
- "Niña de 25 días muere al derrumbarse su casa por lluvias en Honduras". El Nuevo Diario (in Spanish). Tegucigalpa, Honduras. November 22, 2015. Archived from the original on June 4, 2016. Retrieved May 12, 2016.
- Héctor Rivas (November 23, 2015). "Tres hombres mueren por las crecidas en dos ríos". La Prensa Grafica (in Spanish). Retrieved May 12, 2016.
- ^ "Suspenden clases en BCS por huracán Sandra". El Economista (in Spanish). Notimex. November 27, 2015. Retrieved May 12, 2016.
- "Arriban a BCS 96 camiones de CFE ante llegada de huracán "Sandra"". SDP Noticias (in Spanish). La Paz, Mexico. November 27, 2015. Retrieved May 12, 2016.
- Javier Valdez Cárdenas; Irene Sánchez; Myriam Navarro (November 28, 2015). "Declaran alerta en Sinaloa y Nayarit por 'Sandra'". La Jordana (in Spanish). Culiacán, Mexico. Archived from the original on 2016-08-17. Retrieved May 12, 2016.
- ^ "Pavimento mojado por lluvias en Cabo San Lucas provocó 2 accidentes viales". BCS Noticias (in Spanish). November 28, 2015. Retrieved May 12, 2016.
- ^ Derek Wroe; Sam Houston (December 13, 2018). Hurricane Pali (PDF) (Report). Tropical Cyclone Report. Honolulu, Hawaii: Central Pacific Hurricane Center. Retrieved July 4, 2019.
- ^ Erdman, John. "Tropical Depression Nine-C Dissipates; Caps Off a Record Central Pacific Hurricane Season". The Weather Channel. The Weather Channel. Retrieved 6 January 2016.
- ^ a b "Tropical Cyclone Names". National Hurricane Center. National Oceanic and Atmospheric Administration. April 11, 2013. Archived from the original on April 30, 2013. Retrieved May 8, 2013.
- ^ National Hurricane Center (2008). "Worldwide Tropical Cyclone Names". National Oceanic and Atmospheric Administration. Archived from the original on August 4, 2008. Retrieved March 7, 2024.
- ^ Klotzbach, Phil (December 3, 2015). "The typically quiet Central Pacific hurricane season shattered records this year". The Washington Post. Retrieved January 27, 2024.
- ^ "World Meteorological Organization retires storm names Erika, Joaquin and Patricia" (Press release). National Oceanic and Atmospheric Administration. April 25, 2016. Retrieved April 27, 2016.
External links
- National Hurricane Center Website
- National Hurricane Center's Eastern Pacific Tropical Weather Outlook
- Central Pacific Hurricane Center Website
- Servicio Meteorológico Nacional Website (in Spanish)
- NHC 2015 Pacific hurricane season archive
Tropical cyclones of the 2015 Pacific hurricane season | ||
|---|---|---|
 | ||