
| |||||||||||||||||||||||||||||||||||||||||||||||
All 46 seats to Warwick District Council 24 seats needed for a majority | |||||||||||||||||||||||||||||||||||||||||||||||
|---|---|---|---|---|---|---|---|---|---|---|---|---|---|---|---|---|---|---|---|---|---|---|---|---|---|---|---|---|---|---|---|---|---|---|---|---|---|---|---|---|---|---|---|---|---|---|---|
| |||||||||||||||||||||||||||||||||||||||||||||||
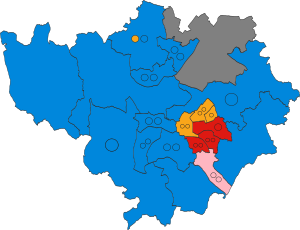 Winner of each seat at the 2011 Warwick District Council election | |||||||||||||||||||||||||||||||||||||||||||||||
 Composition of the council after the election | |||||||||||||||||||||||||||||||||||||||||||||||
| |||||||||||||||||||||||||||||||||||||||||||||||
Elections to Warwick District Council took place on Thursday 5 May 2011.
A total of 46 seats were up for election, all councillors from all wards. The previous elections produced a majority for the Conservative Party.
Summary
Election result
| Warwick District Council Election, 2011 | ||||||||||
|---|---|---|---|---|---|---|---|---|---|---|
| Party | Candidates | Seats | Gains | Losses | Net gain/loss | Seats % | Votes % | Votes | +/− | |
| Conservative | 45 | 25 | 1 | 0 | 54.3% | 39.5% | 45,940 | -1.8% | ||
| Liberal Democrats | 35 | 9 | 0 | 0 | 19.6% | 18.3% | 21,246 | -5.1% | ||
| Labour | 39 | 8 | 0 | 1 | 17.4% | 25.4% | 29,478 | +4.5% | ||
| Whitnash Residents | 3 | 3 | 0 | 0 | 6.5% | 4.3% | 5,002 | -0.8% | ||
| Green | 46 | 0 | 0 | 0 | 0.0% | 11.5% | 13,345 | +3.3% | ||
| UKIP | 3 | 0 | 0 | 0 | 0.0% | 0.4% | 485 | N/A | ||
| Independent | 2 | 1 | 0 | 0 | 2.2% | 0.6%% | 750 | ±0.0% | ||
Ward results
Bishop's Tachbrook
| Party | Candidate | Votes | % | ±% | |
|---|---|---|---|---|---|
| Conservative | Richard Alan Brookes | 483 | 47.5% | -5.4% | |
| Labour | Chris McKeown | 229 | 22.5% | -12.0% | |
| Independent | Malcolm Kenneth Doody | 188 | 18.5% | N/A | |
| Liberal Democrats | Karol Antoni Kaliczak | 60 | 5.9% | N/A | |
| Green | Emma Elizabeth Paveley | 57 | 5.6% | -7.0% | |
| Majority | 254 | 25.0% | +6.6% | ||
| Turnout | |||||
| Conservative hold | Swing | ||||
Budbrooke
| Party | Candidate | Votes | % | ±% | |
|---|---|---|---|---|---|
| Conservative | Clare Sawdon | 1,574 | 32.3% | -4.4% | |
| Conservative | Alan Bertrand Rhead | 1,497 | 30.8% | -4.3% | |
| Labour | Emma Samantha Mort | 571 | 11.7% | +0.8% | |
| Labour | Steven Gordon Suckling | 425 | 8.7% | +0.8% | |
| Liberal Democrats | Antony Butcher | 281 | 5.8% | N/A | |
| Green | Harriet Worrell | 218 | 4.5% | -5.0% | |
| Liberal Democrats | Martin Gardner Eggleston | 193 | 4.0% | N/A | |
| Green | Jeremy Peter Worrell | 108 | 2.2% | N/A | |
| Majority | 77 | 1.5% | -0.1% | ||
| Turnout | |||||
| Conservative hold | Swing | ||||
| Conservative hold | Swing | ||||
Cubbington
| Party | Candidate | Votes | % | ±% | |
|---|---|---|---|---|---|
| Conservative | John Stanley Hammon | 1,400 | 33.4% | -0.8% | |
| Conservative | Norman Henry Pratt | 1,355 | 32.3% | -0.2% | |
| Labour | John Harrow Roberts | 698 | 16.6% | +1.4% | |
| Green | Gareth John Davies | 513 | 12.2% | +2.0% | |
| Green | Nicola Stephenson | 230 | 5.5% | N/A | |
| Majority | 45 | 1.1% | +0.6% | ||
| Turnout | |||||
| Conservative hold | Swing | ||||
| Conservative hold | Swing | ||||
Kenilworth Abbey
| Party | Candidate | Votes | % | ±% | |
|---|---|---|---|---|---|
| Conservative | Michael Francis Coker | 1,589 | 16.8% | -1.5% | |
| Liberal Democrats | Ann Blacklock | 1,495 | 15.9% | -0.9% | |
| Conservative | George Reginald Illingworth | 1,479 | 15.7% | -0.7% | |
| Conservative | John Anthony Cooke | 1,339 | 14.2% | -1.6% | |
| Liberal Democrats | Kate Dickson | 1,060 | 11.2% | -2.0% | |
| Liberal Democrats | Pat Ryan | 1,005 | 10.7% | -2.2% | |
| Labour | Andrew Keith Roadnight | 490 | 5.2% | +2.4% | |
| Green | May Alice Fitzpatrick | 476 | 5.0% | +1.2% | |
| Green | Ann Laura Lewis | 252 | 2.7% | N/A | |
| Green | David Keith Charles Wood | 244 | 2.6% | N/A | |
| Majority | 94 | 0.9% | -0.6% | ||
| Turnout | |||||
| Conservative hold | Swing | ||||
| Liberal Democrats hold | Swing | ||||
| Conservative hold | Swing | ||||
Kenilworth Park Hill
| Party | Candidate | Votes | % | ±% | |
|---|---|---|---|---|---|
| Conservative | Dave Shilton | 1,885 | 20.0% | -0.8% | |
| Conservative | Felicity Gena Bunker | 1,731 | 18.4% | -1.2% | |
| Conservative | Andrew James Mobbs | 1,673 | 17.7% | -1.5% | |
| Labour | Justine Potts | 724 | 7.7% | +4.7% | |
| Liberal Democrats | Alison Tyler | 680 | 7.2% | -4.8% | |
| Liberal Democrats | Andy Tulloch | 570 | 6.0% | -5.4% | |
| Liberal Democrats | Susan McGowan | 549 | 5.8% | -4.6% | |
| Labour | Ian Henderson | 547 | 5.8% | N/A | |
| Green | James Harrison | 497 | 5.3% | +1.8% | |
| Green | Pam Lunn | 333 | 3.5% | N/A | |
| Green | Angela Maria Owen | 243 | 2.6% | N/A | |
| Majority | 154 | 1.6% | +0.4% | ||
| Turnout | |||||
| Conservative hold | Swing | ||||
| Conservative hold | Swing | ||||
| Conservative hold | Swing | ||||
Kenilworth St. John's
| Party | Candidate | Votes | % | ±% | |
|---|---|---|---|---|---|
| Conservative | Richard Davies | 1,603 | 18.0% | -2.2% | |
| Conservative | John Stephen Dagg | 1,478 | 16.6% | -3.0% | |
| Conservative | Norman John Vincett | 1,441 | 16.2% | -3.1% | |
| Liberal Democrats | Gillian Anne Palmer | 653 | 7.3% | +1.1% | |
| Labour | Jeremy Eastaugh | 634 | 7.1% | +1.5% | |
| Liberal Democrats | Richard Guy Dickson | 628 | 7.1% | +1.7% | |
| Labour | Mary-Ann Stephenson | 620 | 7.0% | +1.5% | |
| Labour | Peter Joseph Shiels | 598 | 6.7% | +1.3% | |
| Liberal Democrats | Ian Fenwick | 475 | 5.3% | +0.3% | |
| Green | Pippa Austin | 442 | 5.0% | +0.4% | |
| Green | Rob van Schie | 167 | 1.9% | N/A | |
| Green | Kate Edwards-Kearney | 161 | 1.8% | N/A | |
| Majority | 125 | 1.4% | +0.8 | ||
| Turnout | |||||
| Conservative hold | Swing | ||||
| Conservative hold | Swing | ||||
| Conservative hold | Swing | ||||
Lapworth
| Party | Candidate | Votes | % | ±% | |
|---|---|---|---|---|---|
| Conservative | Leslie Caborn | 980 | 82.0% | -0.6% | |
| Green | James Christopher Myles Alty | 215 | 18.0% | +0.6% | |
| Majority | 765 | 64.0% | -0.6% | ||
| Turnout | |||||
| Conservative hold | Swing | ||||
Leamington Brunswick
| Party | Candidate | Votes | % | ±% | |
|---|---|---|---|---|---|
| Labour | Balvinder Gill | 994 | 15.9% | -1.3% | |
| Labour | Jane Margaret Knight | 976 | 15.6% | -0.4% | |
| Labour | Alan Wilkinson | 926 | 14.8% | -0.9% | |
| Conservative | Bob Aujla | 580 | 9.3% | +1.0% | |
| Green | Ian Davison | 545 | 8.7% | +2.4% | |
| Green | Jonathan Chilvers | 531 | 8.5% | +2.8% | |
| Green | Karen Weber | 491 | 7.9% | +3.3% | |
| Conservative | Billy Jones | 458 | 7.3% | -0.6% | |
| Conservative | Ted Needham | 399 | 6.4% | N/A | |
| Liberal Democrats | Chris Begg | 127 | 2.0% | -4.6% | |
| Liberal Democrats | Paul Andrew Gilligan | 120 | 1.9% | -4.5% | |
| Liberal Democrats | Mohammed Ahson | 101 | 1.6% | -3.6% | |
| Majority | 18 | 0.3% | -0.9% | ||
| Turnout | |||||
| Labour hold | Swing | ||||
| Labour hold | Swing | ||||
| Labour hold | Swing | ||||
Leamington Clarendon
| Party | Candidate | Votes | % | ±% | |
|---|---|---|---|---|---|
| Labour | Janice Louise Dean | 713 | 18.9% | +1.2% | |
| Labour | Jerry Weber | 661 | 17.5% | +2.0% | |
| Conservative | Peter Guy Bold | 581 | 15.4% | +1.5% | |
| Conservative | Jonny Cope | 521 | 13.8% | +0.9% | |
| Liberal Democrats | Nicole Christine Alexander | 486 | 12.9% | -2.4% | |
| Liberal Democrats | David Peter James Robertson | 372 | 9.9% | -5.1% | |
| Green | Ben Phillips | 217 | 5.8 | +0.9% | |
| Green | Clare Louise Wandless-Phillips | 150 | 4.0% | -0.8% | |
| UKIP | George Lawson | 68 | 1.8% | N/A | |
| Majority | 52 | 1.4% | -0.8% | ||
| Turnout | |||||
| Labour hold | Swing | ||||
| Labour hold | Swing | ||||
Leamington Crown
| Party | Candidate | Votes | % | ±% | |
|---|---|---|---|---|---|
| Liberal Democrats | Alan Boad | 855 | 24.9% | -7.9% | |
| Liberal Democrats | Dave Wreford-Bush | 674 | 19.6% | -8.7% | |
| Labour | Paul Stephen Gillett | 614 | 17.9% | +8.7% | |
| Labour | Andy Marshall | 581 | 16.9% | +8.9% | |
| Conservative | Alison Frances Jones | 318 | 9.3% | +0.9% | |
| Conservative | Peter Brian Phillips | 252 | 7.3% | -0.7% | |
| Green | Judith Helen Barrett | 94 | 2.7% | -0.1% | |
| Green | George James Douglas Harwick | 43 | 1.2% | -1.3% | |
| Majority | 181 | 5.3% | +0.8% | ||
| Turnout | |||||
| Liberal Democrats hold | Swing | ||||
| Liberal Democrats hold | Swing | ||||
Leamington Manor
| Party | Candidate | Votes | % | ±% | |
|---|---|---|---|---|---|
| Liberal Democrats | Eithne Marie Goode | 1,460 | 14.7% | -3.9% | |
| Liberal Democrats | Roger Charles Henry Copping | 1,392 | 14.0% | -2.9% | |
| Liberal Democrats | Cymone Katherine De-Lara-Bond | 1,267 | 12.8% | -3.8% | |
| Conservative | Timothy Michael Crockford | 1,129 | 11.4% | -0.4% | |
| Conservative | Amanda Marjorie Stevens | 1,092 | 11.0% | -0.5% | |
| Conservative | Richard Tom Raven | 1,080 | 10.9% | ±0.0% | |
| Labour | Alasdair Russell | 596 | 6.0% | +2.8% | |
| Labour | Peter John Putt | 588 | 5.9% | +2.8% | |
| Labour | Ronald Keir Stone | 536 | 5.4% | +3.0% | |
| Green | Felicity Rock | 286 | 2.9% | +0.2% | |
| Green | Chris Philpott | 285 | 2.9% | +0.7% | |
| Green | Les Dobner | 225 | 2.3% | N/A | |
| Majority | 68 | 0.7% | -1.0% | ||
| Turnout | |||||
| Liberal Democrats hold | Swing | ||||
| Liberal Democrats hold | Swing | ||||
| Liberal Democrats hold | Swing | ||||
Leamington Milverton
| Party | Candidate | Votes | % | ±% | |
|---|---|---|---|---|---|
| Liberal Democrats | Bill Gifford | 1.489 | 15.7% | -0.9% | |
| Liberal Democrats | Sidney Ellen Tyrrell | 1,167 | 12.3% | -2.0% | |
| Liberal Democrats | Nicolas Pittarello | 1,128 | 11.9% | -1.3% | |
| Conservative | Hayley Elizabeth Lockwood Grainger | 983 | 10.4% | -0.7% | |
| Conservative | Caroline Evetts | 954 | 10.1% | -0.9% | |
| Conservative | Charlie Robbins | 814 | 8.6% | -2.0% | |
| Labour | Malcolm James Fraser | 680 | 7.2% | +3.3% | |
| Labour | Roger John Fagge | 646 | 6.8% | +3.1% | |
| Labour | Colin Edgar Quinny | 600 | 6.3% | +3.1% | |
| Green | Janet Alison Alty | 455 | 4.8% | +0.5% | |
| Green | Richard Brayne | 295 | 3.1% | -1.0% | |
| Green | Bruce Simon Knight | 266 | 2.8% | -1.2% | |
| Majority | 322 | 3.4% | +1.1% | ||
| Turnout | |||||
| Liberal Democrats hold | Swing | ||||
| Liberal Democrats hold | Swing | ||||
| Liberal Democrats hold | Swing | ||||
Leamington Willes
| Party | Candidate | Votes | % | ±% | |
|---|---|---|---|---|---|
| Labour | Richard John Edwards | 1,408 | 17.6% | +3.5% | |
| Labour | Barbara Mary Weed | 1,329 | 16.6% | +3.0% | |
| Labour | John Thomas Barrott | 1,315 | 16.4% | +3.3% | |
| Conservative | Kit Long | 679 | 8.5% | -2.1% | |
| Conservative | John Leonard Peake | 654 | 8.2% | -2.3% | |
| Conservative | Sarah Windrum | 650 | 8.1% | -1.5% | |
| Green | Ayla Nickels | 424 | 5.3% | +1.1% | |
| Liberal Democrats | David Kenyon Alexander | 349 | 4.4% | -0.9% | |
| Green | Becqke Oldham | 327 | 4.1% | -0.1% | |
| Green | Susan Mary Oldham | 324 | 4.0% | ±0.0% | |
| Liberal Democrats | Sapphire Bleach | 288 | 3.6% | -1.6% | |
| Liberal Democrats | Heather Mary Calver | 271 | 3.4% | -0.5% | |
| Majority | 72 | 1.0% | +0.5% | ||
| Turnout | |||||
| Labour hold | Swing | ||||
| Labour hold | Swing | ||||
| Labour hold | Swing | ||||
Leek Wootton
| Party | Candidate | Votes | % | ±% | |
|---|---|---|---|---|---|
| Conservative | Susan Judith Gallagher | 917 | 79.5% | -4.5% | |
| Green | Janice Eleanor Austin | 121 | 10.5% | -5.5% | |
| Liberal Democrats | John Steven Wilson | 115 | 10.0% | N/A | |
| Majority | 796 | 69.0% | +1.0% | ||
| Turnout | |||||
| Conservative hold | Swing | ||||
Radford Semele
| Party | Candidate | Votes | % | ±% | |
|---|---|---|---|---|---|
| Conservative | Michael Doody | 572 | 55.4% | -9.4% | |
| Labour | Kevin Walsh | 223 | 21.6% | +7.5% | |
| Independent | Kate Pittel | 136 | 13.2% | N/A | |
| Green | Dave Steele | 101 | 9.8% | +0.8% | |
| Majority | 349 | 33.8% | -16.9% | ||
| Turnout | |||||
| Conservative hold | Swing | ||||
Stoneleigh
| Party | Candidate | Votes | % | ±% | |
|---|---|---|---|---|---|
| Independent | Bertie MacKay | 426 | 38.9% | -45.7% | |
| Conservative | Nick Harrington | 414 | 37.8% | N/A | |
| Green | Tony Ross | 256 | 23.4% | +8.0% | |
| Majority | 12 | 1.1% | -68.1% | ||
| Turnout | |||||
| Independent hold | Swing | ||||
Warwick North
| Party | Candidate | Votes | % | ±% | |
|---|---|---|---|---|---|
| Conservative | Stephen Paul Cross | 1,301 | 16.0% | +1.4% | |
| Conservative | Moira-Ann Grainger | 1,266 | 15.6% | +1.5% | |
| Conservative | Glenn Michael Williams | 1,116 | 13.7% | +0.1% | |
| Labour | Maureen Anne Ethel Hooper | 938 | 11.6% | -2.8% | |
| Labour | Sue Griffith | 933 | 11.5% | -2.5% | |
| Labour | Roger William Smith | 869 | 10.7% | -2.6% | |
| Green | Denny Reader | 451 | 5.6% | +1.5% | |
| Green | John Francis Liddamore | 432 | 5.3% | +2.0% | |
| Green | Laura Vesty | 401 | 4.9% | N/A | |
| UKIP | Martin MacKenzie | 231 | 2.8% | N/A | |
| UKIP | Ian James Tyres | 186 | 2.3% | N/A | |
| Majority | 35 | 0.4% | +0.2% | ||
| Turnout | |||||
| Conservative hold | Swing | ||||
| Conservative gain from Labour | Swing | ||||
| Conservative hold | Swing | ||||
Warwick South
| Party | Candidate | Votes | % | ±% | |
|---|---|---|---|---|---|
| Conservative | Linda Bromley | 1,884 | 17.9% | -1.1% | |
| Conservative | Anne Monica Mellor | 1,809 | 17.2% | -1.7% | |
| Conservative | Gerry Guest | 1,782 | 16.9% | -1.9% | |
| Labour | Ian Christopher Clarke | 1,047 | 9.9% | +3.0% | |
| Labour | Joanne Humphreys | 982 | 9.3% | +2.8% | |
| Labour | Cheryl Anne Flanagan | 949 | 9.0% | +2.6% | |
| Green | Juliet Anne Nickels | 480 | 4.6% | -0.2% | |
| Liberal Democrats | Deborah Jane Pittarello | 375 | 3.6% | -1.4% | |
| Liberal Democrats | William Dylan Spedding | 345 | 3.3% | -1.5% | |
| Green | Juliet Carter | 343 | 3.3% | -1.1% | |
| Green | David Gareth John Cumner | 301 | 2.9% | N/A | |
| Liberal Democrats | Derek James Turpin | 235 | 2.2% | -2.3% | |
| Majority | 75 | 0.7% | +0.6% | ||
| Turnout | |||||
| Conservative hold | Swing | ||||
| Conservative hold | Swing | ||||
| Conservative hold | Swing | ||||
Warwick West
| Party | Candidate | Votes | % | ±% | |
|---|---|---|---|---|---|
| Conservative | Elizabeth Higgins | 1,427 | 14.5% | -0.8% | |
| Conservative | Michael John Kinson | 1,415 | 14.3% | ±0.0% | |
| Conservative | Bob Dhillon | 1,406 | 14.2% | +0.2% | |
| Labour | John Holland | 1,376 | 13.9% | +1.1% | |
| Labour | Rebecca Elizabeth Clarke | 1,300 | 13.2% | +0.7% | |
| Labour | Catherine Anne Stephens | 1,163 | 11.8% | -0.2% | |
| Liberal Democrats | Alan Charles Beddow | 399 | 4.0% | -0.5% | |
| Green | Alison Jane Browne | 350 | 3.6% | -0.8% | |
| Liberal Democrats | Geoffrey Stewart Harris | 300 | 3.0% | -0.5% | |
| Liberal Democrats | Robert Hooper | 282 | 2.9% | -0.2% | |
| Green | Graham Browne | 229 | 2.3% | -1.3% | |
| Green | Suzi Caunce | 222 | 2.2% | N/A | |
| Majority | 12 | 0.2% | -0.8% | ||
| Turnout | |||||
| Conservative hold | Swing | ||||
| Conservative hold | Swing | ||||
| Conservative hold | Swing | ||||
Whitnash
| Party | Candidate | Votes | % | ±% | |
|---|---|---|---|---|---|
| Whitnash Residents | Bernard Kirton | 1,875 | 23.7% | -3.5% | |
| Whitnash Residents | Tony Heath | 1,577 | 19.9% | -3.8% | |
| Whitnash Residents | Judy Falp | 1,550 | 19.6% | -3.2% | |
| Labour | Roger Duclaud-Williams | 594 | 7.5% | -1.0% | |
| Labour | Michael George Wincott | 529 | 6.7% | -0.1% | |
| Conservative | Sandra Christine Butler | 427 | 5.4% | N/A | |
| Labour | Baris Yerli | 406 | 5.1% | -1.4% | |
| Conservative | Christine Brenda Cross | 393 | 5.0% | N/A | |
| Green | Jim Berreen | 393 | 2.7% | -1.9% | |
| Green | Sue Tucker | 193 | 2.4% | N/A | |
| Green | Rebecca Elizabeth Knight | 158 | 2.0% | N/A | |
| Majority | 298 | 3.8% | +0.3% | ||
| Turnout | |||||
| Whitnash Residents hold | Swing | ||||
| Whitnash Residents hold | Swing | ||||
| Whitnash Residents hold | Swing | ||||
References
- ^ "Elections results". Warwick District Council. Archived from the original on 24 January 2024. Retrieved 24 January 2024.