
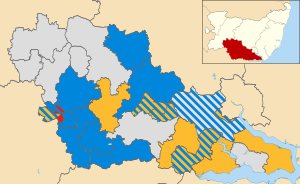
The 2011 Babergh Council election took place on 5 May 2011 to elect members of Babergh District Council in Suffolk, England. The whole council was up for election and the council stayed under no overall control.[1]
YouTube Encyclopedic
-
1/1Views:403
-
Wealth Creation and the Coalition | Adam Smith Institute
Transcription
Background
The previous election in 2007 saw no party win a majority, with the Conservatives being the largest party.[2] Labour won no seats at the election, but recovered one seat when Tony Bavington gained a seat back in a 2010 by-election in Great Cornard.[3] A further change in composition came in March 2010 when councillor Dean Walton defected to the Green Party from the Conservatives, but sat as an independent on Babergh Council.[4]
A total of 122 candidates were nominated for the 43 seats being contested, which was reported to be a record for an election to Babergh Council, and up from 78 at the 2003 election and 87 in 2007.[5] These were comprised on 34 Conservatives, 31 Labour, 27 Liberal Democrats, 14 United Kingdom Independence Party, 1 Green Party and 15 candidates from no party.[5] The 31 candidates from Labour was a record for the party in Babergh,[6] while the Liberal Democrat leader on Suffolk County Council, Kathy Pollard, was among the Liberal Democrat candidates.[3]
Election result
The results saw the council remain under no overall control, with the Conservatives staying as the largest party on 18 seats.[2] The Liberal Democrats dropped to 12 seats, while Labour increased from the 1 seat they had held after a by-election gain to 3 seats.[2]
Individual results included an independent gain from the Conservatives in Lavenham, Liberal Democrat Kathy Pollard winning a place back on the council after 16 years, while author and Labour candidate Nicci Gerrard lost in South Cosford, coming third with 187 votes.[2]
| Party | Seats | Gains | Losses | Net gain/loss | Seats % | Votes % | Votes | +/− | |
|---|---|---|---|---|---|---|---|---|---|
| Conservative | 18 | 4 | 3 | +1 | 41.9 | 38.6 | 17,691 | +2.0% | |
| Liberal Democrats | 12 | 1 | 4 | -3 | 27.9 | 23.6 | 10,787 | -17.8% | |
| Independent | 10 | 1 | 1 | 0 | 23.3 | 15.4 | 7,046 | +3.7% | |
| Labour | 3 | 2 | 0 | +2 | 7.0 | 17.0 | 7,776 | +10.6% | |
| UKIP | 0 | 0 | 0 | 0 | 0 | 4.5 | 2,048 | +0.5% | |
| Green | 0 | 0 | 0 | 0 | 0 | 0.9 | 428 | +0.9% | |
2 Liberal Democrat and 1 Independent candidates were unopposed.
Ward results
| Party | Candidate | Votes | % | ±% | |
|---|---|---|---|---|---|
| Liberal Democrats | Anthony Ward | 902 | |||
| Liberal Democrats | David Wood | 823 | |||
| Conservative | Christopher Chambers | 503 | |||
| Conservative | Patricia Cave | 396 | |||
| Labour | Keith Rawlings | 231 | |||
| Labour | Carol Tilbury | 219 | |||
| Turnout | 3,074 | ||||
| Liberal Democrats hold | Swing | ||||
| Liberal Democrats hold | Swing | ||||
| Party | Candidate | Votes | % | ±% | |
|---|---|---|---|---|---|
| Liberal Democrats | Mackenzie Deacon | unopposed | |||
| Liberal Democrats | Charles Roberts | unopposed | |||
| Liberal Democrats hold | Swing | ||||
| Liberal Democrats hold | Swing | ||||
| Party | Candidate | Votes | % | ±% | |
|---|---|---|---|---|---|
| Liberal Democrats | Bryn Hurren | 695 | 65.6 | -3.1 | |
| Conservative | Tasia Kavvadias | 365 | 34.4 | +3.1 | |
| Majority | 330 | 31.1 | -6.3 | ||
| Turnout | 1,060 | ||||
| Liberal Democrats hold | Swing | ||||
| Party | Candidate | Votes | % | ±% | |
|---|---|---|---|---|---|
| Conservative | Desmond Keane | 434 | 50.3 | -12.7 | |
| Green | Robert Lindsay | 428 | 49.7 | +12.7 | |
| Majority | 6 | 0.7 | -25.3 | ||
| Turnout | 862 | ||||
| Conservative hold | Swing | ||||
| Party | Candidate | Votes | % | ±% | |
|---|---|---|---|---|---|
| Conservative | Nicholas Ridley | 721 | |||
| Independent | Peter Jones | 598 | |||
| Liberal Democrats | Gloria Wallace | 562 | |||
| Conservative | Barry Gasper | 555 | |||
| Labour | Emma Cookson | 264 | |||
| Turnout | 2,700 | ||||
| Conservative hold | Swing | ||||
| Independent hold | Swing | ||||
| Party | Candidate | Votes | % | ±% | |
|---|---|---|---|---|---|
| Conservative | Peter Holbrook | 585 | 82.0 | ||
| Labour | Iain Scott | 128 | 18.0 | ||
| Majority | 457 | 64.0 | |||
| Turnout | 713 | ||||
| Conservative hold | Swing | ||||
| Party | Candidate | Votes | % | ±% | |
|---|---|---|---|---|---|
| Independent | James Long | 792 | 89.7 | ||
| Labour | John Finnigan | 91 | 10.3 | ||
| Majority | 701 | 79.4 | |||
| Turnout | 883 | ||||
| Independent hold | Swing | ||||
| Party | Candidate | Votes | % | ±% | |
|---|---|---|---|---|---|
| Conservative | Alan Hinton | 792 | |||
| Liberal Democrats | Michael Bamford | 495 | |||
| Liberal Democrats | Michael Miller | 451 | |||
| Independent | Clive Totman | 354 | |||
| Labour | Joy Harrison | 262 | |||
| Labour | Emma Nordon | 174 | |||
| Turnout | 2,528 | ||||
| Conservative hold | Swing | ||||
| Liberal Democrats hold | Swing | ||||
| Party | Candidate | Votes | % | ±% | |
|---|---|---|---|---|---|
| Independent | Rex Thake | 694 | |||
| Independent | Leonard Young | 611 | |||
| Conservative | David Burch | 397 | |||
| Labour | Heath Brown | 203 | |||
| Labour | David Hayes | 183 | |||
| Turnout | 2,088 | ||||
| Independent hold | Swing | ||||
| Independent hold | Swing | ||||
| Party | Candidate | Votes | % | ±% | |
|---|---|---|---|---|---|
| Labour | Anthony Bavington | 508 | |||
| Labour | Neil Macmaster | 432 | |||
| Conservative | Nicholas Antill | 387 | |||
| UKIP | Derek Allen | 248 | |||
| Liberal Democrats | Marion Press | 229 | |||
| UKIP | Cynthia Allen | 207 | |||
| Turnout | 2,011 | ||||
| Labour hold | Swing | ||||
| Labour gain from Conservative | Swing | ||||
| Party | Candidate | Votes | % | ±% | |
|---|---|---|---|---|---|
| Conservative | Peter Beer | 464 | |||
| Conservative | Mark Newman | 426 | |||
| Labour | Todd Bellaris | 210 | |||
| Independent | Anthony Harman | 205 | |||
| Labour | Robert Porter | 205 | |||
| Independent | Thomas Keane | 170 | |||
| Liberal Democrats | Richard Platt | 158 | |||
| Liberal Democrats | Catherine Press | 134 | |||
| Turnout | 1,972 | ||||
| Conservative hold | Swing | ||||
| Conservative hold | Swing | ||||
| Party | Candidate | Votes | % | ±% | |
|---|---|---|---|---|---|
| Conservative | Brian Riley | 595 | |||
| Liberal Democrats | Mary Munson | 448 | |||
| Liberal Democrats | Richard Whiting | 367 | |||
| Labour | Angela Wiltshire | 247 | |||
| Labour | David Westwood | 233 | |||
| UKIP | Reginald Smith | 215 | |||
| Turnout | 2,105 | ||||
| Conservative hold | Swing | ||||
| Liberal Democrats hold | Swing | ||||
| Party | Candidate | Votes | % | ±% | |
|---|---|---|---|---|---|
| Liberal Democrats | David Grutchfield | 659 | |||
| Conservative | Kathryn Grandon-White | 508 | |||
| Liberal Democrats | Peter Matthews | 380 | |||
| Labour | Susan Monks | 204 | |||
| Independent | David Cooper | 186 | |||
| Labour | Stephen Cockerton | 158 | |||
| UKIP | John Smith | 66 | |||
| UKIP | Josephine Smith | 57 | |||
| Turnout | 2,218 | ||||
| Liberal Democrats hold | Swing | ||||
| Conservative gain from Liberal Democrats | Swing | ||||
| Party | Candidate | Votes | % | ±% | |
|---|---|---|---|---|---|
| Independent | David Rose | unopposed | |||
| Independent hold | Swing | ||||
| Party | Candidate | Votes | % | ±% | |
|---|---|---|---|---|---|
| Independent | Andrea Norman | 411 | 50.3 | ||
| Conservative | Philip Gibson | 337 | 41.2 | ||
| Labour | James Coleman | 69 | 8.4 | ||
| Majority | 74 | 9.1 | |||
| Turnout | 817 | ||||
| Independent gain from Conservative | Swing | ||||
| Party | Candidate | Votes | % | ±% | |
|---|---|---|---|---|---|
| Conservative | Jennifer Jenkins | 648 | 77.7 | +10.0 | |
| Labour | Andrew Jameson | 186 | 22.3 | +22.3 | |
| Majority | 462 | 55.4 | +9.8 | ||
| Turnout | 834 | ||||
| Conservative hold | Swing | ||||
| Party | Candidate | Votes | % | ±% | |
|---|---|---|---|---|---|
| Independent | Richard Kemp | 1,089 | |||
| Independent | John Nunn | 743 | |||
| Conservative | William Shropshire | 474 | |||
| Conservative | Margaret Maybury | 419 | |||
| Labour | Susan Bishop | 153 | |||
| Turnout | 2,878 | ||||
| Independent hold | Swing | ||||
| Independent hold | Swing | ||||
| Party | Candidate | Votes | % | ±% | |
|---|---|---|---|---|---|
| Independent | Susan Wigglesworth | 592 | 60.3 | -22.8 | |
| Conservative | John Ward | 390 | 39.7 | +39.7 | |
| Majority | 202 | 20.6 | -45.6 | ||
| Turnout | 982 | ||||
| Independent hold | Swing | ||||
| Party | Candidate | Votes | % | ±% | |
|---|---|---|---|---|---|
| Liberal Democrats | Susan Carpendale | 819 | |||
| Liberal Democrats | Anne Pollard | 808 | |||
| Conservative | Gerald White | 766 | |||
| Conservative | Theresa Bloomfield | 671 | |||
| Labour | Susan Thomas | 228 | |||
| UKIP | Richard Hudson-Smith | 112 | |||
| UKIP | Christopher Streatfield | 108 | |||
| Turnout | 3,512 | ||||
| Liberal Democrats hold | Swing | ||||
| Liberal Democrats gain from Conservative | Swing | ||||
| Party | Candidate | Votes | % | ±% | |
|---|---|---|---|---|---|
| Conservative | John Cave | 498 | 57.3 | +3.5 | |
| Labour | William Kennedy | 160 | 18.4 | +18.4 | |
| UKIP | James Carver | 123 | 14.2 | +3.5 | |
| Liberal Democrats | Michael Breeze | 88 | 10.1 | -25.5 | |
| Majority | 338 | 38.9 | +20.7 | ||
| Turnout | 869 | ||||
| Conservative hold | Swing | ||||
| Party | Candidate | Votes | % | ±% | |
|---|---|---|---|---|---|
| Independent | Clive Arthey | 601 | 59.2 | -4.3 | |
| Conservative | Brian Tora | 288 | 28.3 | -8.2 | |
| Labour | Gerald Gould | 127 | 12.5 | +12.5 | |
| Majority | 313 | 30.8 | +3.8 | ||
| Turnout | 1,016 | ||||
| Independent hold | Swing | ||||
| Party | Candidate | Votes | % | ±% | |
|---|---|---|---|---|---|
| Conservative | Peter Burgoyne | 423 | |||
| Liberal Democrats | David Busby | 418 | |||
| Labour | David Plowman | 400 | |||
| Liberal Democrats | Leonard Johnson | 336 | |||
| Conservative | Susan Powell | 327 | |||
| Turnout | 1,904 | ||||
| Conservative gain from Liberal Democrats | Swing | ||||
| Liberal Democrats hold | Swing | ||||
| Party | Candidate | Votes | % | ±% | |
|---|---|---|---|---|---|
| Conservative | Dawn Kendall | 492 | 48.8 | +7.8 | |
| Liberal Democrats | Brian Lazenby | 330 | 32.7 | -26.3 | |
| Labour | Nicola Gerrard | 187 | 18.5 | +18.5 | |
| Majority | 162 | 16.1 | |||
| Turnout | 1,009 | ||||
| Conservative gain from Liberal Democrats | Swing | ||||
| Party | Candidate | Votes | % | ±% | |
|---|---|---|---|---|---|
| Conservative | Adrian Osborne | 500 | |||
| Labour | Jack Owen | 479 | |||
| Conservative | Janice Osborne | 476 | |||
| Labour | Russell Smith | 392 | |||
| Liberal Democrats | Emma Hewett | 153 | |||
| UKIP | Susan Smith | 137 | |||
| UKIP | Donald Martin | 133 | |||
| Liberal Democrats | Oliver Forder | 99 | |||
| Turnout | 2,369 | ||||
| Conservative hold | Swing | ||||
| Labour gain from Independent | Swing | ||||
| Party | Candidate | Votes | % | ±% | |
|---|---|---|---|---|---|
| Conservative | John Sayers | 690 | |||
| Conservative | Raymond Smith | 537 | |||
| Labour | Joanne Connah | 405 | |||
| Labour | Ian Pointon | 370 | |||
| Liberal Democrats | Andrew Welsh | 277 | |||
| Turnout | 2,279 | ||||
| Conservative hold | Swing | ||||
| Conservative hold | Swing | ||||
| Party | Candidate | Votes | % | ±% | |
|---|---|---|---|---|---|
| Liberal Democrats | Nigel Bennett | 508 | |||
| Conservative | Simon Barrett | 371 | |||
| Conservative | Peter Goodchild | 364 | |||
| Liberal Democrats | Martyn Booth | 337 | |||
| Labour | Luke Cresswell | 336 | |||
| Labour | Michael Cornish | 332 | |||
| UKIP | Jane Martin | 132 | |||
| UKIP | Christine Wardrop | 107 | |||
| Turnout | 2,487 | ||||
| Liberal Democrats hold | Swing | ||||
| Conservative gain from Liberal Democrats | Swing | ||||
| Party | Candidate | Votes | % | ±% | |
|---|---|---|---|---|---|
| Conservative | Jennifer Antill | 1,068 | |||
| Conservative | Frank Lawrenson | 824 | |||
| Liberal Democrats | Alan Scott | 311 | |||
| UKIP | Robert Armstrong | 228 | |||
| UKIP | Leon Stedman | 175 | |||
| Turnout | 2,606 | ||||
| Conservative hold | Swing | ||||
| Conservative hold | Swing | ||||
References
- ^ "England council elections". BBC News Online. Archived from the original on 19 May 2011. Retrieved 10 June 2011.
- ^ a b c d "Babergh: No overall control for district council as Lib Dems lose out". Evening Star. 6 May 2011. Retrieved 11 June 2011.
- ^ a b Geater, Paul (7 April 2011). "Labour hoping for rural breakthrough". East Anglian Daily Times. Retrieved 11 June 2011.
- ^ "Councillor Quits Blues for Greens". Green Party. 24 March 2010. Retrieved 11 June 2011.
- ^ a b "Babergh elections: More candidates than ever before, the fewest uncontested seats and a reminder about postal voting". Babergh District Council. 5 April 2011. Archived from the original on 22 July 2011. Retrieved 11 June 2011.
- ^ McGurran, Deborah (4 April 2011). "The strength of Labour's slate". BBC News Online. Retrieved 11 June 2011.
- ^ a b c d e f g h i j k l m n o p q r s t u v w x y z aa ab "Result of Poll - 5 May 2011". Babergh District Council. Archived from the original on 22 July 2011. Retrieved 10 June 2011.
- ^ "Election results 2011: English council summary results". The Guardian. 6 May 2011. Retrieved 11 June 2011.
| Suffolk County Council | |
|---|---|
| Babergh District Council | |
| East Suffolk District Council | |
| Ipswich Borough Council | |
| Mid Suffolk District Council | |
| West Suffolk District Council | |
| East Suffolk County Council |
|
| Forest Heath District Council | |
| St Edmundsbury Borough Council | |
| Suffolk Coastal District Council | |
| Waveney District Council | |
| West Suffolk County Council |
|
| |