
| 2011–12 North American winter | |
|---|---|
 Temperature map of the United States on an unusually warm winter day, January 31, 2012 | |
| Seasonal boundaries | |
| Meteorological winter | December 1 – February 29 |
| Astronomical winter | December 21 – March 20[a] |
| First event started | October 27, 2011 |
| Last event concluded | January 21, 2012 |
| Most notable event | |
| Name | 2011 Halloween nor'easter |
| • Duration | October 28–November 1, 2011 |
| Seasonal statistics | |
| Maximum snowfall accumulation | 32 in (81 cm) (Peru, Massachusetts) |
| Total fatalities | 43-49 total |
| Total damage | Unknown |
The 2011–12 North American winter by and large saw above normal average temperatures across North America, with the Contiguous United States encountering its fourth-warmest winter on record, along with an unusually low number of significant winter precipitation events. The primary outlier was Alaska, parts of which experienced their coldest January on record.[1][2]
While there is no well-agreed-upon date used to indicate the start of winter in the Northern Hemisphere, there are two definitions of winter which may be used. Based on the astronomical definition, winter begins at the winter solstice, which in 2011 occurred late on December 21 (early on December 22 in EST), and ends at the March equinox, which in 2012 occurred on March 20 (March 19 in CDT and EDT).[3] Based on the meteorological definition, the first day of winter is December 1 and the last day February 29.[4] Both definitions involve a period of approximately three months, with some variability.
YouTube Encyclopedic
-
1/5Views:1 329 88595768 391398 184611
-
Mechanism of The Seasons
-
Hellroaring Canyon: Archaic Astronomical Rock Art Site
-
The Earth Is Wobbling: The Precession of the Equinoxes
-
2012 DNA CHANGE MAYAN CALENDER NEW CYCLE EVOLUTION CROP CIRCLE HOPE LOVE
-
Tonight's Sky - January 2012
Transcription
Seasonal forecasts
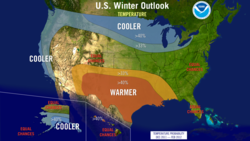

On October 20, 2011, the National Oceanic and Atmospheric Administration's Climate Prediction Center issued its U.S. Winter Outlook. The outlook expected the present La Niña to persist and intensify into the winter, resulting in drier than normal conditions in the drought-stricken states of New Mexico, Oklahoma, Texas, and parts of adjacent states. The CPC noted the significance of the less-predictable Arctic Oscillation, with CPC deputy director Mike Halpert saying, "The erratic Arctic Oscillation can generate strong shifts in the climate patterns that could overwhelm or amplify La Niña's typical impacts." The outlook was broken up into ten regions. The outlook anticipated above-normal wildfire conditions across the entire southern part of the United States, cooler and wetter-than-average conditions in the Pacific Northwest and western Montana, likewise for northern California, and drier-than-average conditions for southern California. Colder and wetter-than-average conditions were favored in the Northern Plains, but the converse was expected to occur in the Southern Plains and Gulf Coast states, worsening pre-existing drought conditions. In Florida and the southern Atlantic states, equal chances existed for below, near, and above-average temperatures, with below-average precipitation favored for the region and above-normal wildfire conditions. Equal chances for below, near, and above-average temperatures existed in the Ohio and Tennessee Valleys, with wetter-than-average conditions favored, resulting in an enhanced potential for storms and flooding. Equal chances for below, near, and above-average precipitation and temperatures existed in the Northeast and Mid-Atlantic states. The outlook noted that winter weather in this region often driven by the Arctic Oscillation rather than La Niña, and as such, if enough cold air and moisture were to coalesce, areas north of the Ohio Valley and into the Northeastern U.S. could expect above-average snowfall. Colder and wetter-than-average conditions were favored in the Great Lakes region, and above-average temperatures with above-average precipitation were favored in the western islands of Hawaii, resulting in the potential for elimination of drought, particularly in Kauai and Oahu. The outlook ended by noting chances favoring below-average temperatures in the southern half of Alaska and the panhandle with below-average levels of precipitation favored in the eastern interior region of the state.[5]
On 4 January the lowest temperature of the winter was measured in Alaska: -56.6°C January was Alaska’s coldest since January 1965.
Seasonal summary

The 2011–12 winter opened with a nor'easter striking parts of the Mid-Atlantic and Northeastern United States in late October. The storm brought significant snowfall totals to much of the region, with some areas experiencing gale-force winds. Some areas between northeastern Pennsylvania and southern Maine received over 12 inches (30 cm) of snow, and parts of Massachusetts and New Hampshire received over 30 inches (76 cm) of snow. Many trees were downed because they had not yet lost their leaves, resulting in downed power lines and more than 3,000,000 residents losing power, some of whom remained without power for over a week following the storm. The storm ultimately resulted in one direct fatality and $18.8 million in damage.[6] Slightly over a week later, an intense extratropical cyclone—one of the strongest to strike the west coast of the state since 1974—brought high winds and flooding to Alaska. On November 8, a low initially crossed from the southern Aleutian Islands to near Gulf of Anadyr while intensifying. The low then weakened as it crossed the Chukchi Peninsula the following day. Gale-to-hurricane-force winds[7][8] combined with snow to create blizzard conditions across much of northern and western Alaska, and storm-induced flooding caused at least an estimated $24 million in damage. Some locations experienced water levels several feet above the normal.[9][8] One fatality was recorded before the storm's associated low entered the Chukchi Sea late on November 9, continuing to weaken as it moved off to the northwest and ceased to affect Alaska.[8] In late November, another storm affected the United States, bringing snow to the central Mississippi Valley. The storm ultimately dropped a few inches of snow across parts of Arkansas and Missouri in the central Mississippi River Valley before advancing into the Ohio Valley where it brought rain and snow to Lower Michigan and northern Indiana. Although the storm logged no casualties, it did cause thousands of dollars in flood damage to portions of Arkansas and Kentucky. Another system materialized in mid-December; it brought heavy snow, which in some cases combined with high winds to create blizzard conditions, to northeastern New Mexico and southeastern Colorado. Along the eastern end of the snow, precipitation transitioned to a wintry mix resulting in hazardous road conditions in central and south-central Kansas. The storm did not result in any known casualties, but it did cause over $50 thousand in damage in New Mexico.[6]

Mid-January saw the Pacific Northwest significantly affected by winter weather, with a storm bringing some of the coldest air to affect the region since winter began. Accompanying the cold air were snow showers across western parts of Washington and Oregon; heavy snows affected the coastal mountains of the region, with lesser snows affecting the Seattle area. As the precipitation receded in the Pacific Northwest, cold air associated with the system went on to pervade the Rocky Mountains and central Great Basin, with heavy snow later returning to the coastal mountains in the Cascadia region. Snow totals in the Seattle and Olympia areas as well as the Blue Mountains and parts of the Rockies reached near-record-breaking levels. Snow in western Washington transitioned into freezing rain, resulting in a historic ice storm event, with heavy snows expanding into Northern California and the Rockies, including the Tetons and the northern Wasatch Range. Cold air and snow spread into the Northern Plains, and high winds affected areas in and just east of the Rockies. Widespread rain fell along the coasts of Northern California and Oregon. The storm left three dead and four injured in its wake due to a combination of flooding and fallen trees. This storm was to be followed by another storm in early February. The major winter storm, originating from a disturbance in the subtropical jet stream, brought snow to parts of Kansas and south-central Nebraska, with cold air drawn in from the north. Areas to the east in the Middle Mississippi Valley were warmer and saw rain instead of snow. The highest snowfall totals were reported by the National Weather Service to have occurred from an area extending south from Laramie, Wyoming to the Colorado foothills as well as an area east of Denver. The foothills saw a few reports of snow totals in excess of 36 inches (91 cm), with Black Hawk receiving 48 inches (120 cm) of accumulation. Lesser but still significant snowfall fell over parts of Nebraska from North Platte to near Omaha. Wind gusts of over 40 miles per hour (64 km/h) were observed across eastern Colorado and Nebraska. Approximately 600 flights were canceled in Denver, Colorado as a result of the storm, and due to heavy snow and strong winds, Interstate 70 was closed from Denver to the Kansas border. The storm resulted in power outages affecting 15,000 people and caused an estimated $693 thousand in damage. However, this was largely due to flooding in the Southern Plains and Lower Mississippi Valley rather than the wintry impacts to the north.[6]


Late February and early March saw another winter storm develop, impacting parts of the north-central and northeastern United States with heavy snow and blizzard conditions coupled with other forms of wintry precipitation. On February 28–29, wintry precipitation began to spread across the Upper Midwest, with winds across parts of the Central Plains through the Upper Mississippi Valley reaching 50–60 miles per hour (80–97 km/h). Simultaneously, light to moderate snow developed across parts of the Northeastern U.S., with snowfall rates decreasing into the night of February 29. However, snow redeveloped by the following morning, with snowfall finally coming to an end shortly thereafter. The storm's most-significant impacts were observed across the Upper Midwest, with numerous power outages occurring in tandem with the closure of roads, schools, and businesses. Interstates 29 and 90 were temporarily closed due to unsafe weather conditions, and accidents on state highways were reported to number in the hundreds. The only fatality reported to have occurred due to the storm occurred in Minnesota, with the death being attributed to exposure to extremely cold temperatures. Despite damage reports from the storm totaling $741 thousand, the storm alleviated some of the pre-existing drought conditions in the north-central U.S. A late-season storm brought precipitation to an area extending from North Carolina to Maine on April 22, with moderate to heavy rain falling along the coast and a secondary area of precipitation being observed farther inland. The highest precipitation totals were observed in northeastern Pennsylvania and central New York. Enough cold air was brought into place by the storm so as to allow for snow to fall in the higher elevations of the central Appalachians on April 23. The storm took a northwestward turn as it weakened, permeating a substantive distance into Quebec by 00:00 UTC April 24. Much of the initially impacted area between North Carolina and Maine observed rainfall totals in excess of one inch (2.5 cm), with totals locally nearing five inches (12.7 cm) across parts of New England. Parts of the central Appalachians received over four inches (10.2 cm) of snow, with portions of western New York and central Pennsylvania reporting over 12 inches (30 cm) of snow. During its lifetime, the storm complicated travel along the Interstate-95 corridor, and travel was made especially hazardous along coastal New England. Thousands of power outages were reported, but no direct casualties occurred. The storm caused a reported $206 thousand in damages, largely due to snow and wind.[6]
Events
There were multiple events during the 2011–12 North American winter. Significant events include cold waves, snowstorms, and other notable events outside the conventional limits of winter.
Halloween nor'easter

In the days preceding Halloween, a snowstorm affected parts of the mid-Atlantic and the northeastern United States. The storm formed as a strong upper-level shortwave became negatively tilted as it traveled across the Ohio Valley and a rapidly intensifying surface low located off the Carolina coast traveled northward. Precipitation, brought on by the advection of warm air to the north and east of the developing surface low, began to fall early on the morning of October 29 across the mid-Atlantic states. Early on, snow was limited to more interior regions at higher elevations. As the surface low continued its trek northward, winds backed from northeasterly to northwesterly across much of the mid-Atlantic region, allowing cold air to be advected southeastward. This ultimately resulted in the transition of rain to snow in the foothills of Maryland, Pennsylvania, and Virginia, with dynamic cooling likely increasing the rate at which this transition occurred across the area. In New England, the initiation of precipitation across the area took place by midday October 29; due to the preexistence of cold air across inland portions of the region, save coastal areas, precipitation fell as snow from the start. WPC analysis indicated the surface low was located off the coast of New Jersey with a minimum barometric pressure of 993 hPa (mbar; 29.33 inHg) at 00:00 UTC on October 30. As it traveled northward and intensified, it brought wind gusts of over 50 miles per hour (80 km/h) to the New England coast, with a peak gust of 69 miles per hour (111 km/h) recorded in Nantucket, Massachusetts. The low ultimately attained its absolute lowest pressure of 976 hPa (mbar; 28.82 inHg) at 15:00 UTC on October 30 east of the southern tip of Nova Scotia. An area spanning the distance between northeastern Pennsylvania and southern Maine saw snowfall totals of greater than 12 inches (30 cm), with parts of both New Hampshire and Massachusetts seeing totals in excess of 30 inches (76 cm).[6][10]

At the time of the storm, trees across much of the affected area had not yet lost their leaves,[6] and as a result, the storm managed to down as many as many as a thousand trees in New York City's Central Park alone, which observed only its fourth snowy October day since records began 135 years earlier.[11][12] The storm also resulted in the loss of power for more than three million people, with Connecticut alone seeing more than 830,000 customers lose power, a number that broke the state's previous record set by the remnants of Hurricane Irene only about two months earlier.[13] Parts of Maryland, New Jersey, New York, Pennsylvania and every state in New England were left without power, with Massachusetts and New Jersey both seeing power outage totals in excess of 600,000.[12] While the National Weather Service only reported one direct fatality, several fatalities occurred when accounting for both direct and indirect causes.[6][11][14][15] The storm caused a significant disruption to traveling both on the ground and in the air. Several planes were left stranded on a Hartford, Connecticut tarmac for hours,[6] with one flight's passengers left waiting in their plane for over seven hours. About 48 passengers on an Amtrak train bound for Boston were similarly stranded for 13 hours due to a rock slide having blocked the tracks,[15] and wintry conditions resulted in a dozen motorists north of New York City becoming stuck on highways for as many as ten hours prior to being rescued.[13] Many residents of affected areas were discouraged from traveling at all, with speed limits reduced between New Jersey and Pennsylvania.[12] Across parts of the area affected by the storm, local government officials canceled or pushed back Halloween activities for safety-related purposes,[13] and state governors declared states of emergency in Connecticut, Massachusetts, New Jersey, and parts of New York.[11][15] Thirty-two shelters were opened in Connecticut, and the state's governor asked that volunteer fire departments open their doors to people to provide warmth and showers.[12] NOAA publication Storm Data reported $18.8 million in damage due to a combination of heavy snow, high winds, and coastal flooding.[6]
November Bering Sea cyclone

The second week of November saw one of the Alaska west coast's strongest cyclones since 1974 affect the area. On November 8, the 960-millibar (hPa; 28.35 inHg) low from which the storm would later materialize traveled from its 3:00 a.m. AKST (12:00 UTC) position over the southern Aleutian Islands to near the Gulf of Anadyr by 9:00 p.m. (06:00 UTC November 9), by which time its pressure had decreased to 945 millibars (hPa; 27.91 inHg). The system then went on the cross the Chukotsk Peninsula at 9:00 a.m. (18:00 UTC) on November 9 with a pressure of 956 millibars (hPa; 28.23 inHg), weakening to a 958-millibar (hPa; 28.29-inHg) low over the Chukchi Sea by 9:00 p.m. (06:00 UTC November 10). It then translated in a northwestward direction, ultimately weakening to 975 millibars (hPa; 28.80 inHg) by 3:00 p.m. on November 10 (00:00 UTC November 11), roughly 150 miles (240 km) north of Wrangel Island.[8] During the storm, numerous areas saw winds, sometimes of hurricane-force,[7] combine with snow to create blizzard conditions. This occurred in the village of Wales, which saw winds gust as high as 77 knots (89 mph). The National Weather Service office in Nome recorded 6.4 inches (160 mm) of snows during the storm. Apart from the mainland, additional impacts were observed on the islands of St. Lawrence and Little Diomede, the latter of which observed waves estimated to be 30 feet (9.1 m) in height and was the subject of an unofficial report of a peak wind gust as high as 81 knots (93 mph).[8] One National Weather Service official compared the storm to a Category 3 hurricane.[9]
Numerous coastal areas were affected by rising waters; multiple areas saw water levels several feet above the normal low water levels. Nome in particular saw flooding comparable to storms in November 1974 and October 2004, with waters rising to about ten feet (three meters) above normal.[8][9] The city saw waves overcome its seawall; water running into wet wells at a sewer and water treatment plant were too much for the pumps, resulting in the release of 165,000 gallons of wastewater into a small boat harbor. According to the City of Nome, approximately $500,000 in damage was caused to the Cape Nome Jetty, with an additional $80,000 caused by wave action and erosion. About $24 million in damage was caused to parts of the Nome-Council Road. A vessel bound for Nome carrying the city's last scheduled delivery of fuel before winter was delayed, and sea ice quickly formed in the week after the storm, preventing the delivery from being shipped until January 2012. Large pieces of ice were brought inland by high waters in Saint Michael and Koyuk, and in the former, heavy equipment was required to remove them from a road. Winds associated with the storm brought about numerous power and phone line outages in Point Hope, and about 550 of the town's 674 residents were evacuated to a local school.[8] A 26-year-old was presumed dead after he drove his vehicle into large waves near the village of Teller.[8]
Late-November winter storm

Late November saw a storm strike with heavy rainfall across parts of the Southeast through the Ohio Valley in addition to snowfall in the central Mississippi Valley. The storm began to materialize as a north-south-oriented cold front and a high-amplitude upper-level trough collectively moved eastward across the Mississippi Valley. A strong high located off the coast of the Carolinas slowed the eastward movement of the front. From the beginning, the front was linked to an area of rainfall. Late on November 27, cyclogenesis began over the Southeast, at which point the rain swath became progressively more post-frontal. During the daytime on November 28, the cyclone rapidly occluded as it headed toward the Tennessee Valley to the north. By early November 29, cold air associated with the upper-level low started converting rain into snow in the central Mississippi Valley, an uncommon occurrence for the region at that point in the year. By the time snow stopped falling, northeastern Arkansas and southeastern Missouri had seen a few inches of snow deposited at the surface, with an accumulation of 8 inches (200 mm) reported at Paragould, Arkansas. The storm then resumed its northward trek into the Ohio Valley. Due to the quickening of the frontal rainfall across the Appalachian Mountains and the Mid-Atlantic region, areas in the eastern United States received a reduced amount of accumulated precipitation. By the time the storm had passed, peak rainfall totals had been recorded in eastern Tennessee and the southern Appalachian region, where totals of over 5 inches (130 mm) were noted. As the occluded cyclone moved northward, cold air from the northwest caused rain to transition to snow across Lower Michigan and northern Indiana on November 29 during the afternoon. A band of organization near the rear of the cyclone brought, for a limited time, heavy snow to aforementioned parts of Indiana in addition to central Lower Michigan. In excess of 6 inches (150 mm) of snow were reported in these areas, with maximum totals of near 10 inches (250 mm) in the vicinity of Peru, Indiana and Lansing, Michigan.[16]
In northern Indiana and Lower Michigan, snow caused power outages, traffic accidents, and the collapse of a gas station awning.[16] While no direct casualties were known to have occurred, a total of $25 million in damage was reported in Arkansas and Kentucky due to flooding.[6]
Mid-December winter storm

On December 19–20, a cut-off upper-level low traced a path eastward across the southwestern U.S. then northeastward toward the southern plains. Associated with the low was a snowstorm, including blizzard conditions in areas of high wind across parts of the south-central and southwestern U.S.[6] The National Weather Service issued Winter Storm and Blizzard Warnings for parts of western and central Kansas, central and northern New Mexico, southeastern Colorado, and the Oklahoma and Texas panhandles.[17] Clayton, New Mexico, saw 17.7 inches (450 mm) fall on December 19 and 20, and Lamar, Colorado measured 19.0 inches (480 mm) of snow on December 20, a new December record for one-day snowfall. Some areas affected by the system saw snow drifts in excess of 2 to 4 feet (0.61 to 1.22 m). As the system trekked to the northeast, the temperatures it encountered were more moderate, and rain became the primary mode of precipitation in Kansas through the Midwest and Mississippi Valley. On the eastern edge of the heavy snow, a rain/snow/sleet mixture created slick conditions of roads in parts of central and south-central Kansas. The system also brought 1.5 to 2.5 inches (38 to 64 mm) of rainfall to parts of south-central and southeastern Kansas.[6]
The system's greatest overall impacts were in southeastern Colorado, western Kansas, and northeastern New Mexico. These impacts manifested in the form of a snowstorm accompanied by high winds, restricted visibility, and blowing snow, which left drivers stranded, and roads were closed during the event. While no direct casualties were attributed to the system,[6] unofficial reports stated that at least six people died in traffic accidents due to poor road and visibility conditions.[17] A total of $53 thousand in damage was reported from the storm in New Mexico, where heavy snow and blizzard conditions occurred.[6]
Mid-January winter storm

During the January 14–20 period, several upper-level disturbances and an arctic outbreak occurred in the northwestern United States. The start of the period was characterized by a shortwave trough embedded in the rapid onshore flow south of an upper-level low. The shortwave proceeded to trace a path toward the southeast through the Pacific Northwest, where it played a role in bringing a cold air mass to the region. The shortwave also helped to bring snow showers to western parts of Washington and Oregon, including heavy snow in the Olympic Mountains and the Cascades, as well as lighter totals in the lower areas surrounding the Seattle-Tacoma metropolitan area. During the 12:00 UTC January 15 – 12:00 UTC January 16 period, the upper-level low and trough persisted in its inland movement, with the front of the cold air advancing southeastward through the Great Basin and Rockies. Precipitation across the Pacific Northwest region subsided early on January 16, although some light precipitation continued through the northern Rocky Mountains.
Heavy snow restarted in the region late in the day as another shortwave trough approached the coast. The shortwave, in addition to a plume of subtropical moisture and an intense upper-level jet, traversed the Pacific Northwest from January 17–18. The moisture proceeded to overrun residual cold air from the previous system, bringing heavy snow to parts of western Washington. Eleven inches of snow fell at Olympia airport and almost seven inches fell at Seattle-Tacoma International Airport on January 18, respectively becoming the third- and sixth-highest totals on record. As much as two feet of snow fell in the Oregon Coastal Range, and additional heavy snow totalling near-record-to-record levels was reported to the east across the Blue Mountains in eastern Oregon and the Sawtooth and Bitterroot Ranges into the northern Rocky Mountains. As the system progressed eastward from 12:00 UTC January 18 – 12:00 UTC January 19, the low-level cold air over western Washington was backed up by continuing precipitation and surface flow from the north. This paved the way for the eventual freezing rain event that affected the region, including its first-ever ice storm warning. Ice accumulations ranging from one-half to three-quarters of an inch were reported in the vicinity of the Seattle-Tacoma metropolitan area, with totals of an inch or higher being reported in areas south and east. Heavy snow falling along the Cascade Range expanded southward into northern California and along the Rockies into the Tetons and northern Wasatch Mountains. An arctic surface high settled south through the northern Plains with the front amassing against the eastern slopes of the northern Rockies. High winds with gusts of up to 100 mph were reported across and east of the mountains. The systems affected much of the northwestern U.S. with rain, snow, and ice, with snow blanketing areas from the Pacific Northwest to the northern Plains. By 12:00 UTC January 20, snowfall ranging between 2 and 5 feet had been reported across the Cascade Range with the heaviest amounts focused near the Mount Hood area. Widespread totals of 1 to 3 feet of snow were recorded in the northern Rockies, with the highest totals falling along the Sawtooth Range, where 3-to-6-foot totals were frequent, with reports ranging as high as 70 inches. Widespread rain of 3-to-6 inches with local totals as high as 9 inches occurred along the coast of northern California, and totals as high as 15 inches were reported along the coast of Oregon. Ice accumulations of one-quarter to one inch were reported across the Columbia River Gorge east of Portland with similar totals across the Seattle-Tacoma metropolitan area.[6]
Notes
- ^ Astronomical winter began early on December 22 in Eastern Standard Time and ended late on March 19 in Central/Eastern Daylight Time.
References
- ^ State of the Climate: National Overview for January 2012 (Report). NOAA National Centers for Environmental Information. February 2012.
- ^ State of the Climate: Global Analysis for February 2012 (Report). NOAA National Centers for Environmental Information. March 2012.
- ^ "Earth's Seasons: Equinoxes, Solstices, Perihelion, and Aphelion" (PHP). Washington, D.C.: United States Naval Observatory. September 21, 2015. Archived from the original on 2015-08-31. Retrieved April 15, 2016.
- ^ "Meteorological vs. Astronomical Seasons". NOAA National Centers for Environmental Information. June 21, 2013. Retrieved April 5, 2016.
- ^ "U.S. dealt another La Niña winter but 'wild card' could trump it". National Oceanic and Atmospheric Administration. October 20, 2011. Archived from the original on February 5, 2016. Retrieved April 17, 2016.
- ^ a b c d e f g h i j k l m n o Ryan, Michael S.; Gerhardt, Mary Beth; Hamrick, David; Kocin, Paul J.; Kong, Kwan-Yin; Otto, Richard; Pereira, Frank J.; Rubin-Oster, Brendon. Major Winter Weather Events during the 2011-2012 Cold Season (PDF) (Report). College Park, Maryland: NOAA/NWS/Weather Prediction Center. Retrieved April 17, 2016.
- ^ a b "Snow, hurricane-force winds batter Alaska coast". CBS News. Associated Press. November 10, 2011. Retrieved June 1, 2016.
- ^ a b c d e f g h Storm Data and Unusual Weather Phenomena with Late Reports and Corrections (PDF). Storm Data (Report). Vol. 53. National Climatic Data Center. November 2011. pp. 9–22. Archived from the original (PDF) on 2012-08-14. Retrieved June 1, 2016.
- ^ a b c Hopkins, Kyle; Grove, Casey; Dunham, Mike (November 9, 2011). "Alaskans weather epic Bering Sea storm". Alaska Dispatch News. Retrieved June 1, 2016.
- ^ Ryan, Sean. Historic Autumn Mid-Atlantic to Northeast U.S. Winter Storm (PDF) (Report). College Park, Maryland: NOAA/NWS/Weather Prediction Center. Retrieved April 17, 2016.
- ^ a b c Barnard, Anne; Nir, Sarah Maslin (October 10, 2011). "Cleaning Up After Nature Plays a Trick". The New York Times. Retrieved June 16, 2016.
- ^ a b c d "Freak nor'easter storm blamed for 11 deaths". CBS News. Associated Press. October 30, 2011. Retrieved June 18, 2016.
- ^ a b c "Northeast slowly digs out from under heavy, wet snow after early storm". Advance Digital. Associated Press. October 31, 2011. Retrieved June 18, 2016.
- ^ "Death toll from storm rises to 10". Journal Inquirer. November 11, 2011. Retrieved June 16, 2016.
- ^ a b c "Millions powerless as snow smacks Northeast". TODAY.com. October 30, 2011. Retrieved June 16, 2016.[permanent dead link]
- ^ a b Kong, Kwan-yin. Eastern U.S. Heavy Rain and Snow (PDF) (Report). College Park, Maryland: NOAA/NWS/Weather Prediction Center. Retrieved January 2, 2017.
- ^ a b Kocin, Paul. Major Snowstorm in New Mexico, southeast Colorado and southern Plains (PDF) (Report). College Park, Maryland: NOAA/NWS/Weather Prediction Center. Retrieved May 1, 2018.
![]() This article incorporates public domain material from websites or documents of the National Oceanic and Atmospheric Administration.
This article incorporates public domain material from websites or documents of the National Oceanic and Atmospheric Administration.
External links
- 2011 Storm Summaries from the Weather Prediction Center
- 2012 Storm Summaries from the Weather Prediction Center
- Major Winter Weather Events during the 2011-2012 Cold Season (WPC)