
| |||
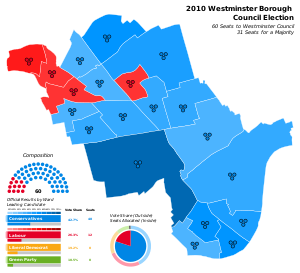
All 60 council seats of the Westminster City Council 31 seats needed for a majority | |||
|---|---|---|---|
|
| |||
| |||
Elections for the City of Westminster London borough were held on 6 May 2010. The 2010 general election and other local elections took place on the same day.
In London council elections the entire council is elected every four years, as opposed to some local elections, in which one councillor is elected every year for three of the four years.
The Conservatives retained control of the council, and all wards continued with the same party representation as at the previous borough election in 2006. Labour won back the Church Street seat they had lost to the Conservatives at a 2008 by-election.
Summary of results
| Party | Seats | Gains | Losses | Net gain/loss | Seats % | Votes % | Votes | +/− | |
|---|---|---|---|---|---|---|---|---|---|
| Conservative | 48 | 0 | 1 | 0 | 80.0 | 42.7 | 36,929 | ||
| Labour | 12 | 1 | 0 | 0 | 20.0 | 26.3 | 22,742 | ||
| Liberal Democrats | 0 | 0 | 0 | 0 | 0.0 | 19.2 | 16,613 | ||
| Green | 0 | 0 | 0 | 0 | 0.0 | 10.5 | 9,122 | ||
| UKIP | 0 | 0 | 0 | 0 | 0.0 | 0.7 | 635 | ||
| Independent | 0 | 0 | 0 | 0 | 0.0 | 0.5 | 394 | ||
| English Democrat | 0 | 0 | 0 | 0 | 0.0 | 0.1 | 107 | ||
Ward results
The percentage of vote share and majority are based on the average for each party's votes in each ward. The raw majority number is the margin of votes between the lowest-placed winning party candidate and the opposition party's highest-placed losing candidate. Starred candidates are the incumbents.
Abbey Road
Bayswater
Bryanston and Dorset Square
Church Street
Churchill
Harrow Road
Hyde Park
Knightsbridge and Belgravia
Lancaster Gate
Little Venice
Maida Vale
Marylebone High Street
Queen's Park
Regent's Park
St James's
Tachbrook
Vincent Square
Warwick
West End
Westbourne
References
- ^ Teale, Andrew. "2010 - Westminster". Local Elections Archive Project. Retrieved 5 June 2021.