
| |||||||||||||||||||||||||||||||||||||||||||||||||||||||||||||||||||||||
All 40 Welsh seats to the House of Commons | |||||||||||||||||||||||||||||||||||||||||||||||||||||||||||||||||||||||
|---|---|---|---|---|---|---|---|---|---|---|---|---|---|---|---|---|---|---|---|---|---|---|---|---|---|---|---|---|---|---|---|---|---|---|---|---|---|---|---|---|---|---|---|---|---|---|---|---|---|---|---|---|---|---|---|---|---|---|---|---|---|---|---|---|---|---|---|---|---|---|---|
| |||||||||||||||||||||||||||||||||||||||||||||||||||||||||||||||||||||||
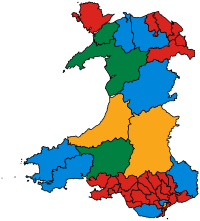 Colours on map indicate winning party for each constituency †Notional 2005 results on new boundaries. *Owing to electoral boundaries changing, this figure is notional. | |||||||||||||||||||||||||||||||||||||||||||||||||||||||||||||||||||||||


These are the results of the 2010 United Kingdom general election in Wales. The election was held on 6 May 2010, and all 40 parliamentary seats in Wales were contested. The Labour Party remained the party with the most seats in Wales, however it suffered a net loss of 4 seats and its share of the vote dropped by 6.5%. The Conservatives increased their number of seats by 5 and the Liberal Democrats and Plaid Cymru saw little change both in the number of seats and share of the vote.
Despite the Labour party winning the most votes in Wales, the Conservatives won across the UK.[2]
YouTube Encyclopedic
-
1/5Views:1 48622 0563911 041538
-
Understanding the 2017 UK General Election
-
The General Election of 2010 - Professor Vernon Bogdanor
-
2019 General Election Briefing from The Wales Governance Centre
-
What is 1997 United Kingdom general election?, Explain 1997 United Kingdom general election
-
2019 Welsh European Election Briefing
Transcription
Results
| Party | Seats | Votes | |||||||
|---|---|---|---|---|---|---|---|---|---|
| Total | Gains | Losses | Net +/- | % seats | Total | % | Change | ||
| Labour | 26 | 1 | 5 | 65.0 | 531,601 | 36.2 | |||
| Conservative | 8 | 5 | 0 | 20.0 | 382,730 | 26.1 | |||
| Liberal Democrats | 3 | 0 | 1 | 7.5 | 295,164 | 20.1 | |||
| Plaid Cymru | 3 | 1 | 0 | 7.5 | 165,394 | 11.3 | |||
| UKIP | 0 | 0 | 0 | 0 | — | 35,690 | 2.4 | ||
| BNP | 0 | 0 | 0 | 0 | — | 23,088 | 1.6 | ||
| Green | 0 | 0 | 0 | 0 | — | 6,293 | 0.4 | ||
| Christian | 0 | 0 | 0 | 0 | — | 1,947 | 0.1 | N/A | |
| TUSC | 0 | 0 | 0 | 0 | — | 341 | 0.0 | N/A | |
| Others | 0 | 0 | 1 | — | 24,442 | 1.7 | |||
| Total | 40 | 1,466,690 | 64.9 | ||||||
References
- ^ "Election 2010 | Results | Wales". BBC News. Retrieved 4 February 2021.
- ^ "UK Election Statistics: 1918-2022, A Long Century of Elections" (PDF). House of Commons Library. p. 22.
| Senedd elections | |
|---|---|
| UK elections |
|
| Local elections | |
| Referendums | |