
| ||||||||||||||||||||||||||||||||||||||||||||||||||||||
All 67 seats to Nottinghamshire County Council 34 seats needed for a majority | ||||||||||||||||||||||||||||||||||||||||||||||||||||||
|---|---|---|---|---|---|---|---|---|---|---|---|---|---|---|---|---|---|---|---|---|---|---|---|---|---|---|---|---|---|---|---|---|---|---|---|---|---|---|---|---|---|---|---|---|---|---|---|---|---|---|---|---|---|---|
| ||||||||||||||||||||||||||||||||||||||||||||||||||||||
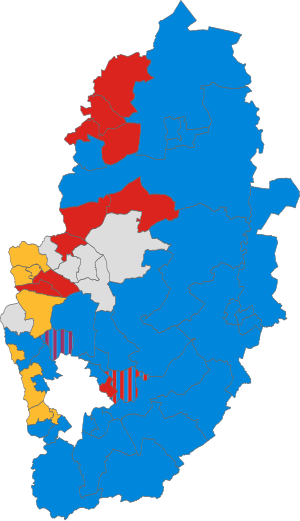 Map of the results of the election coloured by victorious party | ||||||||||||||||||||||||||||||||||||||||||||||||||||||
| ||||||||||||||||||||||||||||||||||||||||||||||||||||||
Elections to Nottinghamshire County Council took place on 4 June 2009, having been delayed from 7 May, in order to coincide with elections to the European Parliament.
In the previous election, held on 5 May 2005, the Labour Party won a majority with 36 out of 67 seats. The Conservative Party were second with 26 seats, and the Liberal Democrats had five.[1] Following the 2005 election, there were three by-elections, which all saw swings against Labour. The Conservatives gained Hucknall and the Liberal Democrats Sutton-in-Ashfield North from Labour, and the Labour Party's majority in Mansfield East was reduced by nearly two-thirds.[2]
YouTube Encyclopedic
-
1/5Views:6 0102 4841 78346916 034
-
Into the Community from Orchard Hill Hospital
-
WTVH 11pm News, June 11, 2009
-
Part 1 - WE Gladstone - The grand old man in Nottinghamshire - M.P. for Newark, 1832-46
-
Part 2 - WE Gladstone - The Grand Old Man in Nottinghamshire - County Connections, 1846-98
-
Using Google for Search and Research
Transcription
- Orchard Hill Hospital was an NHS establishment for long-term care for people with learning disabilities profound learning disabilities and some of those disabilities were of a multiple basis. There were some enquiries that took place which did reference there was institutional abuse at Orchard Hill. So that's why in 2009, the council took over the responsibility for commissioning the services for residents in Orchard Hill. So we needed to actually act quickly, decisively. And that's what we did. - Glynis was born in '56 and she developed meningitis at a very early age. Which has then resulted in the brain damage and learning disability that Glynis now has. She is a typical woman. She loves to shop. She loves nice pretty things. She likes a lot of pink. She likes a lot of frills. Her house is very very important. From the day we arrived here and she was given her keys it was a blank canvas. There was no furniture. And the minute they told her it was her home, she knew it was her home. And when I took her back to Orchard Hill for the next week before she moved in, all she asked me everyday was 'go home?' 'go home?' - Tell me about the nice things that you've bought here. I did it, home! € - When she was younger, she did talk a lot. But unfortunately being the hospital environment that vocabulary wasn't being used But she now actually says sentences to me. She actually will use those words now, in sentences like "Put the laundry away." - Here's your handbag Glynis. There you go. - Shall we turn the light off? - Yes. - My name's Jill Flack. And I'm 66... my age. I've got a big family. I'm an aunty. I've got Jeanie, Joanie, Rita, Rosie....Pat, Audrey. I've got quite a bit family. Then I've got Dennis, Peter, Raymond, Ruby, Michael... - What did you think when you first walked in and saw this flat? I thought it was lovely when I saw it. I liked my bedroom as well. - What do you family think about your new place here. They like it. They like the flat. It's a lovely flat. - You must be really please with it, what you've done? - Yes Here look there's Paul. - Do you think he likes you? I think so because Madelina came down the other day and said Paul was asking about me, saying 'where's Jill?'. - So you always liked cooking? - Yes, I peel potatoes - Do you like potatoes? Do you like eating potatoes? - Yes I do. And I like eating vegetables as well. My Friday favourite dinner is fish and chips on a Friday. I don't mind how long I take as long as I do them, you know. It can't be a fast job because I don't want to cut myself, do I. - When I first came to work with Glynis her whole bedroom was yellow. Everything was yellow and that was what was written in her care plans and her PCP's. Glynis loves the colour yellow. So when we went shopping for here, I really expected everything to be yellow or in shades of yellow. But in going around the shops and B&Q, I then discovered that she actually picked the pinks and the purples, and the reds, but called them yellow. It turns out that the only colour Glynis knows to say is the colour yellow. - That mine! - Is that your one? Do you like that? - Yes! Yellow. - No that's not yellow, it's pink and purple. - Look! - This one? Big flowers. - No, no. - No, you don't like that one? Not at all? - Yeah! Yes! - Yes? Yes. - Do you like that? Does it feel nice? - Yes....[laughs] - When Dennis was 8 he had a very serious accident on his bicycle. And because of his injuries and the amount of care that he needed, he had to move into Orchard Hill. Dennis lived up at Orchard Hill for a period of about 35 years. At Orchard Hill he tended to be kind of parked in front of a tv. He didn't really seem to do a lot. But now that people have got their own flats, and individual support they seem to do an awful lot more. They get a chance to actually be out and about and be part of the community much much more. He goes out to the Victoria and Albert Museum. He goes to an art group on Wednesday, along with Jeanette who lives here with him. And he gets to meet lots and lots of people there. He's very much a people person. He likes getting out and about and meeting people. I'd say he goes out about 5 times more than he used to now. In terms of actually getting out and about into the community at large, he has a much greater opportunity to do that now. When I get ready to go to the bank, I make sure my purse is in my trolley. When I go the bank, I get my blue card out. And I show the people at the desk, and they ask me how much and I tell them. Then I sign for it. Yes, I do that. - There's lots of people at Orchard Hill who were petrified of her coming here. Even staff that had known her longer than me. This wasn't going to work for her. How would she cope with roads? And she just blossomed. Her personality blossomed. Her abilities just all came out of themselves. And the day that her passport arrived was amazing. And she was so excited when she opened it on her photo and she showed everybody. And she asked to put it in her handbag and I said the words "this is a really important document, we have to put it in a very safe place. We need to put it in your safe". And she went straight to where her safe is, but she actually opened the cupboard - she didn't know the combination - but she pressed buttons and I almost cried. I was absolutely in awe that none of us knew she was capable of all of that. I saw Glynis for the first time, I think, is a fair thing to say. Now I think it is her choices and when she makes it clear what she wants or doesn't want it is now listened to. There I've done that one. - But now that Dennis has his own flat and he has a sofa bed, which was bought specially for the purpose if his mum comes, if she needs to she can actually come and stay over, and he's obviously very very pleased to see her. I like being here because I'm happy.
Campaign
A key local issue was the planned extension of the Nottingham Express Transit tram system to Clifton and Toton, which was opposed by the Conservatives.[3]
Results by District
Nottinghamshire County Council is made up of 67 seats in a total of 54 electoral divisions across 7 districts: Ashfield District, Bassetlaw District, Broxtowe Borough, Gedling Borough, Mansfield District, Newark & Sherwood District, and Rushcliffe Borough.[4]
Ashfield District
(10 seats, 8 electoral divisions)
Hucknall
| Party | Candidate | Votes | % | |
|---|---|---|---|---|
| Conservative | Mick Murphy | 2,690 | 11.06 | |
| UKIP | Tom Irvine | 2,541 | 10.45 | |
| Conservative | Kevin Thomas Rostance | 2,519 | 10.36 | |
| Conservative | Robert Rankin | 2,498 | 10.27 | |
| Labour | Chris Baron | 2,393 | 9.84 | |
| Labour | Dave Shaw | 2,258 | 9.29 | |
| Labour | Trev Locke | 2,213 | 9.10 | |
| UKIP | Kenneth Browne | 1,204 | 4.95 | |
| UKIP | Mark Brinsley-Day | 1,202 | 4.94 | |
| Liberal Democrats | Kevin Moore | 1,125 | 4.63 | |
| Liberal Democrats | Harry Toseland | 1,058 | 4.35 | |
| BNP | Susan Carolyn Gamble | 905 | 3.72 | |
| Liberal Democrats | Austin Rathe | 881 | 3.62 | |
| English Democrat | Kevin Michael Worrall | 602 | 2.48 | |
| Independent | Geoff Thorpe | 223 | 0.92 | |
| Turnout | 8,104 | 34.07 | ||
Kirkby in Ashfield North
| Party | Candidate | Votes | % | |
|---|---|---|---|---|
| Labour | John Russell Knight | 842 | 26.38 | |
| BNP | Michael John Clarke | 722 | 22.62 | |
| Independent | Wendy Brenda Harvey | 597 | 18.70 | |
| Conservative | James Grant Thornton | 445 | 13.94 | |
| Liberal Democrats | Melvin William Grant | 412 | 12.91 | |
| Independent | Dave Spalding | 174 | 5.45 | |
| Turnout | 3,192 | 31.27 | ||
Kirkby in Ashfield South
| Party | Candidate | Votes | % | |
|---|---|---|---|---|
| Liberal Democrats | Rachel Elisabeth Madden | 1,752 | 39.29 | |
| Labour | Yvonne Davidson | 868 | 19.47 | |
| Conservative | Robert Copley | 614 | 13.77 | |
| BNP | Darran Paul Burke | 482 | 10.81 | |
| English Democrat | Tony Ellis | 295 | 6.62 | |
| Green | Lisa Jane Brown | 257 | 5.76 | |
| Independent | Tony Brown | 191 | 4.28 | |
| Turnout | 4,459 | 40.39 | ||
Selston
| Party | Candidate | Votes | % | |
|---|---|---|---|---|
| Independent | Gail Turner | 1,593 | 36.68 | |
| Liberal Democrats | Robert James Sears-Piccavey | 1,037 | 23.88 | |
| BNP | Edward Holmes | 734 | 16.90 | |
| Labour | Stephen John Mays | 557 | 12.83 | |
| Conservative | Brian William Jarvis | 343 | 7.90 | |
| Green | Kevin Bradford | 79 | 1.82 | |
| Turnout | 4,343 | 43.40 | ||
Sutton in Ashfield Central
| Party | Candidate | Votes | % | |
|---|---|---|---|---|
| Liberal Democrats | Michelle Gent | 801 | 29.64 | |
| Labour | Edward David Walter Llewellyn-Jones | 696 | 25.76 | |
| Conservative | Christine Margaret Vernon | 384 | 14.21 | |
| BNP | Jane Helen Clarke | 347 | 12.84 | |
| Independent | Leslie Matthews | 276 | 10.21 | |
| Independent | Tony Johnson | 198 | 7.33 | |
| Turnout | 2,702 | 31.26 | ||
Sutton in Ashfield East
| Party | Candidate | Votes | % | |
|---|---|---|---|---|
| Labour | Steven Terence Carroll | 772 | 27.32 | |
| Liberal Democrats | Philip Ashley Smith | 628 | 22.22 | |
| Conservative | John Matson Baker | 426 | 15.07 | |
| Independent | Tony Wallis | 401 | 14.19 | |
| Independent | David Michael Parker | 300 | 10.62 | |
| BNP | Paul Jeffrey Gamble | 299 | 10.58 | |
| Turnout | 2,826 | 32.05 | ||
Sutton in Ashfield North
| Party | Candidate | Votes | % | |
|---|---|---|---|---|
| Liberal Democrats | Jason Bernard Zadrozny | 1,038 | 35.40 | |
| Labour | Trish Phillips | 738 | 25.17 | |
| Conservative | Michael Peter Laing Halls | 562 | 19.17 | |
| BNP | Michael John Clarke | 418 | 14.26 | |
| Turnout | 2,932 | 34.32 | ||
Sutton in Ashfield West
| Party | Candidate | Votes | % | |
|---|---|---|---|---|
| Liberal Democrats | Fiona Asbury | 1,066 | 36.48 | |
| Labour | David John Kirkham | 758 | 25.94 | |
| Conservative | Michael Maurice Champion | 522 | 17.86 | |
| BNP | Hilda Holmes | 382 | 13.07 | |
| Turnout | 2,922 | 32.98 | ||
Bassetlaw District
(9 seats, 9 electoral divisions)
Blyth & Harworth
| Party | Candidate | Votes | % | |
|---|---|---|---|---|
| Labour | Sheila Janice Place | 1,663 | 52.71 | |
| Conservative | Chris Wanless | 1,492 | 47.29 | |
| Turnout | 3,226 | 34.13 | ||
Misterton
| Party | Candidate | Votes | % | |
|---|---|---|---|---|
| Conservative | Liz Yates | 3,321 | 76.45 | |
| Labour | David Challinor | 1,023 | 23.55 | |
| Turnout | 4,477 | 42.52 | ||
Retford East
| Party | Candidate | Votes | % | |
|---|---|---|---|---|
| Conservative | Wendy Quigley | 1,933 | 62.05 | |
| Labour | Mick Storey | 1,182 | 37.95 | |
| Turnout | 3,182 | 37.30 | ||
Retford West
| Party | Candidate | Votes | % | |
|---|---|---|---|---|
| Conservative | Mike Quigley | 1,305 | 46.26 | |
| Labour | James Trebor Arthur Napier | 942 | 33.39 | |
| Liberal Democrats | David Anthony Hassett | 574 | 20.35 | |
| Turnout | 2,853 | 34.25 | ||
Tuxford
| Party | Candidate | Votes | % | |
|---|---|---|---|---|
| Conservative | John Marshall Hempsall | 2,511 | 61.02 | |
| Liberal Democrats | Brian Sydney Cane | 910 | 22.11 | |
| Labour | Marilyn McCarthy | 694 | 16.87 | |
| Turnout | 4,179 | 44.95 | ||
Worksop East
| Party | Candidate | Votes | % | |
|---|---|---|---|---|
| Labour | Glynn Gilfoyle | 1,525 | 54.19 | |
| Independent | Geoff Coe | 762 | 27.08 | |
| Conservative | Tracey Lee Taylor | 527 | 18.73 | |
| Turnout | 2,871 | 30.64 | ||
Worksop North
| Party | Candidate | Votes | % | |
|---|---|---|---|---|
| Labour | Sybil Jacqueline Fielding | 1,711 | 54.54 | |
| Conservative | Jonathan Neil Sheppard | 1,426 | 45.46 | |
| Turnout | 3,228 | 31.38 | ||
Worksop North East & Carlton
| Party | Candidate | Votes | % | |
|---|---|---|---|---|
| Labour | Alan Rhodes | 1,669 | 51.07 | |
| Conservative | Bill Graham | 1,599 | 48.93 | |
| Turnout | 3,362 | 36.26 | ||
Worksop West
| Party | Candidate | Votes | % | |
|---|---|---|---|---|
| Conservative | Michael Bennett | 1,403 | 50.81 | |
| Labour | David Daniel Potts | 909 | 32.92 | |
| Liberal Democrats | Mark Peter Hunter | 449 | 16.26 | |
| Turnout | 2,789 | 33.27 | ||
Broxtowe Borough
(10 seats, 8 electoral divisions)
Beauvale
| Party | Candidate | Votes | % | |
|---|---|---|---|---|
| Conservative | David Taylor | 1,532 | 43.31 | |
| BNP | Dave Brown | 698 | 19.73 | |
| Liberal Democrats | Bob Charlesworth | 657 | 18.58 | |
| Labour | Jen Cole | 650 | 18.38 | |
| Turnout | 3,554 | 43.56 | ||
Beeston North
| Party | Candidate | Votes | % | |
|---|---|---|---|---|
| Liberal Democrats | Steve Carr | 2,026 | 53.12 | |
| Conservative | Philip Hopkinson | 905 | 23.73 | |
| Labour | Kate Foale | 549 | 14.39 | |
| Green | Paul David Anderson | 334 | 8.76 | |
| Turnout | 3,833 | 48.54 | ||
Beeston South & Attenborough
| Party | Candidate | Votes | % | |
|---|---|---|---|---|
| Conservative | Eric Kerry | 1,889 | 41.02 | |
| Labour | Pat Lally | 1,700 | 36.92 | |
| Liberal Democrats | Graham Morley Hopcroft | 432 | 9.38 | |
| Green | Sylvia Anne Rule | 306 | 6.64 | |
| BNP | Wayne Shelbourn | 278 | 6.04 | |
| Turnout | 4,619 | 51.16 | ||
Bramcote & Stapleford
| Party | Candidate | Votes | % | |
|---|---|---|---|---|
| Liberal Democrats | Stan Heptinstall | 3,281 | 21.03 | |
| Liberal Democrats | Brian Wombwell | 3,095 | 19.84 | |
| Conservative | John Doddy | 2,528 | 16.21 | |
| Conservative | Philip Brooks-Stephenson | 2,245 | 14.39 | |
| Labour | John William McGrath | 1,418 | 9.09 | |
| Labour | Geoff Ward | 1,119 | 7.17 | |
| UKIP | Chris Cobb | 1,013 | 6.49 | |
| Green | Emma Kathryn Fawcett | 507 | 3.25 | |
| Green | Mary Evelyn Venning | 394 | 2.53 | |
| Turnout | 7,814 | 45.49 | ||
Chilwell & Toton
| Party | Candidate | Votes | % | |
|---|---|---|---|---|
| Conservative | Tom Pettengell | 3,388 | 24.40 | |
| Conservative | Richard Ian Jackson | 3,356 | 24.17 | |
| Labour | Ed Jacobs | 1,442 | 10.39 | |
| Labour | Atul Joshi | 1,135 | 8.17 | |
| Liberal Democrats | Dave Pearson | 1,076 | 7.75 | |
| Liberal Democrats | Christine Wombwell | 998 | 7.19 | |
| UKIP | Keith Willoughby Marriott | 786 | 5.66 | |
| Green | Richard David Eddleston | 658 | 4.74 | |
| BNP | Mary Clifton | 546 | 3.93 | |
| Green | David Knight Mitchell | 500 | 3.60 | |
| Turnout | 6,769 | 42.60 | ||
Eastwood
| Party | Candidate | Votes | % | |
|---|---|---|---|---|
| Liberal Democrats | Keith Longdon | 1,539 | 49.66 | |
| Labour | Milan Radulovic | 888 | 28.65 | |
| Conservative | Graham Kilbourne | 672 | 21.68 | |
| Turnout | 3,151 | 38.26 | ||
Kimberley & Trowell
| Party | Candidate | Votes | % | |
|---|---|---|---|---|
| Liberal Democrats | Ken Rigby | 1,585 | 36.29 | |
| Conservative | Shane Easom | 1,342 | 30.73 | |
| Labour | Richard Robinson | 912 | 20.88 | |
| BNP | Kevin Lambert | 402 | 9.21 | |
| Green | Gordon Brian Stoner | 126 | 2.89 | |
| Turnout | 4,377 | 49.01 | ||
Nuthall
| Party | Candidate | Votes | % | |
|---|---|---|---|---|
| Conservative | Philip John Owen | 1,752 | 50.16 | |
| Independent | Sue Wildey | 1,741 | 49.84 | |
| Turnout | 3,526 | 45.33 | ||
Gedling Borough
(10 seats, 6 electoral divisions)
Arnold North
| Party | Candidate | Votes | % | |
|---|---|---|---|---|
| Conservative | Gerald Vincent Clarke | 3,343 | 25.50 | |
| Conservative | Veronica Caroline Pepper | 3,255 | 24.83 | |
| Labour | Pauline Annette Allan | 1,995 | 15.22 | |
| Labour | John Robert Stocks | 1,805 | 13.77 | |
| Liberal Democrats | Sandra Yvonne Thornley | 1,361 | 10.38 | |
| Liberal Democrats | Roger Mark Patterson | 1,352 | 10.31 | |
| Turnout | 6,869 | 37.09 | ||
Arnold South
| Party | Candidate | Votes | % | |
|---|---|---|---|---|
| Conservative | Rodney Gordon Kempster | 3,257 | 22.28 | |
| Conservative | Melvyn Alfred Shepherd | 2,948 | 20.17 | |
| Labour | Peter Graham Barnes | 2,210 | 15.12 | |
| Labour | Paul Richard Key | 2,044 | 13.98 | |
| Liberal Democrats | Andrew Julian Swift | 1,521 | 10.41 | |
| Liberal Democrats | Tadeusz Edward Zdzislaw Jones | 1,502 | 10.28 | |
| UKIP | Anthony Robin Ellwood | 1,135 | 7.76 | |
| Turnout | 7,793 | 41.98 | ||
Calverton
| Party | Candidate | Votes | % | |
|---|---|---|---|---|
| Conservative | Mark Spencer (British politician) | 2,229 | 70.47 | |
| Labour | Michael John Hope | 934 | 29.53 | |
| Turnout | 3,236 | 40.70 | ||
Carlton East
| Party | Candidate | Votes | % | |
|---|---|---|---|---|
| Labour | William John Clarke | 2,165 | 16.03 | |
| Conservative | Allen Malpass Clarke | 2,144 | 15.87 | |
| Labour | James O'Riordan | 2,099 | 15.54 | |
| Conservative | Cheryl Beverly Clarke | 2,035 | 15.06 | |
| Liberal Democrats | Richard James Dawson Berry | 1,960 | 14.51 | |
| Liberal Democrats | Richard Ian MacDuff Fife | 1,811 | 13.41 | |
| BNP | Stephen Arthur Adcock | 739 | 5.47 | |
| Green | Jean Katimertzis | 556 | 4.12 | |
| Turnout | 7,106 | 41.11 | ||
Carlton West
| Party | Candidate | Votes | % | |
|---|---|---|---|---|
| Labour | Seamus Martin Creamer | 2,191 | 16.76 | |
| Labour | Darrell Eduard Pulk | 2,152 | 16.47 | |
| Conservative | Thomas Lewis Butcher | 2,030 | 15.53 | |
| Conservative | Eric John Collin | 2,025 | 15.49 | |
| Liberal Democrats | Paul Anthony Hughes | 1,072 | 8.20 | |
| Liberal Democrats | Christopher Norman Fredrick William Pratt | 994 | 7.61 | |
| UKIP | Deva Indera Asanga Kumarasiri | 974 | 7.45 | |
| UKIP | Anthony Jeffrey Prior | 971 | 7.43 | |
| BNP | William Christopher Bell | 660 | 5.05 | |
| Turnout | 6,784 | 38.81 | ||
Newstead
| Party | Candidate | Votes | % | |
|---|---|---|---|---|
| Conservative | Christopher Paul Barnfather | 2,454 | 73.85 | |
| Labour | Carol Ann Wright | 869 | 26.15 | |
| Turnout | 3,323 | 42.95 | ||
Mansfield District
(9 seats, 5 electoral divisions)
Mansfield East
| Party | Candidate | Votes | % | |
|---|---|---|---|---|
| Mansfield Independent Forum | Bob Cross | 1,891 | 19.60 | |
| Mansfield Independent Forum | Martin Wright | 1,883 | 19.52 | |
| Labour | Helen Holt | 1,629 | 16.89 | |
| Conservative | Brian Marshall | 1,558 | 16.15 | |
| Labour | Chris Winterton | 1,423 | 14.75 | |
| Conservative | Muriel Ragis | 1,262 | 13.08 | |
| Turnout | 5,677 | 31.34 | ||
Mansfield North
| Party | Candidate | Votes | % | |
|---|---|---|---|---|
| Labour | Joyce Bosnjak | 1,758 | 15.93 | |
| Labour | Parry Tsimbiridis | 1,494 | 13.54 | |
| UKIP | Andrea Hamilton | 1,335 | 12.10 | |
| UKIP | David Hamilton | 1,328 | 12.04 | |
| Mansfield Independent Forum | Mick Barton | 1,033 | 9.36 | |
| Conservative | Drew Stafford | 1,007 | 9.13 | |
| Conservative | Janet Susan Ward | 908 | 8.23 | |
| Mansfield Independent Forum | David Smith | 764 | 6.92 | |
| Liberal Democrats | Veronica Moya Goddard | 756 | 6.85 | |
| Liberal Democrats | Marc Hollingworth | 651 | 5.90 | |
| Turnout | 5,787 | 32.19 | ||
Mansfield South
| Party | Candidate | Votes | % | |
|---|---|---|---|---|
| Mansfield Independent Forum | Tom Appleby | 2,043 | 17.74 | |
| Mansfield Independent Forum | Stephen Neil Garner | 1,960 | 17.02 | |
| Conservative | Nick Bennett | 1,791 | 15.55 | |
| Conservative | Philip Keith Smith | 1,483 | 12.88 | |
| Labour | Albert Haynes | 1,259 | 10.93 | |
| Labour | David Charles Harrison | 1,187 | 10.31 | |
| Liberal Democrats | Adrian Mark Bacon | 698 | 6.06 | |
| Liberal Democrats | Kristyna Adela Ellis | 610 | 5.30 | |
| English Democrat | Diane Bilgrami | 487 | 4.23 | |
| Turnout | 6,121 | 32.02 | ||
Mansfield West
| Party | Candidate | Votes | % | |
|---|---|---|---|---|
| Mansfield Independent Forum | June Stendall | 2,034 | 21.12 | |
| Mansfield Independent Forum | Vic Bobo | 1,675 | 17.40 | |
| Labour | Paul Henshaw | 1,520 | 15.79 | |
| Labour | John Carter | 1,511 | 15.69 | |
| Conservative | Mark Stuart Fretwell | 889 | 9.23 | |
| Conservative | Fraser McFarland | 716 | 7.44 | |
| Liberal Democrats | Anna Ellis | 653 | 6.78 | |
| Liberal Democrats | Nicholas Spencer | 631 | 6.55 | |
| Turnout | 5,141 | 30.21 | ||
Warsop
| Party | Candidate | Votes | % | |
|---|---|---|---|---|
| Labour | John Allin | 1,371 | 48.50 | |
| Mansfield Independent Forum | John Milnes | 677 | 23.95 | |
| Conservative | Michael William Ward | 583 | 20.62 | |
| Liberal Democrats | Victoria Tracey Zadrozny | 196 | 6.93 | |
| Turnout | 2,846 | 30.62 | ||
Newark & Sherwood District
(10 seats, 10 electoral divisions)
Balderton
| Party | Candidate | Votes | % | |
|---|---|---|---|---|
| Conservative | Keith Walker | 1,401 | 59.11 | |
| Liberal Democrats | Neil Allen | 559 | 23.59 | |
| Labour | Carola Richards | 410 | 17.30 | |
| Turnout | 2,399 | 31.37 | ||
Blidworth
| Party | Candidate | Votes | % | |
|---|---|---|---|---|
| Independent | Geoff Merry | 852 | 34.68 | |
| Labour | Yvonne Woodhead | 802 | 32.64 | |
| Conservative | Rod Allen | 496 | 20.19 | |
| Independent | Kevan Wakefield | 307 | 12.49 | |
| Turnout | 2,468 | 32.69 | ||
Collingham
| Party | Candidate | Votes | % | |
|---|---|---|---|---|
| Conservative | Vincent Henry Dobson | 2,160 | 61.98 | |
| Liberal Democrats | Marylyn Rayner | 1,325 | 38.02 | |
| Turnout | 3,550 | 36.70 | ||
Farndom & Muskham
| Party | Candidate | Votes | % | |
|---|---|---|---|---|
| Conservative | Sue Saddington | 2,178 | 68.86 | |
| Liberal Democrats | Antony Barson | 657 | 20.77 | |
| Labour | Brian James Howes | 328 | 10.37 | |
| Turnout | 3183 | 47.61 | ||
Farnsfield & Lowdham
| Party | Candidate | Votes | % | |
|---|---|---|---|---|
| Conservative | Andy Stewart | 3,333 | 79.13 | |
| Labour | Celia Brooks | 879 | 20.87 | |
| Turnout | 4,302 | 50.06 | ||
Newark East
| Party | Candidate | Votes | % | |
|---|---|---|---|---|
| Conservative | Peter David Prebble | 1,267 | 51.63 | |
| Liberal Democrats | Chris Harrison | 746 | 30.40 | |
| Labour | John Bell | 441 | 17.97 | |
| Turnout | 2,483 | 31.52 | ||
Newark West
| Party | Candidate | Votes | % | |
|---|---|---|---|---|
| Conservative | Keith Frank Girling | 980 | 42.61 | |
| Independent | Gill Dawn | 483 | 21.00 | |
| Labour | Ian Wallace Campbell | 450 | 19.57 | |
| Liberal Democrats | Declan Patrick Logue | 387 | 16.83 | |
| Turnout | 2,313 | 32.16 | ||
Ollerton & Boughton
| Party | Candidate | Votes | % | |
|---|---|---|---|---|
| Labour | Stella Marie Smedley | 1,202 | 40.61 | |
| Conservative | Mary Brown | 1,042 | 35.20 | |
| Independent | Mick McLelland | 716 | 24.19 | |
| Turnout | 2,980 | 34.24 | ||
Rufford
| Party | Candidate | Votes | % | |
|---|---|---|---|---|
| Independent | Les Ward | 1,309 | 35.60 | |
| Conservative | Mike Butler | 1,259 | 34.24 | |
| Labour | Andrew Freeman | 1,109 | 30.16 | |
| Turnout | 3,718 | 37.07 | ||
Southwell & Caunton
| Party | Candidate | Votes | % | |
|---|---|---|---|---|
| Conservative | Bruce Laughton | 2,765 | 52.06 | |
| Liberal Democrats | Peter Richard Bloomfield Harris | 2,281 | 42.95 | |
| Labour | Glenn Bardill | 265 | 4.99 | |
| Turnout | 5,350 | 56.00 | ||
Rushcliffe Borough
(9 seats, 8 electoral divisions)
Bingham
| Party | Candidate | Votes | % | |
|---|---|---|---|---|
| Conservative | Martin William Suthers | 2,020 | 48.71 | |
| Liberal Democrats | George Davidson | 1,207 | 29.11 | |
| Independent | Terry Coleman | 510 | 12.30 | |
| Labour | Alan Richard Tiplady | 410 | 9.89 | |
| Turnout | 4,166 | 43.92 | ||
Cotgrave
| Party | Candidate | Votes | % | |
|---|---|---|---|---|
| Conservative | Richard Langton Butler | 1,807 | 53.05 | |
| Labour | Andrew William Clayworth | 522 | 15.33 | |
| Liberal Democrats | Diane Jean Rotherham | 387 | 11.36 | |
| UKIP | Rach Wolfe | 367 | 10.78 | |
| BNP | Tony Woodward | 323 | 9.48 | |
| Turnout | 3,420 | 40.21 | ||
Keyworth
| Party | Candidate | Votes | % | |
|---|---|---|---|---|
| Conservative | John Elliott Cottee | 2,484 | 56.11 | |
| Liberal Democrats | Debbie Boote | 1,313 | 29.66 | |
| Green | Tony Latham | 371 | 8.38 | |
| Labour | Richard Theodore Parry Crawley | 259 | 5.85 | |
| Turnout | 4,454 | 53.17 | ||
Radcliffe on Trent
| Party | Candidate | Votes | % | |
|---|---|---|---|---|
| Conservative | Kay Cutts | 2,724 | 58.77 | |
| Labour | Steve Collins | 784 | 16.91 | |
| Liberal Democrats | Susan Jennifer Hull | 613 | 13.23 | |
| Green | Andrew Peter Mattison | 514 | 11.09 | |
| Turnout | 4,665 | 48.33 | ||
Ruddington
| Party | Candidate | Votes | % | |
|---|---|---|---|---|
| Conservative | Reg Adair | 1,918 | 48.68 | |
| Liberal Democrats | Barbara Venes | 981 | 24.90 | |
| Labour | Ian Paul Wilson | 403 | 10.23 | |
| UKIP | Pete Wolfe | 398 | 10.10 | |
| Independent | David John Hall | 240 | 6.09 | |
| Turnout | 3,957 | 45.55 | ||
Soar Valley
| Party | Candidate | Votes | % | |
|---|---|---|---|---|
| Conservative | Lynn Sykes | 2,502 | 59.60 | |
| Liberal Democrats | Sheila Ann Gauld | 885 | 21.08 | |
| Labour | Paul David Morrissey | 811 | 19.32 | |
| Turnout | 4,262 | 45.82 | ||
West Bridgford Central & South
| Party | Candidate | Votes | % | |
|---|---|---|---|---|
| Conservative | Michael John Cox | 3,432 | 20.14 | |
| Conservative | Barrie Cooper | 3,401 | 19.96 | |
| Green | Sue Mallender | 1,787 | 10.49 | |
| Green | Richard Mallender | 1,616 | 9.48 | |
| Labour | Liz Plant | 1,578 | 9.26 | |
| Labour | Alistair MacInnes | 1,563 | 9.17 | |
| Liberal Democrats | Keith Michael Jamieson | 1,223 | 7.18 | |
| Liberal Democrats | Steve Travis | 1,217 | 7.14 | |
| UKIP | Matthew Eric Faithfull | 623 | 3.66 | |
| Turnout | 8,820 | 43.25 | ||
West Bridgford West
| Party | Candidate | Votes | % | |
|---|---|---|---|---|
| Conservative | Gordon Wheeler | 2,189 | 44.58 | |
| Liberal Democrats | Karrar Ahmad Khan | 1,597 | 32.53 | |
| Labour | Peter Joseph Vallelly | 545 | 11.10 | |
| Green | Simon Ronald Anthony | 311 | 6.33 | |
| English Democrat | Barrie Michael Worrall | 268 | 5.46 | |
| Turnout | 4,926 | 50.31 | ||
By-Elections between June 2009 – April 2013
By-elections are called when a representative Councillor resigns or dies, so are unpredictable. A by-election is held to fill a political office that has become vacant between the scheduled elections.
1. Newark East - 17 September 2009
| Party | Candidate | Votes | % | ±% | |
|---|---|---|---|---|---|
| Conservative | Stuart Wallace | 517 | 45.2 | -6.4 | |
| Liberal Democrats | Chris Harrison | 322 | 28.1 | -2.3 | |
| Labour | Glenn Bardill | 198 | 17.3 | -0.7 | |
| UKIP | Terry Coleman | 107 | 9.4 | +9.4 | |
| Majority | 195 | 17.1 | |||
| Turnout | 1,144 | 15.6 | |||
| Conservative hold | Swing | ||||
2. Mansfield South - 25 February 2010
| Party | Candidate | Votes | % | ±% | |
|---|---|---|---|---|---|
| Labour | Chris Winterton | 1,342 | 33.5 | +13.4 | |
| Mansfield Independent Forum | Andrew Tristram | 1,108 | 27.6 | -12.7 | |
| Conservative | Drew Stafford | 774 | 19.3 | -9.2 | |
| UKIP | Nick Bennet | 489 | 12.2 | +12.2 | |
| Liberal Democrats | Danielle Gent | 295 | 7.4 | -3.8 | |
| Majority | 234 | 5.9 | |||
| Turnout | 4,008 | 20.9 | |||
| Labour gain from Independent | Swing | ||||
3. Worksop West - 16 September 2010
| Party | Candidate | Votes | % | ±% | |
|---|---|---|---|---|---|
| Labour | Kevin Maurizio Greaves | 1,457 | 61.5% | ||
| Conservative | Alec Thorpe | 755 | 31.9% | ||
| Liberal Democrats | Leon Maurice Duveen | 88 | 3.7% | ||
| Independent | Ronald Dawes | 56 | 2.4% | ||
| Independent | Terry George Coleman | 13 | 0.6% | ||
| Majority | 702 | ||||
| Turnout | 2,369 | ||||
| Labour gain from Conservative | Swing | ||||
4. Chilwell & Toton - 15 March 2012
| Party | Candidate | Votes | % | ±% | |
|---|---|---|---|---|---|
| Conservative | John Doddy | 1,958 | 47.7 | +5.9 | |
| Liberal Democrats | David Watts | 1,375 | 33.5 | +20.6 | |
| UKIP | Lee Waters | 682 | 16.6 | +7.0 | |
| Majority | 583 | 14.2 | |||
| Turnout | 4,102 | 25.6 | |||
| Conservative hold | Swing | ||||
5. Rufford - 20 September 2012
| Party | Candidate | Votes | % | ±% | |
|---|---|---|---|---|---|
| Labour | John Peck | 1,557 | 58.0 | +27.8 | |
| Conservative | Daniel Mottishaw | 660 | 24.6 | -9.7 | |
| Nottinghamshire Independents | Jim Gregson | 346 | 12.9 | -22.7 | |
| UKIP | Carole Terzza | 123 | 4.6 | +4.6 | |
| Majority | 897 | 33.4 | |||
| Turnout | 2,686 | 24.52 | |||
| Labour gain from Independent | Swing | ||||
References
- ^ Nottinghamshire County Council, 2005 Election Results
- ^ Battle for your vote starts in key marginals, Nottingham Evening Post, 2009-05-14
- ^ The day before Notts' election, Nottingham Evening Post, 2009-06-03
- ^ "Electoral Division results". Nottinghamshire County Council. Retrieved 6 November 2010.
- ^ "Newark East by-election result". Nottinghamshire County Council. 18 September 2009. Retrieved 25 September 2009.
- ^ a b "Mansfield South by-election result". Nottinghamshire County Council. 26 February 2010. Retrieved 26 February 2010.