
| |||||||||||||||||||||||||||||||||||||
12 out of 37 seats to Worthing Borough Council 19 seats needed for a majority | |||||||||||||||||||||||||||||||||||||
|---|---|---|---|---|---|---|---|---|---|---|---|---|---|---|---|---|---|---|---|---|---|---|---|---|---|---|---|---|---|---|---|---|---|---|---|---|---|
| |||||||||||||||||||||||||||||||||||||
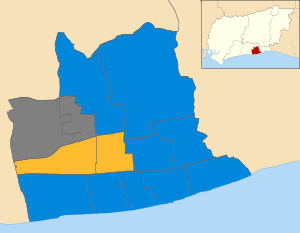 Map of the results of the 2007 Worthing council election. Conservatives in blue and Liberal Democrats in yellow. Wards in grey were not contested in 2007. | |||||||||||||||||||||||||||||||||||||
| |||||||||||||||||||||||||||||||||||||
The 2007 Worthing Borough Council election took place on 3 May 2007 to elect members of Worthing Borough Council in West Sussex, England. One third of the council was up for election and the Conservative Party stayed in overall control of the council.[1]
Candidates from the Conservatives, Liberal Democrats, Green Party, Labour and the United Kingdom Independence Party stood in the election.[2] There was also one candidate, Dawn Smith, standing as a "Stop Durrington's Overdevelopment - Save Titnore's Trees" candidate as a protest against plans to build 875 houses near Worthing.[3]
The Liberal Democrats had been hoping to gain three seats,[2] but the results saw the Conservatives gain one seat from the Liberal Democrats to strengthen their majority on the council.[4] The Liberal Democrat defeat came by 12 votes in Selden ward where their candidate James Doyle was upset over the Conservatives using the description "Conservative, Stop Hospital Cuts" on the ballot paper.[5] Conservative Kevin Skepper retained his seat in Broadwater, which he had previously won as a Liberal Democrat before defecting to the Conservatives.[5] This was the first time since 1975 that a Conservative had won in Broadwater.[5] Meanwhile, in Castle ward the Liberal Democrats held both the seats in Castle ward after 3 recounts.[5] Overall voter turnout in the election was 35.41%.[6]
After the election, the composition of the council was:
Election result
| Party | Seats | Gains | Losses | Net gain/loss | Seats % | Votes % | Votes | +/− | |
|---|---|---|---|---|---|---|---|---|---|
| Conservative | 9 | 1 | 0 | +1 | 75.0 | 52.4 | 14,189 | +0.2% | |
| Liberal Democrats | 3 | 0 | 1 | -1 | 25.0 | 32.6 | 8,829 | -6.1% | |
| UKIP | 0 | 0 | 0 | 0 | 0 | 5.5 | 1,478 | +2.9% | |
| Labour | 0 | 0 | 0 | 0 | 0 | 4.7 | 1,266 | +2.8% | |
| Green | 0 | 0 | 0 | 0 | 0 | 4.3 | 1,156 | -0.3% | |
| Stop! Durrington's Overdevelopment - Save Titnores' Trees | 0 | 0 | 0 | 0 | 0 | 0.6 | 174 | +0.6% | |
Ward results
| Party | Candidate | Votes | % | ±% | |
|---|---|---|---|---|---|
| Conservative | Kevin Skepper | 1,062 | 49.6 | +14.1 | |
| Liberal Democrats | Gary Riding | 941 | 44.0 | -8.2 | |
| Labour | John Turley | 136 | 6.4 | +6.4 | |
| Majority | 121 | 5.6 | |||
| Turnout | 2,139 | 33.0 | -0.3 | ||
| Conservative hold | Swing | ||||
| Party | Candidate | Votes | % | ±% | |
|---|---|---|---|---|---|
| Liberal Democrats | Robin Rogers | 1,025 | |||
| Liberal Democrats | David Potter | 952 | |||
| Conservative | Bill Capper | 944 | |||
| Conservative | Ruth White | 924 | |||
| Green | Julian Warrick | 251 | |||
| UKIP | Chris Chatfield | 204 | |||
| Turnout | 4,300 | 35.5 | +0.8 | ||
| Liberal Democrats hold | Swing | ||||
| Liberal Democrats hold | Swing | ||||
| Party | Candidate | Votes | % | ±% | |
|---|---|---|---|---|---|
| Conservative | Clive Roberts | 874 | 42.7 | +1.1 | |
| Liberal Democrats | Janet Goldsbrough-Jones | 630 | 30.8 | -7.0 | |
| Green | James Pearson | 263 | 12.9 | +1.2 | |
| Labour | Tony Smith | 180 | 8.8 | +0.0 | |
| UKIP | Christopher Woodward | 99 | 4.8 | +4.8 | |
| Majority | 244 | 11.9 | +8.1 | ||
| Turnout | 2,046 | 31.5 | +1.5 | ||
| Conservative hold | Swing | ||||
| Party | Candidate | Votes | % | ±% | |
|---|---|---|---|---|---|
| Conservative | Bryan Turner | 1,085 | 47.4 | +5.4 | |
| Liberal Democrats | Andrew Muggeridge | 844 | 36.9 | -7.6 | |
| Green | Marie Hillcoat | 193 | 8.4 | -5.1 | |
| Labour | Tori Finney | 168 | 7.3 | +7.3 | |
| Majority | 241 | 10.5 | |||
| Turnout | 2,290 | 35.0 | +1.7 | ||
| Conservative hold | Swing | ||||
| Party | Candidate | Votes | % | ±% | |
|---|---|---|---|---|---|
| Conservative | Ann Sayers | 1,817 | 62.9 | -3.4 | |
| Liberal Democrats | Merlin Jones | 410 | 14.2 | -5.8 | |
| UKIP | Richard Bater | 323 | 11.2 | -2.5 | |
| Stop! Durrington's Overdevelopment - Save Titnores' Trees | Dawn Smith | 174 | 6.0 | +6.0 | |
| Labour | Janet Haden | 165 | 5.7 | +5.7 | |
| Majority | 1,407 | 48.7 | +2.4 | ||
| Turnout | 2,889 | 43.0 | +1.8 | ||
| Conservative hold | Swing | ||||
| Party | Candidate | Votes | % | ±% | |
|---|---|---|---|---|---|
| Conservative | John Livermore | 1,003 | 53.6 | -8.4 | |
| Liberal Democrats | Alan Jones | 446 | 23.9 | -14.1 | |
| Green | Derek Colkett | 248 | 13.3 | +13.3 | |
| UKIP | Stuart Field | 173 | 9.3 | +9.3 | |
| Majority | 557 | 29.7 | +5.7 | ||
| Turnout | 1,870 | 31.0 | +0.4 | ||
| Conservative hold | Swing | ||||
| Party | Candidate | Votes | % | ±% | |
|---|---|---|---|---|---|
| Conservative | Keith Mercer | 1,511 | 63.4 | +3.4 | |
| Liberal Democrats | Susan Withnell | 344 | 14.4 | -1.0 | |
| Green | Sam Colkett | 201 | 8.4 | -2.5 | |
| UKIP | Phil Ruddock | 171 | 7.2 | +0.5 | |
| Labour | Barrie Slater | 155 | 6.5 | -0.5 | |
| Majority | 1,167 | 49.0 | +4.4 | ||
| Turnout | 2,382 | 36.7 | -1.6 | ||
| Conservative hold | Swing | ||||
| Party | Candidate | Votes | % | ±% | |
|---|---|---|---|---|---|
| Conservative | Graham Fabes | 1,845 | 77.2 | +2.5 | |
| Liberal Democrats | Norah Fisher | 425 | 17.8 | -7.5 | |
| Labour | Hazel Rennie | 121 | 5.1 | +5.1 | |
| Majority | 1,420 | 59.4 | +10.0 | ||
| Turnout | 2,391 | 39.0 | -0.1 | ||
| Conservative hold | Swing | ||||
| Party | Candidate | Votes | % | ±% | |
|---|---|---|---|---|---|
| Conservative | Noel Atkins | 1,530 | 61.3 | -9.5 | |
| Liberal Democrats | Michael Cranefield | 603 | 24.1 | -5.1 | |
| UKIP | Ron Brooks | 364 | 14.6 | +14.6 | |
| Majority | 527 | 37.2 | -4.4 | ||
| Turnout | 2,497 | 35.0 | +1.8 | ||
| Conservative hold | Swing | ||||
| Party | Candidate | Votes | % | ±% | |
|---|---|---|---|---|---|
| Conservative | Roger Oakley | 962 | 45.2 | -1.3 | |
| Liberal Democrats | James Doyle | 950 | 44.6 | -8.9 | |
| Labour | Ann Saunders | 216 | 10.2 | +10.2 | |
| Majority | 12 | 0.6 | |||
| Turnout | 2,128 | 36.0 | +2.9 | ||
| Conservative gain from Liberal Democrats | Swing | ||||
| Party | Candidate | Votes | % | ±% | |
|---|---|---|---|---|---|
| Liberal Democrats | Hazel Thorpe | 1,259 | 58.3 | +4.1 | |
| Conservative | John Rose | 632 | 29.3 | +0.2 | |
| UKIP | Martin McGinlay | 144 | 6.7 | -1.8 | |
| Labour | Sid Wells | 125 | 5.8 | -2.4 | |
| Majority | 627 | 29.0 | +3.9 | ||
| Turnout | 2,160 | 33.8 | +0.3 | ||
| Liberal Democrats hold | Swing | ||||
References
- ^ "Worthing". BBC News Online. Retrieved 14 October 2009.
- ^ a b "Conservatives look safe in Worthing". The Argus. 30 April 2007. Retrieved 15 October 2009.
- ^ "Tories improve majority in Worthing". The Argus. 4 May 2007. Retrieved 6 October 2009.
- ^ "Lib Dems and Tories share spoils". BBC News Online. 4 May 2007. Retrieved 15 October 2009.
- ^ a b c d "Local elections results across Sussex". The Argus. 5 May 2007. Retrieved 15 October 2009.
- ^ a b c d e f g h i j k l "Worthing election results". Worthing Herald. 3 May 2007. Archived from the original on 5 May 2013. Retrieved 14 October 2009.
- ^ "National: Elections 2007: Town and country go to the polls". The Guardian. 4 May 2007. p. 6.
- ^ "Election 2007 Results". The Times. 4 May 2007. p. 8.
- ^ a b c d e f g h i j k "Local Elections 2007". Worthing Borough Council. Archived from the original on 3 February 2011. Retrieved 14 October 2009.
| West Sussex CC | |
|---|---|
| Adur | |
| Arun | |
| Chichester | |
| Crawley | |
| Horsham | |
| Mid Sussex | |
| Worthing | |
| |