
| |||||||||||||||||||||||||
32 of the 96 seats on Manchester City Council 49 seats needed for a majority | |||||||||||||||||||||||||
|---|---|---|---|---|---|---|---|---|---|---|---|---|---|---|---|---|---|---|---|---|---|---|---|---|---|
| |||||||||||||||||||||||||
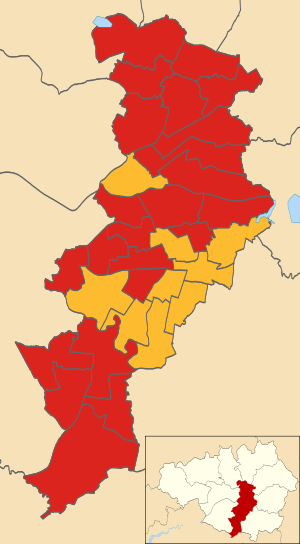 Map of the results of the 2006 Manchester council election. Labour in red and the Liberal Democrats in yellow. | |||||||||||||||||||||||||
| |||||||||||||||||||||||||
Elections to Manchester City Council were held on 4 May 2006. One third of the council was up for election, with each successful candidate to serve a four-year term of office, expiring in 2010. The council stayed under Labour Party control, strengthened by four gains from the Liberal Democrats.[1][2]
YouTube Encyclopedic
-
1/1Views:3 571
-
‘The Rise of Identity Politics and the Decline of Labour’, Professor Rob Ford, 2017.
Transcription
Election result
Changes in vote share are compared to the 2004 election.
| Manchester Council Election Result 2006[2] | ||||||||||
|---|---|---|---|---|---|---|---|---|---|---|
| Party | This election | Full council | This election | |||||||
| Seats | Net | Seats % | Other | Total | Total % | Votes | Votes % | +/− | ||
| Labour | 23 | 71.9 | 38 | 61 | 63.5 | 41,039 | 44.8 | |||
| Liberal Democrats | 9 | 28.1 | 25 | 34 | 35.4 | 28,929 | 31.6 | |||
| Conservative | 0 | 0.0 | 0 | 0 | 0.0 | 9,649 | 10.5 | |||
| Green | 0 | 0.0 | 1 | 1 | 1.1 | 8,493 | 9.3 | |||
| UKIP | 0 | 0.0 | 0 | 0 | 0.0 | 1,128 | 1.2 | |||
| Independent | 0 | 0.0 | 0 | 0 | 0.0 | 833 | 0.9 | |||
| BNP | 0 | 0.0 | 0 | 0 | 0.0 | 641 | 0.7 | |||
| Respect | 0 | 0.0 | 0 | 0 | 0.0 | 615 | 0.7 | |||
| Socialist Alternative | 0 | 0.0 | 0 | 0 | 0.0 | 214 | 0.2 | n/a | ||
| Independent Liberal | 0 | 0.0 | 0 | 0 | 0.0 | 11 | 0.0 | n/a | ||
Ward results
Below is a list of the 32 individual wards with the candidates standing in those wards and the number of votes the candidates acquired. Incumbent councillors seeking re-election were elected in 2004 and are marked with an asterisk.
Ancoats and Clayton
| Party | Candidate | Votes | % | ±% | |
|---|---|---|---|---|---|
| Labour | Jim Battle* | 1,463 | 48.3 | +2.2 | |
| Liberal Democrats | Daniel James Valentine | 1,235 | 40.7 | -0.2 | |
| Conservative | Christine Joan Birchenough | 136 | 4.5 | -0.6 | |
| Green | Richard Francis Keatley | 126 | 4.2 | -0.5 | |
| Independent | John Hulse | 71 | 2.3 | -1.2 | |
| Majority | 228 | 7.6 | +2.0 | ||
| Turnout | 3,031 | 32.9 | -5.1 | ||
| Labour hold | Swing | +1.2 | |||
Ardwick
| Party | Candidate | Votes | % | ±% | |
|---|---|---|---|---|---|
| Labour | Mavis Smitheman* | 1,248 | 61.4 | +15.7 | |
| Liberal Democrats | Mohammad Alam Panwar | 405 | 19.9 | -7.5 | |
| Green | Christopher David Charlton | 216 | 10.6 | -2.4 | |
| Conservative | Tadeusz Sochacki | 163 | 8.0 | +0.9 | |
| Majority | 843 | 41.5 | +23.2 | ||
| Turnout | 2,032 | 21.7 | -2.7 | ||
| Labour hold | Swing | +11.6 | |||
Baguley
| Party | Candidate | Votes | % | ±% | |
|---|---|---|---|---|---|
| Labour Co-op | Eddie McCulley* | 1,205 | 49.0 | -4.8 | |
| Conservative | Joyce Kaye | 498 | 20.2 | -0.7 | |
| Liberal Democrats | Leslie James Ardron | 323 | 13.1 | -0.7 | |
| Green | Lynne Richmond | 220 | 8.9 | -2.5 | |
| Socialist Alternative | Lynn Worthington | 214 | 8.7 | +8.7 | |
| Majority | 707 | 28.7 | -4.1 | ||
| Turnout | 2,460 | 23.9 | -5.5 | ||
| Labour hold | Swing | -2.0 | |||
Bradford
| Party | Candidate | Votes | % | ±% | |
|---|---|---|---|---|---|
| Labour | John Longsden* | 1,525 | 69.8 | +7.7 | |
| Liberal Democrats | Rob Brettle | 316 | 14.5 | +0.3 | |
| Conservative | Karen Abbad | 188 | 8.6 | -6.5 | |
| Green | Christopher Waldon | 156 | 7.1 | -1.6 | |
| Majority | 1,209 | 55.3 | +14.2 | ||
| Turnout | 2,185 | 25.3 | -4.5 | ||
| Labour hold | Swing | +3.7 | |||
Brooklands
| Party | Candidate | Votes | % | ±% | |
|---|---|---|---|---|---|
| Labour Co-op | Sue Murphy* | 1,378 | 42.1 | -2.7 | |
| Conservative | Ralph John Ellerton | 953 | 29.2 | -5.1 | |
| Liberal Democrats | John Paul Ankers | 787 | 24.1 | +10.7 | |
| Green | Tamisin MacCarthy-Morrogh | 149 | 4.6 | -2.8 | |
| Majority | 425 | 13.0 | +2.4 | ||
| Turnout | 3,267 | 33.4 | -1.4 | ||
| Labour hold | Swing | +1.2 | |||
Burnage
| Party | Candidate | Votes | % | ±% | |
|---|---|---|---|---|---|
| Liberal Democrats | Rodney Alan Isherwood* | 1,460 | 47.5 | -10.4 | |
| Labour | Frank Oliver Duffy | 1,169 | 38.0 | +12.7 | |
| Conservative | Dorothy Helen Keller | 252 | 8.2 | -0.5 | |
| Green | Elindsay James | 149 | 4.8 | -3.2 | |
| Majority | 291 | 9.5 | -23.1 | ||
| Turnout | 3,073 | 29.8 | -10.3 | ||
| Liberal Democrats hold | Swing | -11.5 | |||
Charlestown
| Party | Candidate | Votes | % | ±% | |
|---|---|---|---|---|---|
| Labour | Eric Hobin* | 1,435 | 54.3 | -4.8 | |
| Conservative | Vivienne Inez Clarke | 388 | 14.7 | -1.5 | |
| Liberal Democrats | Ann Rodgers | 348 | 13.2 | -11.5 | |
| UKIP | Catherine Andrea Ritchie | 312 | 11.8 | +11.8 | |
| Green | Helen Sarah Dolan | 159 | 6.0 | +6.0 | |
| Majority | 1,047 | 39.6 | +5.2 | ||
| Turnout | 2,642 | 29.2 | -5.2 | ||
| Labour hold | Swing | -1.6 | |||
Cheetham
| Party | Candidate | Votes | % | ±% | |
|---|---|---|---|---|---|
| Labour | Naeem Ul Hassam* | 1,707 | 45.6 | +0.8 | |
| Liberal Democrats | Qassim Afzal | 1,608 | 43.0 | +5.9 | |
| Green | Jacqueline Smith | 235 | 6.3 | +6.3 | |
| Conservative | Kim Elvin Glasspole | 191 | 5.1 | +2.4 | |
| Majority | 99 | 2.6 | -5.1 | ||
| Turnout | 3,741 | 36.2 | -11.0 | ||
| Labour hold | Swing | -2.5 | |||
Chorlton
| Party | Candidate | Votes | % | ±% | |
|---|---|---|---|---|---|
| Labour Co-op | Val Stevens* | 1,828 | 42.0 | +9.0 | |
| Liberal Democrats | Charles Leslie Glover | 1,713 | 39.4 | +6.7 | |
| Green | Brian Arthur Candeland | 609 | 14.0 | -1.4 | |
| Conservative | Amar Rouf Ahmed | 198 | 4.6 | -4.0 | |
| Majority | 115 | 2.6 | +2.3 | ||
| Turnout | 4,348 | 43.0 | -3.9 | ||
| Labour hold | Swing | +1.1 | |||
Chorlton Park
| Party | Candidate | Votes | % | ±% | |
|---|---|---|---|---|---|
| Liberal Democrats | Norman Lewis* | 1,724 | 54.7 | +0.7 | |
| Labour | Yogesh Virmani | 797 | 25.3 | +6.4 | |
| Green | Kathryn Mary Brownbridge | 399 | 12.7 | -1.1 | |
| Conservative | Rodney Keller | 229 | 7.3 | +0.0 | |
| Majority | 927 | 29.4 | +5.6 | ||
| Turnout | 3,149 | 32.1 | -10.9 | ||
| Liberal Democrats hold | Swing | -2.8 | |||
City Centre
| Party | Candidate | Votes | % | ±% | |
|---|---|---|---|---|---|
| Liberal Democrats | Elaine Boyes* | 531 | 38.0 | +0.5 | |
| Labour Co-op | Chris Paul | 374 | 26.8 | -0.8 | |
| Conservative | James Jacob Gilchrist Berry | 311 | 22.3 | +7.1 | |
| Green | Birgit Vollm | 181 | 13.0 | -2.0 | |
| Majority | 157 | 11.2 | +1.3 | ||
| Turnout | 1,397 | 16.4 | -2.4 | ||
| Liberal Democrats hold | Swing | +0.6 | |||
Crumpsall
| Party | Candidate | Votes | % | ±% | |
|---|---|---|---|---|---|
| Labour | Jon-Leigh Pritchard* | 1,667 | 49.6 | +4.6 | |
| Liberal Democrats | Sham Raja | 738 | 21.9 | +2.2 | |
| Conservative | Adrian Paul Glasspole | 476 | 14.2 | -4.3 | |
| UKIP | Ernest Robert Willescroft | 259 | 7.7 | +7.7 | |
| Green | Justine Michelle Hall | 223 | 6.6 | -10.1 | |
| Majority | 929 | 27.6 | +2.4 | ||
| Turnout | 3,363 | 33.8 | -8.0 | ||
| Labour hold | Swing | +1.2 | |||
Didsbury East
| Party | Candidate | Votes | % | ±% | |
|---|---|---|---|---|---|
| Liberal Democrats | Anthony Thomas Parkinson* | 1,809 | 45.3 | -2.4 | |
| Labour | Geoffrey Bridson | 1,369 | 34.3 | +2.9 | |
| Green | Richard Edgar Gee | 459 | 11.5 | +3.4 | |
| Conservative | Peter Malcolm Schofield | 359 | 9.0 | -3.7 | |
| Majority | 440 | 11.0 | -5.3 | ||
| Turnout | 3,996 | 39.1 | -9.3 | ||
| Liberal Democrats hold | Swing | -2.6 | |||
Didsbury West
| Party | Candidate | Votes | % | ±% | |
|---|---|---|---|---|---|
| Liberal Democrats | Richard Mark Clayton | 1,189 | 42.9 | +0.1 | |
| Labour | David Clive Ellison | 692 | 25.0 | +4.6 | |
| Conservative | Peter Girvan Hilton | 485 | 17.5 | +2.3 | |
| Green | George Stanislaw Czernuszka | 329 | 11.9 | -4.2 | |
| UKIP | Robert Gutfreund-Walmsley | 76 | 2.7 | -2.9 | |
| Majority | 497 | 17.9 | -4.5 | ||
| Turnout | 2,771 | 28.0 | -8.4 | ||
| Liberal Democrats hold | Swing | -2.2 | |||
Fallowfield
| Party | Candidate | Votes | % | ±% | |
|---|---|---|---|---|---|
| Labour | Mike Amesbury | 1,357 | 46.4 | +4.1 | |
| Liberal Democrats | John-Paul Wilkins* | 1,086 | 37.2 | +0.6 | |
| Conservative | Cedric Beniston | 171 | 5.9 | -3.8 | |
| Green | Susan Somerville | 168 | 5.7 | -5.7 | |
| BNP | Joseph Gerard Marjella Finnon | 140 | 4.8 | +4.8 | |
| Majority | 271 | 9.3 | +3.5 | ||
| Turnout | 2,922 | 28.1 | -2.4 | ||
| Labour gain from Liberal Democrats | Swing | +1.7 | |||
Gorton North
| Party | Candidate | Votes | % | ±% | |
|---|---|---|---|---|---|
| Labour | Nilofar Siddiqi | 1,244 | 39.7 | +0.1 | |
| Liberal Democrats | Bernadette Newing* | 1,132 | 36.1 | -11.0 | |
| Independent | Allan James Grafton | 465 | 14.8 | +14.8 | |
| Conservative | Patricia Ann Ainscough | 144 | 4.6 | -3.5 | |
| Green | Rachel Michelle Wilson | 78 | 2.5 | -2.8 | |
| Independent | David Colin Jones | 72 | 2.3 | +2.3 | |
| Majority | 112 | 3.6 | -3.9 | ||
| Turnout | 3,135 | 31.4 | -1.9 | ||
| Labour gain from Liberal Democrats | Swing | +5.5 | |||
Gorton South
| Party | Candidate | Votes | % | ±% | |
|---|---|---|---|---|---|
| Liberal Democrats | John Richard Bridges* | 1,375 | 47.8 | -7.6 | |
| Labour | Julie Reid | 1,031 | 35.8 | +8.3 | |
| Green | David William Mottram | 246 | 8.5 | -1.0 | |
| Conservative | Raymond Kenyon | 226 | 7.9 | +0.4 | |
| Majority | 344 | 12.0 | -15.9 | ||
| Turnout | 2,878 | 26.9 | -4.6 | ||
| Liberal Democrats hold | Swing | -7.9 | |||
Harpurhey
| Party | Candidate | Votes | % | ±% | |
|---|---|---|---|---|---|
| Labour | Paul Fairweather* | 1,420 | 55.3 | -0.3 | |
| Liberal Democrats | Gareth David Aubrey | 320 | 12.5 | -11.5 | |
| UKIP | Roger Porter Bullock | 312 | 12.1 | +12.1 | |
| Conservative | Ian Beswick | 302 | 11.8 | -2.4 | |
| Green | Darren Jason Flynn | 215 | 8.4 | +8.4 | |
| Majority | 1,100 | 42.8 | +11.2 | ||
| Turnout | 2,569 | 22.1 | -4.8 | ||
| Labour hold | Swing | +5.6 | |||
Higher Blackley
| Party | Candidate | Votes | % | ±% | |
|---|---|---|---|---|---|
| Labour | Anna Margaret Trotman* | 1,477 | 57.0 | -3.4 | |
| Conservative | Terence Shannon | 506 | 19.5 | -0.3 | |
| Liberal Democrats | Barbara Argyropoulos | 383 | 14.8 | -4.9 | |
| Green | Michael Robert Shaw | 226 | 8.7 | +8.7 | |
| Majority | 971 | 37.5 | -3.1 | ||
| Turnout | 2,592 | 26.5 | -5.8 | ||
| Labour hold | Swing | -1.5 | |||
Hulme
| Party | Candidate | Votes | % | ±% | |
|---|---|---|---|---|---|
| Labour | Nigel Joseph Murphy | 816 | 37.9 | +1.8 | |
| Liberal Democrats | Oliver West | 576 | 26.7 | +7.6 | |
| Green | Steven Jonathan Durrant | 539 | 25.0 | -12.4 | |
| Conservative | Paul Anthony Kierman | 96 | 4.6 | -2.7 | |
| Independent | Christine Anne Boscott-Shermerdine | 53 | 2.5 | +2.5 | |
| Independent | Captain Cae Os | 43 | 2.0 | +2.0 | |
| UKIP | Peter David Reeve | 20 | 0.9 | +0.9 | |
| Independent Liberal | Charles Anthony Lyn-Lloyd | 11 | 0.5 | +0.5 | |
| Majority | 240 | 11.1 | +9.8 | ||
| Turnout | 2,154 | 24.1 | -1.5 | ||
| Labour hold | Swing | -2.9 | |||
Levenshulme
| Party | Candidate | Votes | % | ±% | |
|---|---|---|---|---|---|
| Liberal Democrats | Alexander Cowan* | 1,402 | 50.1 | -3.1 | |
| Labour | Dermot Sean Zafar | 779 | 27.9 | +3.8 | |
| Green | Peter Norman Thompson | 399 | 14.3 | -2.1 | |
| Conservative | William Moore | 217 | 7.8 | +1.5 | |
| Majority | 623 | 22.3 | -6.9 | ||
| Turnout | 2,797 | 28.4 | -4.1 | ||
| Liberal Democrats hold | Swing | -3.4 | |||
Longsight
| Party | Candidate | Votes | % | ±% | |
|---|---|---|---|---|---|
| Labour | Maryam Fazeela Khan | 1,687 | 54.6 | +24.4 | |
| Liberal Democrats | Mohammed Sajjad* | 774 | 25.1 | -19.2 | |
| Green | Hassan Ukairo | 444 | 14.4 | -1.7 | |
| Conservative | Zahir Ali | 182 | 5.9 | -3.5 | |
| Majority | 913 | 30.0 | +15.4 | ||
| Turnout | 3,087 | 32.3 | -6.0 | ||
| Labour gain from Liberal Democrats | Swing | +21.8 | |||
Miles Platting and Newton Heath
| Party | Candidate | Votes | % | ±% | |
|---|---|---|---|---|---|
| Labour | John Flanagan* | 1,286 | 43.5 | +6.3 | |
| Liberal Democrats | Richard John Wilson | 791 | 26.8 | +9.5 | |
| BNP | Derek George Adams | 501 | 16.9 | +3.4 | |
| UKIP | Lisa Ann Duffy | 149 | 5.0 | +5.0 | |
| Conservative | Brian George Birchenough | 134 | 4.5 | -3.0 | |
| Green | Anthony James Quinn | 96 | 3.2 | -1.9 | |
| Majority | 495 | 16.7 | -1.1 | ||
| Turnout | 2,957 | 29.1 | -2.9 | ||
| Labour hold | Swing | -1.6 | |||
Moss Side
| Party | Candidate | Votes | % | ±% | |
|---|---|---|---|---|---|
| Labour | Roy Blake Walters* | 1,734 | 63.7 | +3.6 | |
| Liberal Democrats | Mohammad Hamza Butt | 509 | 18.7 | +1.1 | |
| Green | Robin Goater | 235 | 8.6 | +0.2 | |
| Independent | Reverend Juggla | 129 | 4.7 | -2.8 | |
| Conservative | Raymond Talbot Wattenbach | 116 | 4.3 | -2.1 | |
| Majority | 1,225 | 45.0 | +2.4 | ||
| Turnout | 2,723 | 27.8 | -0.0 | ||
| Labour hold | Swing | +1.2 | |||
Moston
| Party | Candidate | Votes | % | ±% | |
|---|---|---|---|---|---|
| Labour | Bill Risby* | 1,774 | 53.1 | -5.2 | |
| Conservative | Anthony Gerard Pinder | 755 | 22.6 | -2.7 | |
| Liberal Democrats | Timothy John Hartley | 506 | 15.2 | +3.1 | |
| Green | Rose Ann Cameron | 303 | 9.0 | +9.0 | |
| Majority | 1,019 | 30.5 | -2.6 | ||
| Turnout | 3,338 | 31.2 | -6.1 | ||
| Labour hold | Swing | -1.2 | |||
Northenden
| Party | Candidate | Votes | % | ±% | |
|---|---|---|---|---|---|
| Labour | Richard James Cowell* | 1,431 | 46.9 | +2.2 | |
| Liberal Democrats | Martin Clive Eakins | 1,092 | 35.8 | +15.7 | |
| Conservative | Nathan James Cruddas | 391 | 12.8 | -5.2 | |
| Green | Lance David Crookes | 136 | 4.5 | -12.6 | |
| Majority | 339 | 11.1 | -13.5 | ||
| Turnout | 3,050 | 29.3 | -3.6 | ||
| Labour hold | Swing | -6.7 | |||
Old Moat
| Party | Candidate | Votes | % | ±% | |
|---|---|---|---|---|---|
| Labour | Brian Harrison* | 1,567 | 54.4 | +5.0 | |
| Liberal Democrats | Tina Maache | 773 | 26.9 | -0.4 | |
| Green | Robin-Ella Davies | 317 | 11.0 | -1.4 | |
| Conservative | Daniel Rossall Valentine | 221 | 7.7 | -3.2 | |
| Majority | 794 | 27.6 | +5.4 | ||
| Turnout | 2,878 | 29.2 | -3.2 | ||
| Labour hold | Swing | +2.7 | |||
Rusholme
| Party | Candidate | Votes | % | ±% | |
|---|---|---|---|---|---|
| Liberal Democrats | Lynne Williams* | 1,157 | 39.9 | -16.0 | |
| Labour | John Byrne | 804 | 27.7 | -0.8 | |
| Respect | Nahella Ashraf | 615 | 21.2 | +21.2 | |
| Green | Penelope Irene Collins | 188 | 6.5 | -2.9 | |
| Conservative | Barbara Mary Goodall | 135 | 4.7 | -1.4 | |
| Majority | 353 | 12.2 | -15.1 | ||
| Turnout | 2,899 | 31.5 | -6.5 | ||
| Liberal Democrats hold | Swing | -7.6 | |||
Sharston
| Party | Candidate | Votes | % | ±% | |
|---|---|---|---|---|---|
| Labour Co-op | Hugh Barrett* | 1,248 | 55.0 | +4.7 | |
| Conservative | Agnes Anne Carroll | 402 | 17.7 | -1.1 | |
| Liberal Democrats | William David Fisher | 355 | 15.6 | -0.9 | |
| Green | Karen Jane Duffy | 264 | 11.5 | -2.9 | |
| Majority | 846 | 37.3 | +5.8 | ||
| Turnout | 2,269 | 21.4 | -5.6 | ||
| Labour hold | Swing | +2.9 | |||
Whalley Range
| Party | Candidate | Votes | % | ±% | |
|---|---|---|---|---|---|
| Labour | Mary Rose Watson | 1,637 | 46.1 | +17.4 | |
| Liberal Democrats | Joy Ruth Winder* | 1,158 | 32.6 | -6.6 | |
| Green | Mary Rosalind Candeland | 466 | 13.1 | +0.6 | |
| Conservative | Matthew Graham Cox | 289 | 8.1 | -11.5 | |
| Majority | 479 | 13.5 | +2.9 | ||
| Turnout | 3,550 | 34.5 | -9.3 | ||
| Labour gain from Liberal Democrats | Swing | +12.0 | |||
Withington
| Party | Candidate | Votes | % | ±% | |
|---|---|---|---|---|---|
| Liberal Democrats | Simon David Wheale | 1,064 | 47.8 | -10.6 | |
| Labour | Delores Elizabeth Long | 613 | 27.6 | +9.0 | |
| Green | Sarah Stuart | 340 | 15.3 | +0.9 | |
| Conservative | Andrew Christopher Perfect | 207 | 9.3 | +0.7 | |
| Majority | 451 | 20.3 | -19.5 | ||
| Turnout | 2,224 | 22.3 | -8.4 | ||
| Liberal Democrats hold | Swing | -9.8 | |||
Woodhouse Park
| Party | Candidate | Votes | % | ±% | |
|---|---|---|---|---|---|
| Labour | Edward Newman* | 1,277 | 61.5 | +1.1 | |
| Conservative | Ruby Marie Raynor | 328 | 15.8 | -0.8 | |
| Liberal Democrats | Joseph Francis Podbylski | 290 | 14.0 | -0.2 | |
| Green | Peter Andrew Somerville | 180 | 8.7 | -0.1 | |
| Majority | 949 | 45.7 | +1.8 | ||
| Turnout | 2,075 | 21.8 | -5.7 | ||
| Labour hold | Swing | +0.9 | |||
By-elections between 2006 and 2007
| Party | Candidate | Votes | % | ±% | |
|---|---|---|---|---|---|
| Liberal Democrats | Charles Glover | 1,588 | 49.3 | +1.5 | |
| Labour | Julie Reid | 1,208 | 37.5 | +1.7 | |
| BNP | Derek Adams | 185 | 5.7 | +5.7 | |
| Green | David Mottram | 151 | 4.7 | -3.8 | |
| Conservative | Daniel Valentine | 90 | 2.8 | -5.1 | |
| Majority | 380 | 11.8 | -0.2 | ||
| Turnout | 3,222 | 29.9 | +3.0 | ||
| Liberal Democrats hold | Swing | -0.1 | |||
References
- ^ a b c d e f g h i j k l m n o p q r s t u v w x y z aa ab ac ad ae af "Local Election Results 2006". manchester.gov.uk. Archived from the original on 11 May 2010. Retrieved 17 January 2012.
- ^ a b c d e f g h i j k l m n o p q r s t u v w x y z aa ab ac ad ae af ag "Local Elections Archive: 2006 - Manchester". andrewteale.me.uk. Retrieved 17 January 2012.
- ^ "By-election results: 2006–2011". manchester.gov.uk. Archived from the original on 11 May 2010. Retrieved 19 January 2012.