
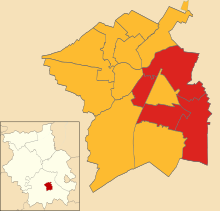
Elections for Cambridge City Council were held on Thursday 4 May 2006. As Cambridge City Council is elected by thirds, one seat in each of the city's 14 wards was up for election. The exception was Romsey, where two seats were up for election as a by-election for the other seat was held on the same day. Therefore, 15 of the 42 seats on the council were up for election. Overall turnout was 34.4%, down from 37.0% in 2004. The lowest turnout (28.4%) was in Abbey ward and the highest (40.8%) in Queen Edith's.
YouTube Encyclopedic
-
1/5Views:206 7065261 5544142 138
-
'Government by decree - Covid-19 and the Constitution': Lord Sumption
-
Facing Global Challenges Together
-
Unsettled Citizens | Economic Citizenship || Radcliffe Institute
-
Design Impact Vol. 5: Hard City - Soft City: A South Asian Perspective
-
Charles M. Blow and Henry Louis Gates, Jr. discuss, 'The Devil You Know: A Black Power Manifesto'
Transcription
Results summary
| 2006 Cambridge City Council election | ||||||||||
|---|---|---|---|---|---|---|---|---|---|---|
| Party | This election | Full council | This election | |||||||
| Seats | Net | Seats % | Other | Total | Total % | Votes | Votes % | +/− | ||
| Liberal Democrats | 11 | 73.3 | 18 | 29 | 69.0 | 12,668 | 38.6 | -2.7 | ||
| Labour | 4 | 26.7 | 9 | 13 | 31.0 | 8,328 | 25.4 | -0.5 | ||
| Conservative | 0 | 0.0 | 0 | 0 | 0.0 | 7,015 | 21.4 | -0.8 | ||
| Green | 0 | 0.0 | 0 | 0 | 0.0 | 4,124 | 12.6 | +3.8 | ||
| Respect | 0 | 0.0 | 0 | 0 | 0.0 | 562 | 1.7 | N/A | ||
| UKIP | 0 | 0.0 | 0 | 0 | 0.0 | 138 | 0.4 | -0.4 | ||
Ward results
Abbey
| Party | Candidate | Votes | % | ±% | |
|---|---|---|---|---|---|
| Labour | Miriam Lynn | 668 | 37.4 | -3.0 | |
| Green | Margaret White | 464 | 26.0 | +8.1 | |
| Conservative | Simon Mitton | 362 | 20.3 | -1.3 | |
| Liberal Democrats | Edward Sexton | 292 | 16.3 | -3.8 | |
| Majority | 204 | 11.4 | N/A | ||
| Turnout | 1,786 | 28.5 | +0.7 | ||
| Labour hold | Swing | ||||
Arbury
| Party | Candidate | Votes | % | ±% | |
|---|---|---|---|---|---|
| Liberal Democrats | Timothy Ward | 1,022 | 40.3 | +4.2 | |
| Labour | Michael Todd-Jones | 816 | 32.1 | +4.0 | |
| Conservative | Shapour Meftah | 482 | 19.0 | -2.6 | |
| Green | Michael Smith | 219 | 8.6 | -5.6 | |
| Majority | 206 | 8.2 | N/A | ||
| Turnout | 2,539 | 36.9 | -6.3 | ||
| Liberal Democrats hold | Swing | ||||
Castle
| Party | Candidate | Votes | % | ±% | |
|---|---|---|---|---|---|
| Liberal Democrats | Simon Kightley | 985 | 48.3 | +2.3 | |
| Conservative | Edward MacNaghten | 476 | 23.3 | +3.5 | |
| Green | Stephen Lawrence | 298 | 14.6 | -3.2 | |
| Labour | Lucy Sheerman | 282 | 13.8 | -2.6 | |
| Majority | 509 | 25.0 | N/A | ||
| Turnout | 2,041 | 31.5 | -1.6 | ||
| Liberal Democrats hold | Swing | ||||
Cherry Hinton
| Party | Candidate | Votes | % | ±% | |
|---|---|---|---|---|---|
| Labour | Stuart Newbold | 1,071 | 42.9 | +1.8 | |
| Conservative | Eric Barrett-Payton | 864 | 34.6 | +1.5 | |
| Liberal Democrats | Natalie Mayer-Hutchings | 367 | 14.7 | -3.2 | |
| Green | Neil Ford | 193 | 7.7 | -0.1 | |
| Majority | 207 | 8.3 | N/A | ||
| Turnout | 2,495 | 39.7 | -6.7 | ||
| Labour gain from Conservative | Swing | ||||
Coleridge
| Party | Candidate | Votes | % | ±% | |
|---|---|---|---|---|---|
| Labour | Lewis Herbert | 909 | 41.8 | +8.0 | |
| Liberal Democrats | Andrew Blackhurst | 477 | 22.0 | +0.8 | |
| Conservative | Stephen Jones | 463 | 21.3 | -0.9 | |
| Green | Hamish Downer | 186 | 8.6 | -6.1 | |
| UKIP | Albert Watts | 138 | 6.4 | -1.7 | |
| Majority | 432 | 19.8 | N/A | ||
| Turnout | 2,173 | 36.3 | -0.8 | ||
| Labour hold | Swing | ||||
East Chesterton
| Party | Candidate | Votes | % | ±% | |
|---|---|---|---|---|---|
| Liberal Democrats | Marian Holness | 884 | 40.6 | +4.8 | |
| Labour | Richard Layfield | 583 | 26.8 | +1.4 | |
| Conservative | Kevin Francis | 482 | 22.1 | +6.7 | |
| Green | Peter Pope | 228 | 10.5 | -4.0 | |
| Majority | 301 | 13.8 | N/A | ||
| Turnout | 2,177 | 35.9 | -1.2 | ||
| Liberal Democrats hold | Swing | ||||
King's Hedges
| Party | Candidate | Votes | % | ±% | |
|---|---|---|---|---|---|
| Liberal Democrats | Neale Upstone | 718 | 40.0 | +14.0 | |
| Labour | Gerri Bird | 533 | 29.7 | -2.6 | |
| Conservative | Mark Taylor | 350 | 19.5 | -8.0 | |
| Green | Gerhard Golbeck-Wood | 193 | 10.8 | -3.3 | |
| Majority | 185 | 10.3 | N/A | ||
| Turnout | 1,794 | 29.6 | +2.0 | ||
| Liberal Democrats gain from Labour | Swing | ||||
Market
| Party | Candidate | Votes | % | ±% | |
|---|---|---|---|---|---|
| Liberal Democrats | Colin Rosenstiel | 772 | 42.7 | +1.8 | |
| Conservative | Timothy Haire | 392 | 21.7 | +3.5 | |
| Green | Martin Lucas-Smith | 359 | 19.9 | +2.8 | |
| Labour | Maureen Donnelly | 285 | 15.8 | +4.9 | |
| Majority | 380 | 21.0 | N/A | ||
| Turnout | 1,808 | 28.7 | -1.2 | ||
| Liberal Democrats hold | Swing | ||||
Newnham
| Party | Candidate | Votes | % | ±% | |
|---|---|---|---|---|---|
| Liberal Democrats | Rod Cantrill | 974 | 46.2 | -0.8 | |
| Conservative | James Strachan | 475 | 22.6 | +2.8 | |
| Labour | Joseph Powell | 336 | 16.0 | +1.4 | |
| Green | Anna Gomori-Woodcock | 321 | 15.2 | -3.3 | |
| Majority | 499 | 23.7 | N/A | ||
| Turnout | 2,106 | 31.7 | +0.1 | ||
| Liberal Democrats hold | Swing | ||||
Petersfield
| Party | Candidate | Votes | % | ±% | |
|---|---|---|---|---|---|
| Labour | Kevin Blencowe | 879 | 39.0 | +4.3 | |
| Liberal Democrats | Steven Cooper | 848 | 37.7 | +3.4 | |
| Green | John Collins | 282 | 12.5 | -2.7 | |
| Conservative | Rosemary Clarkson | 243 | 10.8 | -1.1 | |
| Majority | 31 | 1.4 | N/A | ||
| Turnout | 2,252 | 35.8 | -1.3 | ||
| Labour hold | Swing | ||||
Queen's Edith
| Party | Candidate | Votes | % | ±% | |
|---|---|---|---|---|---|
| Liberal Democrats | Alan Baker | 1,489 | 56.7 | +3.6 | |
| Conservative | Donald Douglas | 735 | 28.0 | +7.2 | |
| Labour | Leonard Freeman | 219 | 8.3 | -0.5 | |
| Green | Shayne Mitchell | 181 | 6.9 | -3.8 | |
| Majority | 754 | 28.7 | N/A | ||
| Turnout | 2,624 | 40.8 | -2.8 | ||
| Liberal Democrats hold | Swing | ||||
Romsey
| Party | Candidate | Votes | % | ||
|---|---|---|---|---|---|
| Liberal Democrats | Sarah Ellis-Miller | 1,065 | 44.6 | ||
| Liberal Democrats | Raj Shah | 815 | 34.1 | ||
| Labour | Jonathan Goodacre | 623 | 26.1 | ||
| Labour | Tariq Sadiq | 491 | 20.6 | ||
| Green | Jesse Griffiths | 358 | 15.0 | ||
| Respect | Thomas Woodcock | 294 | 12.3 | ||
| Respect | Samuel Caldwell | 268 | 11.2 | ||
| Conservative | Hugh Mennie | 235 | 9.8 | ||
| Green | Neil Hewett | 216 | 9.0 | ||
| Conservative | Angela Ozturk | 216 | 9.0 | ||
| Turnout | 2,388 | 37.0 | |||
| Liberal Democrats hold | |||||
| Liberal Democrats hold | |||||
Trumpington
| Party | Candidate | Votes | % | ±% | |
|---|---|---|---|---|---|
| Liberal Democrats | Sheila Stuart | 960 | 45.5 | -1.9 | |
| Conservative | John Ionides | 752 | 35.7 | +4.6 | |
| Green | Ceri Galloway | 205 | 9.7 | -4.1 | |
| Labour | Pamela Stacey | 191 | 9.1 | +1.4 | |
| Majority | 208 | 9.8 | N/A | ||
| Turnout | 2,108 | 39.5 | -2.9 | ||
| Liberal Democrats hold | Swing | ||||
West Chesterton
| Party | Candidate | Votes | % | ±% | |
|---|---|---|---|---|---|
| Liberal Democrats | Max Boyce | 1,000 | 42.5 | -4.6 | |
| Conservative | Steven Mastin | 488 | 20.8 | +3.5 | |
| Labour | Simon Watkins | 442 | 18.8 | +0.6 | |
| Green | Sarah Peake | 421 | 17.9 | +0.5 | |
| Majority | 512 | 21.8 | N/A | ||
| Turnout | 2,351 | 36.7 | -4.1 | ||
| Liberal Democrats hold | Swing | ||||
Sources
- Cambridge City Council: Local election results
- Cambridge City Council: 2006 local election full results
- Cambridge City Election Results since 1945
See also
| Cambridgeshire County Council | |
|---|---|
| Peterborough City Council | |
| Cambridge City Council | |
| East Cambridgeshire District Council | |
| Fenland District Council | |
| Huntingdonshire District Council | |
| South Cambridgeshire District Council | |
| Isle of Ely County Council |
|
| Huntingdon & Peterborough County Council |
|
| Mayor of Cambridgeshire and Peterborough | |
| |