
| |||||||||||||||||||||||||||||||||||||||||||||
All 84 seats to Lancashire County Council 43 seats needed for a majority | |||||||||||||||||||||||||||||||||||||||||||||
|---|---|---|---|---|---|---|---|---|---|---|---|---|---|---|---|---|---|---|---|---|---|---|---|---|---|---|---|---|---|---|---|---|---|---|---|---|---|---|---|---|---|---|---|---|---|
| |||||||||||||||||||||||||||||||||||||||||||||
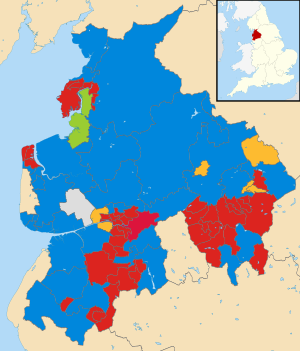 2005 local election results in Lancashire | |||||||||||||||||||||||||||||||||||||||||||||
| |||||||||||||||||||||||||||||||||||||||||||||
Elections to Lancashire County Council were held on 5 May 2005, on the same day as the 2005 general election.
Each single-member ward in Lancashire was modified by boundary changes. No elections were held in Blackpool or Blackburn as they are unitary authorities outside of the county boundaries.
Result
| Party | Seats | Gains | Losses | Net gain/loss | Seats % | Votes % | Votes | +/− | |
|---|---|---|---|---|---|---|---|---|---|
| Labour | 44 | 52.38 | 37.62 | 197,061 | |||||
| Conservative | 31 | 36.91 | 37.33 | 195,517 | |||||
| Liberal Democrats | 6 | 7.14 | 19.04 | 99,710 | |||||
| Green | 1 | 1.19 | 1.60 | 8,350 | |||||
| Independent | 1 | 1.19 | 1.42 | 7,417 | |||||
| Idle Toad | 1 | 1.19 | 0.32 | 1,680 | |||||
| BNP | 0 | 0.00 | 1.85 | 9,702 | |||||
| Respect | 0 | 0.00 | 0.53 | 2,795 | |||||
| UKIP | 0 | 0.00 | 0.29 | 1,531 | |||||
The overall turnout was 60.48% with a total of 523,763 valid votes cast. A total of 4,385 ballots were rejected.
Council composition
Following the election, the composition of the council was:
| 44 | 31 | 6 | 1 | 1 | 1 |
| Labour | Conservative | Lib Dem | G | I | IT |
G - Green Party
I - Independent
IT - Idle Toad
Ward results
Burnley
Burnley Central East
| Party | Candidate | Votes | % | ±% | |
|---|---|---|---|---|---|
| Labour | John Cavangh | 3,012 | 49.24 | ||
| Liberal Democrats | William Bennett | 2,169 | 35.46 | ||
| Conservative | David Tierney | 936 | 15.30 | ||
| Majority | 843 | 13.78 | |||
| Turnout | 6,117 | 53.58 | |||
| Labour win (new seat) | |||||
Burnley Central West
| Party | Candidate | Votes | % | ±% | |
|---|---|---|---|---|---|
| Labour | Tony Martin | 2,356 | 37.55 | ||
| Conservative | Peter Doyle | 1,477 | 23.54 | ||
| Liberal Democrats | Denise Embra | 1,339 | 21.34 | ||
| BNP | John Cave | 1,102 | 17.57 | ||
| Majority | 879 | 14.01 | |||
| Turnout | 6,274 | 58.73 | |||
| Labour win (new seat) | |||||
Burnley North East
| Party | Candidate | Votes | % | ±% | |
|---|---|---|---|---|---|
| Labour | Terry Burns | 2,418 | 40.43 | ||
| Liberal Democrats | Martin Smith | 1,949 | 32.59 | ||
| BNP | David Shapcott | 838 | 14.01 | ||
| Conservative | Jeffrey Pickup | 776 | 12.97 | ||
| Majority | 469 | 7.84 | |||
| Turnout | 5,981 | 59.89 | |||
| Labour win (new seat) | |||||
Burnley Rural
| Party | Candidate | Votes | % | ±% | |
|---|---|---|---|---|---|
| Labour | Stephen Large | 2,410 | 31.94 | ||
| Conservative | David Heginbotham | 2,103 | 27.87 | ||
| Liberal Democrats | Peter McCann | 1,829 | 24.24 | ||
| BNP | David Thomson | 1,204 | 15.95 | ||
| Majority | 307 | 4.07 | |||
| Turnout | 7,546 | 66.17 | |||
| Labour win (new seat) | |||||
Burnley South West
| Party | Candidate | Votes | % | ±% | |
|---|---|---|---|---|---|
| Labour | Maureen Martin | 2,411 | 36.61 | ||
| Liberal Democrats | Charles Bullas | 2,007 | 30.47 | ||
| BNP | Derek Dawson | 1,191 | 18.08 | ||
| Conservative | Ida Carmichael | 977 | 14.84 | ||
| Majority | 404 | 6.14 | |||
| Turnout | 6,586 | 58.56 | |||
| Labour win (new seat) | |||||
Padiham and Burnley West
| Party | Candidate | Votes | % | ±% | |
|---|---|---|---|---|---|
| Labour | Marcus Johnstone | 2,377 | 37.98 | ||
| Liberal Democrats | Mary McCann | 1,393 | 22.26 | ||
| BNP | Sharon Wilkinson | 1,363 | 21.78 | ||
| Conservative | Laura Dowding | 1,125 | 17.98 | ||
| Majority | 984 | 15.72 | |||
| Turnout | 6,258 | 60.42 | |||
| Labour win (new seat) | |||||
Chorley
Chorley East
| Party | Candidate | Votes | % | ±% | |
|---|---|---|---|---|---|
| Labour | Don Yates | 3,542 | 66.24 | ||
| Conservative | Roger Livesey | 1,805 | 33.76 | ||
| Majority | 1,737 | 32.48 | |||
| Turnout | 5,347 | 54.67 | |||
| Labour win (new seat) | |||||
Chorley North
| Party | Candidate | Votes | % | ±% | |
|---|---|---|---|---|---|
| Conservative | Mark Perks | 3,279 | 43.02 | ||
| Labour | Sharon Woodruff-Gray | 2,752 | 36.11 | ||
| Liberal Democrats | Glenda Charlesworth | 1,591 | 20.87 | ||
| Majority | 527 | 6.91 | |||
| Turnout | 7,622 | 65.77 | |||
| Conservative win (new seat) | |||||
Chorley Rural East
| Party | Candidate | Votes | % | ±% | |
|---|---|---|---|---|---|
| Conservative | Mary Case | 3,826 | 46.47 | ||
| Labour | Thomas Robinson | 3,372 | 40.96 | ||
| Green | Matthew Sims | 1,035 | 12.57 | ||
| Majority | 454 | 5.51 | |||
| Turnout | 8,233 | 67.57 | |||
| Conservative win (new seat) | |||||
Chorley Rural North
| Party | Candidate | Votes | % | ±% | |
|---|---|---|---|---|---|
| Conservative | Margaret Livesey | 2,442 | 40.82 | ||
| Labour | James Freeman | 2,160 | 36.11 | ||
| Liberal Democrats | Stephen Fenn | 1,380 | 23.07 | ||
| Majority | 282 | 4.71 | |||
| Turnout | 5,982 | 57.85 | |||
| Conservative win (new seat) | |||||
Chorley Rural West
| Party | Candidate | Votes | % | ±% | |
|---|---|---|---|---|---|
| Labour | Alan Whittaker | 3,840 | 50.05 | ||
| Conservative | Keith Iddon | 3,833 | 49.95 | ||
| Majority | 7 | 0.10 | |||
| Turnout | 7,673 | 67.98 | |||
| Labour win (new seat) | |||||
Chorley South
| Party | Candidate | Votes | % | ±% | |
|---|---|---|---|---|---|
| Labour | Peter Wilson | 2,972 | 53.44 | ||
| Conservative | Lawrence Catterall | 1,602 | 28.80 | ||
| Liberal Democrats | David Porter | 988 | 17.76 | ||
| Majority | 1,370 | 24.64 | |||
| Turnout | 5,562 | 56.20 | |||
| Labour win (new seat) | |||||
Chorley West
| Party | Candidate | Votes | % | ±% | |
|---|---|---|---|---|---|
| Labour | Edward Forshaw | 3,369 | 40.26 | ||
| Conservative | Harold Heaton | 2,770 | 33.11 | ||
| Liberal Democrats | Kenneth Ball | 2,228 | 26.63 | ||
| Majority | 599 | 7.15 | |||
| Turnout | 8,367 | 63.64 | |||
| Labour win (new seat) | |||||
Fylde
Fylde East
| Party | Candidate | Votes | % | ±% | |
|---|---|---|---|---|---|
| Independent | Elizabeth Oades | 2,309 | 37.02 | ||
| Conservative | Peter Sowden | 2,051 | 32.89 | ||
| Labour | Adrian Hutton | 1,207 | 19.35 | ||
| Liberal Democrats | Willian Winlow | 670 | 10.74 | ||
| Majority | 258 | 4.13 | |||
| Turnout | 6,237 | 60.67 | |||
| Independent win (new seat) | |||||
Fylde South
| Party | Candidate | Votes | % | ±% | |
|---|---|---|---|---|---|
| Conservative | Bernard Whittle | 2,954 | 54.45 | ||
| Labour | Michelle Miles | 1,430 | 26.36 | ||
| Liberal Democrats | Patricia Fielding | 1,041 | 19.19 | ||
| Majority | 1,524 | 28.09 | |||
| Turnout | 6,233 | 60.46 | |||
| Conservative win (new seat) | |||||
Fylde West
| Party | Candidate | Votes | % | ±% | |
|---|---|---|---|---|---|
| Conservative | Joyce Stuart | 3,426 | 54.97 | ||
| Labour | Nicholas Wareing | 1,534 | 24.61 | ||
| Liberal Democrats | John Graddon | 1,273 | 20.42 | ||
| Majority | 1,892 | 30.36 | |||
| Turnout | 6,233 | 63.30 | |||
| Conservative win (new seat) | |||||
Lytham
| Party | Candidate | Votes | % | ±% | |
|---|---|---|---|---|---|
| Conservative | Timothy Ashton | 3,647 | 59.31 | ||
| Labour | Marjorie Sherwood | 1,437 | 23.37 | ||
| Liberal Democrats | Michael Turner | 1,065 | 17.32 | ||
| Majority | 2,210 | 35.94 | |||
| Turnout | 6,149 | 61.24 | |||
| Conservative win (new seat) | |||||
St Annes North
| Party | Candidate | Votes | % | ±% | |
|---|---|---|---|---|---|
| Conservative | Colin Walton | 2,640 | 41.89 | ||
| Liberal Democrats | Howard Henshaw | 2,152 | 34.15 | ||
| Labour | William Taylor | 1,510 | 23.96 | ||
| Majority | 488 | 7.74 | |||
| Turnout | 6,302 | 59.98 | |||
| Conservative win (new seat) | |||||
St Annes South
| Party | Candidate | Votes | % | ±% | |
|---|---|---|---|---|---|
| Conservative | Alfred Jealous | 2,601 | 42.77 | ||
| Liberal Democrats | Karen Henshaw | 2,096 | 34.47 | ||
| Labour | Dennis Davenport | 1,384 | 22.76 | ||
| Majority | 505 | 8.30 | |||
| Turnout | 6,081 | 56.62 | |||
| Conservative win (new seat) | |||||
Hyndburn
Accrington North
| Party | Candidate | Votes | % | ±% | |
|---|---|---|---|---|---|
| Labour | Jean Battle | 3,561 | 60.52 | ||
| Conservative | Janet Storey | 2,323 | 39.48 | ||
| Majority | 1,238 | 21.04 | |||
| Turnout | 5,884 | 61.06 | |||
| Labour win (new seat) | |||||
Accrington South
| Party | Candidate | Votes | % | ±% | |
|---|---|---|---|---|---|
| Labour | Wendy Dwyer | 3,288 | 58.80 | ||
| Conservative | Paul Barton | 2,394 | 41.20 | ||
| Majority | 984 | 17.60 | |||
| Turnout | 5,592 | 59.06 | |||
| Labour win (new seat) | |||||
Accrington West
| Party | Candidate | Votes | % | ±% | |
|---|---|---|---|---|---|
| Labour | Doreen Pollitt | 3,201 | 61.81 | ||
| Conservative | Mohammed Siddique | 1,978 | 38.19 | ||
| Majority | 1,223 | 23.62 | |||
| Turnout | 5,179 | 52.27 | |||
| Labour win (new seat) | |||||
Great Harwood
| Party | Candidate | Votes | % | ±% | |
|---|---|---|---|---|---|
| Labour | Susan Shorrock | 2,241 | 43.56 | ||
| Conservative | Winifred Frankland | 2,086 | 40.54 | ||
| Liberal Democrats | George Slynn | 818 | 15.90 | ||
| Majority | 155 | 3.02 | |||
| Turnout | 5,145 | 62.52 | |||
| Labour win (new seat) | |||||
Oswaldtwistle
| Party | Candidate | Votes | % | ±% | |
|---|---|---|---|---|---|
| Labour | Dorothy Westell | 2,918 | 46.24 | ||
| Conservative | Peter Britcliffe | 2,244 | 35.56 | ||
| Liberal Democrats | Clive Fisher | 1,149 | 18.20 | ||
| Majority | 674 | 10.68 | |||
| Turnout | 6,311 | 60.71 | |||
| Labour win (new seat) | |||||
Rishton and Clayton-le-Moors
| Party | Candidate | Votes | % | ±% | |
|---|---|---|---|---|---|
| Labour | Miles Parkinson | 2,958 | 45.74 | ||
| Conservative | Ann Scaife | 2,539 | 39.26 | ||
| Liberal Democrats | William Greene | 970 | 15.00 | ||
| Majority | 419 | 6.48 | |||
| Turnout | 6,467 | 61.29 | |||
| Labour win (new seat) | |||||
Lancaster
Heysham
| Party | Candidate | Votes | % | ±% | |
|---|---|---|---|---|---|
| Labour | Jean Yates | 2,453 | 39.30 | ||
| Conservative | Kenneth Brown | 2,214 | 35.48 | ||
| Liberal Democrats | William Riley | 792 | 12.69 | ||
| Independent | Michael Greenall | 607 | 9.73 | ||
| Green | Stephen Dickenson | 175 | 2.80 | ||
| Majority | 239 | 3.82 | |||
| Turnout | 6,241 | 59.32 | |||
| Labour win (new seat) | |||||
Lancaster Central
| Party | Candidate | Votes | % | ±% | |
|---|---|---|---|---|---|
| Green | Christopher Coates | 2,252 | 31.43 | ||
| Labour | Michael Gibson | 2,102 | 29.33 | ||
| Conservative | Helen Helme | 1,821 | 25.41 | ||
| Liberal Democrats | Catherine Fritz | 991 | 13.83 | ||
| Majority | 150 | 2.10 | |||
| Turnout | 7,166 | 63.67 | |||
| Green win (new seat) | |||||
Lancaster East
| Party | Candidate | Votes | % | ±% | |
|---|---|---|---|---|---|
| Labour | Elizabeth Scott | 2,240 | 41.60 | ||
| Green | Matthew Wottoon | 1,482 | 27.52 | ||
| Liberal Democrats | Philip Dunster | 882 | 16.38 | ||
| Conservative | Joan Jackson | 781 | 14.50 | ||
| Majority | 758 | 14.08 | |||
| Turnout | 5,385 | 56.30 | |||
| Labour win (new seat) | |||||
Lancaster Rural East
| Party | Candidate | Votes | % | ±% | |
|---|---|---|---|---|---|
| Conservative | Susan Charles | 3,947 | 44.55 | ||
| Liberal Democrats | Joyce Pritchard | 2,560 | 28.89 | ||
| Labour | Benjamin Soffa | 1,768 | 19.95 | ||
| Green | Abigail Mills | 585 | 6.60 | ||
| Majority | 1,387 | 15.66 | |||
| Turnout | 8,860 | 68.75 | |||
| Conservative win (new seat) | |||||
Lancaster Rural North
| Party | Candidate | Votes | % | ±% | |
|---|---|---|---|---|---|
| Conservative | Sarah Fishwick | 2,518 | 36.32 | ||
| Labour | Janette Gardner | 1,902 | 27.43 | ||
| Liberal Democrats | June Greenwell | 1,396 | 20.14 | ||
| Independent | Keith Budden | 781 | 11.26 | ||
| Green | Ian McCulloch | 336 | 4.85 | ||
| Majority | 616 | 8.89 | |||
| Turnout | 6,933 | 65.87 | |||
| Conservative win (new seat) | |||||
Lancaster South East
| Party | Candidate | Votes | % | ±% | |
|---|---|---|---|---|---|
| Labour | Peter Elliott | 1,862 | 37.23 | ||
| Conservative | Clare Hilley | 1,370 | 27.39 | ||
| Liberal Democrats | Robert Hayes | 1,370 | 27.39 | ||
| Green | Susanna Holden | 395 | 7.90 | ||
| Majority | 448 | 9.76 | |||
| Turnout | 5,001 | 52.28 | |||
| Labour win (new seat) | |||||
Morecambe North
| Party | Candidate | Votes | % | ±% | |
|---|---|---|---|---|---|
| Conservative | Anthony Jones | 2,667 | 44.85 | ||
| Labour | Elaine Bush | 1,840 | 30.94 | ||
| Liberal Democrats | Ian Clift | 1,089 | 18.31 | ||
| Green | Pamela White | 351 | 5.90 | ||
| Majority | 827 | 13.91 | |||
| Turnout | 5,947 | 73.19 | |||
| Conservative win (new seat) | |||||
Morecambe South
| Party | Candidate | Votes | % | ±% | |
|---|---|---|---|---|---|
| Labour | Albert Thornton | 2,554 | 38.64 | ||
| Liberal Democrats | Ronald Day | 1,927 | 29.15 | ||
| Conservative | Gordon Hagel | 1,898 | 28.71 | ||
| Green | Howard Jago | 231 | 3.49 | ||
| Majority | 627 | 9.49 | |||
| Turnout | 6,610 | 60.89 | |||
| Labour win (new seat) | |||||
Morecambe West
| Party | Candidate | Votes | % | ±% | |
|---|---|---|---|---|---|
| Labour | Janice Hanson | 2,904 | 53.32 | ||
| Conservative | John Mace | 1,331 | 24.44 | ||
| Liberal Democrats | Michael Gradwell | 983 | 18.05 | ||
| Green | Mark Westcombe | 228 | 4.19 | ||
| Majority | 1,573 | 28.88 | |||
| Turnout | 5,446 | 51.02 | |||
| Labour win (new seat) | |||||
Skerton
| Party | Candidate | Votes | % | ±% | |
|---|---|---|---|---|---|
| Labour | Nicola Penney | 3,096 | 59.93 | ||
| Conservative | Anthony Johnson | 1,347 | 26.07 | ||
| Green | Ashley Toms | 723 | 14.00 | ||
| Majority | 1,749 | 33.86 | |||
| Turnout | 5,166 | 54.16 | |||
| Labour win (new seat) | |||||
Pendle
Brierfield and Nelson North
| Party | Candidate | Votes | % | ±% | |
|---|---|---|---|---|---|
| Liberal Democrats | Nawaz Ahmed | 2,913 | 45.70 | ||
| Labour | Colin Waite | 2,135 | 33.50 | ||
| Conservative | Tonia Barton | 876 | 13.74 | ||
| BNP | Anthony Locke | 450 | 7.06 | ||
| Majority | 778 | 12.20 | |||
| Turnout | 6,374 | 61.78 | |||
| Liberal Democrats win (new seat) | |||||
Nelson South
| Party | Candidate | Votes | % | ±% | |
|---|---|---|---|---|---|
| Liberal Democrats | Sonia Robinson | 2,133 | 35.73 | ||
| Labour | Dorothy Ormrod | 2,081 | 34.86 | ||
| Conservative | Ann Jackson | 1,025 | 17.17 | ||
| BNP | Trevor Dawson | 731 | 12.24 | ||
| Majority | 52 | 0.87 | |||
| Turnout | 5,970 | 59.91 | |||
| Liberal Democrats win (new seat) | |||||
Pendle Central
| Party | Candidate | Votes | % | ±% | |
|---|---|---|---|---|---|
| Labour | Leonard Ormrod | 2,239 | 37.99 | ||
| Liberal Democrats | Dorothy Lord | 1,716 | 29.11 | ||
| Conservative | Michael Landriau | 1,124 | 19.07 | ||
| BNP | Brian Parker | 815 | 13.83 | ||
| Majority | 523 | 8.88 | |||
| Turnout | 5,894 | 57.79 | |||
| Labour win (new seat) | |||||
Pendle East
| Party | Candidate | Votes | % | ±% | |
|---|---|---|---|---|---|
| Conservative | Michael Calvert | 2,539 | 36.13 | ||
| Liberal Democrats | Alan Davies | 2,197 | 31.27 | ||
| Labour | Frank Allanson | 1,549 | 22.04 | ||
| BNP | Thomas Boocock | 742 | 10.56 | ||
| Majority | 342 | 4.86 | |||
| Turnout | 7,027 | 66.20 | |||
| Conservative win (new seat) | |||||
Pendle West
| Party | Candidate | Votes | % | ±% | |
|---|---|---|---|---|---|
| Conservative | Shelagh Derwent | 3,489 | 47.21 | ||
| Liberal Democrats | Francis Wren | 1,722 | 23.30 | ||
| Labour | Sheila Wicks | 1,591 | 21.53 | ||
| BNP | Robert Cottage | 588 | 7.96 | ||
| Majority | 1,767 | 23.91 | |||
| Turnout | 7,390 | 70.18 | |||
| Conservative win (new seat) | |||||
West Craven
| Party | Candidate | Votes | % | ±% | |
|---|---|---|---|---|---|
| Liberal Democrats | David Whipp | 2,954 | 35.63 | ||
| Conservative | Morris Horsfield | 2,562 | 30.90 | ||
| Labour | Antony Holian | 1,849 | 22.30 | ||
| BNP | Geoffrey Whitehead | 678 | 8.18 | ||
| UKIP | Steven Preston | 248 | 2.99 | ||
| Majority | 392 | 4.73 | |||
| Turnout | 8,291 | 66.23 | |||
| Liberal Democrats win (new seat) | |||||
Preston
Preston Central North
| Party | Candidate | Votes | % | ±% | |
|---|---|---|---|---|---|
| Labour | Francesco De Molfetta | 1,674 | 30.86 | ||
| Conservative | Constance McManus | 1,283 | 23.65 | ||
| Liberal Democrats | Samir Bohra | 987 | 18.20 | ||
| Independent | Terry Cartwright | 812 | 14.97 | ||
| Respect | Valli Umarji | 551 | 10.16 | ||
| Independent | John Wilson | 117 | 2.16 | ||
| Majority | 391 | 7.21 | |||
| Turnout | 5,424 | 60.06 | |||
| Labour win (new seat) | |||||
Preston Central South
| Party | Candidate | Votes | % | ±% | |
|---|---|---|---|---|---|
| Labour | Vali Patel | 2,218 | 49.72 | ||
| Conservative | Ronald Smith | 944 | 21.16 | ||
| Liberal Democrats | Tracy Singleton | 878 | 19.68 | ||
| Respect | Steven Brooks | 421 | 9.44 | ||
| Majority | 1,274 | 28.56 | |||
| Turnout | 4,461 | 52.01 | |||
| Labour win (new seat) | |||||
Preston City
| Party | Candidate | Votes | % | ±% | |
|---|---|---|---|---|---|
| Labour | Yakub Patel | 2,044 | 46.44 | ||
| Respect | Elaine Abbot | 887 | 20.16 | ||
| Liberal Democrats | Wilfred Gavin | 780 | 17.72 | ||
| Conservative | Collette Nuttall | 690 | 15.68 | ||
| Majority | 1,157 | 26.28 | |||
| Turnout | 4,401 | 54.95 | |||
| Labour win (new seat) | |||||
Preston East
| Party | Candidate | Votes | % | ±% | |
|---|---|---|---|---|---|
| Labour | Kevin Ellard | 2,648 | 57.92 | ||
| Conservative | Raymond Johnson | 1,105 | 24.17 | ||
| Liberal Democrats | Lydia Livingston | 629 | 13.76 | ||
| Respect | Ronald Yates | 190 | 4.15 | ||
| Majority | 1,543 | 33.75 | |||
| Turnout | 4,572 | 47.86 | |||
| Labour win (new seat) | |||||
Preston North
| Party | Candidate | Votes | % | ±% | |
|---|---|---|---|---|---|
| Conservative | Geoffrey Driver | 2,852 | 47.87 | ||
| Liberal Democrats | William Parkinson | 2,003 | 33.62 | ||
| Labour | Alan Woods | 1,103 | 18.51 | ||
| Majority | 849 | 14.25 | |||
| Turnout | 5,958 | 67.70 | |||
| Conservative win (new seat) | |||||
Preston North East
| Party | Candidate | Votes | % | ±% | |
|---|---|---|---|---|---|
| Conservative | Michael Welsh | 2,301 | 39.88 | ||
| Labour | William Burke | 1,772 | 30.71 | ||
| Liberal Democrats | Richard Hopkin | 1,697 | 29.41 | ||
| Majority | 529 | 9.17 | |||
| Turnout | 5,770 | 59.51 | |||
| Conservative win (new seat) | |||||
Preston North West
| Party | Candidate | Votes | % | ±% | |
|---|---|---|---|---|---|
| Labour | Thomas Burns | 2,085 | 44.55 | ||
| Liberal Democrats | Mark Jewell | 1,410 | 30.13 | ||
| Conservative | Julie Mullineaux | 1,089 | 23.27 | ||
| Respect | Edna Greenwood | 96 | 2.05 | ||
| Majority | 675 | 14.42 | |||
| Turnout | 4,680 | 57.59 | |||
| Labour win (new seat) | |||||
Preston Rural
| Party | Candidate | Votes | % | ±% | |
|---|---|---|---|---|---|
| Conservative | George Wilkins | 3,538 | 63.47 | ||
| Liberal Democrats | Rowena Edmondson | 1,126 | 20.20 | ||
| Labour | Pauline Jackson | 910 | 16.33 | ||
| Majority | 2,412 | 43.27 | |||
| Turnout | 5,574 | 66.71 | |||
| Conservative win (new seat) | |||||
Preston South East
| Party | Candidate | Votes | % | ±% | |
|---|---|---|---|---|---|
| Labour | Dorothy Mein | 1,849 | 52.55 | ||
| Respect | Sumera Rizwan | 650 | 18.47 | ||
| Liberal Democrats | Paul Valentine | 516 | 14.66 | ||
| Conservative | Hussain Mulla | 504 | 14.32 | ||
| Majority | 1,199 | 34.08 | |||
| Turnout | 3,519 | 50.08 | |||
| Labour win (new seat) | |||||
Preston West
| Party | Candidate | Votes | % | ±% | |
|---|---|---|---|---|---|
| Liberal Democrats | Norman Abram | 2,411 | 45.06 | ||
| Labour | Paul Jackson | 1,471 | 27.49 | ||
| Conservative | Susan Hudson | 1,469 | 27.45 | ||
| Majority | 940 | 17.57 | |||
| Turnout | 5,351 | 56.69 | |||
| Liberal Democrats win (new seat) | |||||
Ribble Valley
Clitheroe
| Party | Candidate | Votes | % | ±% | |
|---|---|---|---|---|---|
| Liberal Democrats | John Sutcliffe | 2,935 | 41.73 | ||
| Conservative | Sheila Sims | 2,552 | 36.29 | ||
| Labour | Giles Bridge | 1,546 | 21.98 | ||
| Majority | 383 | 5.44 | |||
| Turnout | 7,033 | 61.21 | |||
| Liberal Democrats win (new seat) | |||||
Longridge with Bowland
| Party | Candidate | Votes | % | ±% | |
|---|---|---|---|---|---|
| Conservative | Mary Wilson | ||||
| Liberal Democrats | Jeffrey Flitcroft | 1,961 | 28.41 | ||
| Labour | Brenda Lambert | 1,088 | 15.76 | ||
| Majority | 1,893 | 27.42 | |||
| Turnout | 6,903 | 65.21 | |||
| Conservative win (new seat) | |||||
Ribble Valley North East
| Party | Candidate | Votes | % | ±% | |
|---|---|---|---|---|---|
| Conservative | Albert Atkinson | 4,661 | 56.55 | ||
| Liberal Democrats | Margaret Sutcliffe | 2,258 | 27.39 | ||
| Labour | Laura Field | 1,324 | 16.06 | ||
| Majority | 2,403 | 29.16 | |||
| Turnout | 8,243 | 71.70 | |||
| Conservative win (new seat) | |||||
Ribble Valley South West
| Party | Candidate | Votes | % | ±% | |
|---|---|---|---|---|---|
| Conservative | Christopher Holtom | 4,212 | 58.96 | ||
| Liberal Democrats | Graham Sowter | 1,731 | 24.23 | ||
| Labour | David Hinder | 1,201 | 16.81 | ||
| Majority | 2,481 | 34.73 | |||
| Turnout | 7,144 | 69.39 | |||
| Conservative win (new seat) | |||||
Rossendale
Rossendale East
| Party | Candidate | Votes | % | ±% | |
|---|---|---|---|---|---|
| Conservative | James Eaton | 2,828 | 41.65 | ||
| Labour | David Hancock | 2,661 | 39.20 | ||
| Liberal Democrats | John Glendinning | 1,300 | 19.15 | ||
| Majority | 167 | 2.45 | |||
| Turnout | 6,789 | 59.63 | |||
| Conservative win (new seat) | |||||
Rossendale North
| Party | Candidate | Votes | % | ±% | |
|---|---|---|---|---|---|
| Labour | Hazel Harding | 2,899 | 44.37 | ||
| Conservative | Anthony Winder | 2,856 | 43.71 | ||
| Liberal Democrats | Tariq Mahmood | 779 | 11.92 | ||
| Majority | 43 | 0.66 | |||
| Turnout | 6,534 | 64.77 | |||
| Labour win (new seat) | |||||
Rossendale South
| Party | Candidate | Votes | % | ±% | |
|---|---|---|---|---|---|
| Conservative | Duncan Ruddick | 2,627 | 37.30 | ||
| Labour | Alyson Barnes | 2,593 | 36.82 | ||
| Liberal Democrats | James Pilling | 1,490 | 21.15 | ||
| Green | Linda Hemsley | 333 | 4.73 | ||
| Majority | 34 | 0.48 | |||
| Turnout | 7,043 | 62.99 | |||
| Conservative win (new seat) | |||||
Rossendale West
| Party | Candidate | Votes | % | ±% | |
|---|---|---|---|---|---|
| Labour | Robert Wilkinson | 2,615 | 50.55 | ||
| Conservative | Peter Evans | 2,558 | 49.45 | ||
| Majority | 57 | 1.10 | |||
| Turnout | 5,173 | 59.57 | |||
| Labour win (new seat) | |||||
Whitworth
| Party | Candidate | Votes | % | ±% | |
|---|---|---|---|---|---|
| Labour | Sean Serridge | 1,837 | 34.41 | ||
| Conservative | Lynda Barnes | 1,528 | 28.63 | ||
| Independent | Ronald Neal | 1,238 | 23.19 | ||
| Liberal Democrats | Reginald Lane | 735 | 13.77 | ||
| Majority | 309 | 5.78 | |||
| Turnout | 5,338 | 57.28 | |||
| Labour win (new seat) | |||||
South Ribble
Bamber Bridge and Walton-le-Dale
| Party | Candidate | Votes | % | ±% | |
|---|---|---|---|---|---|
| Labour | Graham Davies | 2,321 | 42.19 | ||
| Conservative | Carol Chisholm | 1,720 | 31.27 | ||
| Idle Toad | John Higgins | 741 | 13.47 | ||
| Liberal Democrats | Anthony Hartley | 719 | 13.07 | ||
| Majority | 601 | 10.92 | |||
| Turnout | 5,501 | 58.37 | |||
| Labour win (new seat) | |||||
Faringdon
| Party | Candidate | Votes | % | ±% | |
|---|---|---|---|---|---|
| Labour | Fred Heyworth | 2,144 | 41.03 | ||
| Conservative | Kathleen Beattie | 1,613 | 30.86 | ||
| Liberal Democrats | Christine Harrison | 1,469 | 28.11 | ||
| Majority | 531 | 10.17 | |||
| Turnout | 5,226 | 60.10 | |||
| Labour win (new seat) | |||||
Leyland Central
| Party | Candidate | Votes | % | ±% | |
|---|---|---|---|---|---|
| Labour | Matthew Tomlinson | 3,441 | 47.82 | ||
| Liberal Democrats | Mark Alcock | 2,134 | 29.66 | ||
| Conservative | John Otter | 1,620 | 22.52 | ||
| Majority | 1,307 | 18.16 | |||
| Turnout | 7,195 | 62.79 | |||
| Labour win (new seat) | |||||
Leyland South West
| Party | Candidate | Votes | % | ±% | |
|---|---|---|---|---|---|
| Labour | Anne Brown | 3,402 | 51.35 | ||
| Conservative | Michael Green | 1,975 | 29.81 | ||
| Liberal Democrats | Wendy Alcock | 1,248 | 18.84 | ||
| Majority | 1,427 | 21.54 | |||
| Turnout | 6,625 | 57.42 | |||
| Labour win (new seat) | |||||
Penwortham North
| Party | Candidate | Votes | % | ±% | |
|---|---|---|---|---|---|
| Liberal Democrats | Anthony Pimblett | 2,567 | 39.08 | ||
| Conservative | Mary Robinson | 2,176 | 33.13 | ||
| Labour | Diane Maier | 1,288 | 19.61 | ||
| Independent | David Bennett | 537 | 8.18 | ||
| Majority | 391 | 5.95 | |||
| Turnout | 6,568 | 70.00 | |||
| Liberal Democrats win (new seat) | |||||
Penwortham South
| Party | Candidate | Votes | % | ±% | |
|---|---|---|---|---|---|
| Labour | Howard Gore | 3,239 | 47.44 | ||
| Conservative | Dorothy Gardner | 2,316 | 33.93 | ||
| Liberal Democrats | Andrew Jones | 1,272 | 18.63 | ||
| Majority | 923 | 13.51 | |||
| Turnout | 6,827 | 60.30 | |||
| Labour win (new seat) | |||||
South Ribble Rural East
| Party | Candidate | Votes | % | ±% | |
|---|---|---|---|---|---|
| Idle Toad | Thomas Sharratt | 2,619 | 44.29 | ||
| Labour | David Watts | 1,660 | 28.07 | ||
| Conservative | Philip Ames | 1,634 | 27.64 | ||
| Majority | 959 | 16.22 | |||
| Turnout | 5,913 | 60.52 | |||
| Idle Toad win (new seat) | |||||
South Ribble Rural West
| Party | Candidate | Votes | % | ±% | |
|---|---|---|---|---|---|
| Conservative | Keith Young | 4,169 | 53.89 | ||
| Labour | Andrew Bennison | 2,004 | 25.91 | ||
| Liberal Democrats | Nicholas Sumner | 1,563 | 20.20 | ||
| Majority | 2,165 | 27.98 | |||
| Turnout | 7,736 | 68.53 | |||
| Conservative win (new seat) | |||||
West Lancashire
Ormskirk West
| Party | Candidate | Votes | % | ±% | |
|---|---|---|---|---|---|
| Labour | Francis Williams | 2,453 | 43.62 | ||
| Conservative | Valerie Hopley | 2,377 | 42.26 | ||
| Green | Maurice George | 496 | 8.82 | ||
| Independent | Kenneth Walters | 298 | 5.30 | ||
| Majority | 76 | 1.36 | |||
| Turnout | 5,624 | 60.58 | |||
| Labour win (new seat) | |||||
Skelmersdale Central
| Party | Candidate | Votes | % | ±% | |
|---|---|---|---|---|---|
| Labour | Terence Aldridge | 3,610 | 73.82 | ||
| Liberal Democrats | Alan Spears | 738 | 15.09 | ||
| Conservative | Doreen Stephenson | 542 | 11.08 | ||
| Majority | 2,872 | 58.73 | |||
| Turnout | 4,890 | 42.56 | |||
| Labour win (new seat) | |||||
Skelmersdale East
| Party | Candidate | Votes | % | ±% | |
|---|---|---|---|---|---|
| Labour | Robert Pendleton | 3,862 | 60.40 | ||
| Conservative | Carolyn Evans | 2,532 | 39.60 | ||
| Majority | 1,330 | 20.80 | |||
| Turnout | 6,394 | 56.99 | |||
| Labour win (new seat) | |||||
Skelmersdale West
| Party | Candidate | Votes | % | ±% | |
|---|---|---|---|---|---|
| Labour | Christopher Cheetham | 4,674 | 80.14 | ||
| Conservative | Adrian Owens | 1,158 | 19.86 | ||
| Majority | 3,516 | 60.28 | |||
| Turnout | 5,832 | 51.18 | |||
| Labour win (new seat) | |||||
West Lancashire East
| Party | Candidate | Votes | % | ±% | |
|---|---|---|---|---|---|
| Conservative | Richard Shepherd | 2,978 | 47.90 | ||
| Labour | Jacqueline Citarella | 1,958 | 31.49 | ||
| Liberal Democrats | Henry Reeves | 1,281 | 20.62 | ||
| Majority | 1,020 | 16.41 | |||
| Turnout | 6,217 | 60.71 | |||
| Conservative win (new seat) | |||||
West Lancashire North
| Party | Candidate | Votes | % | ±% | |
|---|---|---|---|---|---|
| Conservative | Malcolm Barron | 3,596 | 54.13 | ||
| Labour | David Lloyd | 1,533 | 23.08 | ||
| Liberal Democrats | Marion Hancock | 796 | 11.98 | ||
| Independent | Joan Draper | 718 | 10.81 | ||
| Majority | 2,063 | 31.05 | |||
| Turnout | 6,643 | 59.79 | |||
| Conservative win (new seat) | |||||
West Lancashire South
| Party | Candidate | Votes | % | ±% | |
|---|---|---|---|---|---|
| Conservative | David O'Toole | 4,041 | 56.22 | ||
| Labour | Paul Cotterill | 2,384 | 33.17 | ||
| Green | John Watt | 763 | 10.61 | ||
| Majority | 1,657 | 23.05 | |||
| Turnout | 7,188 | 63.49 | |||
| Conservative win (new seat) | |||||
West Lancashire West
| Party | Candidate | Votes | % | ±% | |
|---|---|---|---|---|---|
| Conservative | William Cropper | 3,700 | 51.81 | ||
| Labour | Cynthia Dereli | 3,441 | 48.19 | ||
| Majority | 259 | 3.62 | |||
| Turnout | 7,141 | 60.09 | |||
| Conservative win (new seat) | |||||
Wyre
Amounderness
| Party | Candidate | Votes | % | ±% | |
|---|---|---|---|---|---|
| Conservative | John Shedwick | 3,316 | 57.42 | ||
| Labour | Alan Morgan | 2,459 | 42.58 | ||
| Majority | 857 | 14.84 | |||
| Turnout | 5,775 | 65.01 | |||
| Conservative win (new seat) | |||||
Fleetwood East
| Party | Candidate | Votes | % | ±% | |
|---|---|---|---|---|---|
| Labour | Clive Grunshaw | 3,092 | 57.65 | ||
| Conservative | Mark Hamer | 1,537 | 28.66 | ||
| Liberal Democrats | Kenneth Palmerton | 734 | 13.69 | ||
| Majority | 1,555 | 28.99 | |||
| Turnout | 5,363 | 50.69 | |||
| Labour win (new seat) | |||||
Fleetwood West
| Party | Candidate | Votes | % | ±% | |
|---|---|---|---|---|---|
| Labour | Vincent Riley | 2,621 | 51.04 | ||
| Conservative | William Proctor | 1,647 | 32.08 | ||
| Liberal Democrats | Jonathon Bamborough | 567 | 11.04 | ||
| UKIP | Gerard Gerrard | 300 | 5.84 | ||
| Majority | 974 | 18.96 | |||
| Turnout | 5,135 | 54.89 | |||
| Labour win (new seat) | |||||
Garstang
| Party | Candidate | Votes | % | ±% | |
|---|---|---|---|---|---|
| Conservative | Valerie Wilson | 4,355 | 53.74 | ||
| Liberal Democrats | Jack Rogers | 1,968 | 24.28 | ||
| Labour | Marilyn Levey | 1,781 | 21.98 | ||
| Majority | 2,387 | 29.46 | |||
| Turnout | 8,104 | 67.32 | |||
| Conservative win (new seat) | |||||
Poulton-le-Fylde
| Party | Candidate | Votes | % | ±% | |
|---|---|---|---|---|---|
| Conservative | Geoffrey Roper | 3,753 | 53.40 | ||
| Labour | Alphonse Robert | 2,211 | 31.46 | ||
| Liberal Democrats | Kevan Benfold | 1,064 | 15.14 | ||
| Majority | 1,542 | 21.94 | |||
| Turnout | 7,028 | 63.99 | |||
| Conservative win (new seat) | |||||
Thornton Cleveleys Central
| Party | Candidate | Votes | % | ±% | |
|---|---|---|---|---|---|
| Conservative | Keith Tebbs | 2,709 | 40.64 | ||
| Labour | Geoffrey Horrocks | 2,368 | 35.52 | ||
| Liberal Democrats | Steven Bate | 1,197 | 17.96 | ||
| UKIP | Roy Hopwood | 392 | 5.88 | ||
| Majority | 341 | 5.12 | |||
| Turnout | 6,666 | 59.83 | |||
| Conservative win (new seat) | |||||
Thornton Cleveleys North
| Party | Candidate | Votes | % | ±% | |
|---|---|---|---|---|---|
| Labour | Penelope Martin | 643 | 50.45 | ||
| Conservative | Arthur Brooks | 2,297 | 39.41 | ||
| UKIP | Henry Wilkinson | 591 | 10.14 | ||
| Majority | 643 | 11.04 | |||
| Turnout | 5,828 | 58.86 | |||
| Labour win (new seat) | |||||
Wyreside
| Party | Candidate | Votes | % | ±% | |
|---|---|---|---|---|---|
| Conservative | Robert Mutch | 5,048 | 64.22 | ||
| Labour | Margaret Jackson | 2,812 | 35.78 | ||
| Majority | 2,236 | 28.44 | |||
| Turnout | 7,860 | 63.67 | |||
| Conservative win (new seat) | |||||
Notes
| County council elections |
|
|---|---|
| Unitary authorities |
|
| District councils (Northern Ireland) | |
| Sui generis |
|
| Mayoral elections |
|
| |