Part of the 2004 Irish local elections
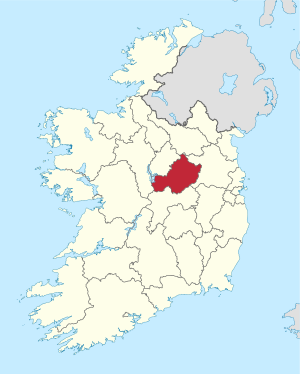
Map showing the area of Westmeath County Council
Council control after election TBD
An election to Westmeath County Council took place on 11 June 2004 as part of that year's Irish local elections . 23 councillors were elected from five local electoral areas (LEAs) for a five-year term of office on the electoral system of proportional representation by means of the single transferable vote (PR-STV).
Results by party Results by local electoral area Athlone
Athlone - 7 seats
Party
Candidate
FPv% Count
1
2
3
4
5
6
7
8
9
Fine Gael
Nicky McFadden 17.97
1,901
Fianna Fáil
Kevin (Boxer) Moran *
12.50
1,323
Fine Gael
Joe Whelan
9.93
1,051
1,108
1,120
1,137
1,162
1,190
1,372
Fianna Fáil
P.J. Coghill*
8.37
886
908
914
921
950
1,030
1,078
1,086
1,087
Fianna Fáil
Tom Allen 8.19
867
887
900
916
948
1,014
1,072
1,091
1,093
Fianna Fáil
Kieran Molloy *
7.86
832
889
903
943
1,007
1,159
1,212
1,225
1,227
Fine Gael
Mark Cooney *
7.66
811
1,026
1,052
1,088
1,134
1,228
1,329
Fianna Fáil
Frankie Keena
7.13
754
810
819
848
894
1,041
1,099
1,108
1,109
Fianna Fáil
Egbert Moran*
6.15
651
688
701
714
738
Labour
Denis Rohan
4.78
506
534
559
706
804
848
Sinn Féin
Matt Devlin
4.62
489
508
528
556
Labour
Jim Henson
3.08
326
372
405
Green
Martin McEnroe
1.71
184
205
Electorate: 19,031 Valid: 10,581 (55.60%) Spoilt: 193 Quota: 1,323 Turnout: 10,774 (56.61%)
Coole
Coole - 3 seats
Party
Candidate
FPv% Count
1
2
3
Fine Gael
Frank McDermott *
30.73
1,355
Fianna Fáil
Paddy Hill *
22.48
991
1,069
1,128
Fianna Fáil
P.J. O'Shaughnessy*
20.62
909
945
981
Labour
Adrian Murray
19.32
852
973
1,127
Sinn Féin
Niamh Hogg
6.85
302
319
Electorate: 7,087 Valid: 4,409 (62.21%) Spoilt: 104 Quota: 1,103 Turnout: 4,513 (63.68%)
Kilbeggan
Kilbeggan - 4 seats
Party
Candidate
FPv% Count
1
2
3
4
5
6
Fine Gael
Joe Flanagan *
28.38
1,683
Labour
Mark Nugent *
17.30
1,026
1,050
1,131
1,310
Fianna Fáil
Tom Cowley *
14.47
858
884
915
938
947
1,127
Fine Gael
Michael Newman *
13.66
810
1,016
1,052
1,099
1,127
1,219
Fianna Fáil
Michael Ryan*
8.99
533
671
714
772
797
854
Fianna Fáil
Christo Bradley
6.81
404
414
444
465
475
Sinn Féin
Eddie Seery
5.50
326
351
Labour
Pat Boyce
4.89
290
357
405
Electorate: 9,766 Valid: 1,187 Spoilt: 5,930 (60.72%) Quota: 129 Turnout: 6,059 (62.04%)
Mullingar East
Mullingar East - 4 seats
Party
Candidate
FPv% Count
1
2
3
4
5
6
7
Labour
Mick Dollard *
28.60
1,809
Fianna Fáil
Jim Bourke *
13.26
839
905
937
985
1,050
1,106
1,386
Labour
Dan McCarthy *
11.26
744
941
988
1,046
1,071
1,140
1,173
Fine Gael
Patrick McLoughlin *
10.95
693
714
726
741
801
978
1,093
Fianna Fáil
Denis Coyne
7.78
492
506
511
524
628
645
Labour
Denis Leonard
7.49
474
612
642
678
771
827
922
Fine Gael
Graham Temple
6.20
392
437
465
491
503
Independent
Robert Bagnall
6.01
380
389
408
441
Sinn Féin
Johnny Creagh
4.84
306
332
355
Green
Seán Corrigan
3.11
197
224
Electorate: 11,089 Valid: 6,326 (57.05%) Spoilt: 147 Quota: 1,266 Turnout: 6,473 (58.37%)
Mullingar West
Mullingar West - 5 seats
Party
Candidate
FPv% Count
1
2
3
4
5
6
7
8
9
Labour
Johnnie Penrose *
21.25
1,593
Fine Gael
Fintan Cooney
13.29
996
1,026
1,048
1,090
1,150
1,362
Fianna Fáil
Ken Glynn *
10.63
797
811
833
888
1,041
1,091
1,152
1,187
1,198
Labour
Detty Cornally
9.10
682
761
798
891
932
1,013
1,437
Fianna Fáil
Robert Troy 8.62
646
716
781
812
953
987
1,017
1,045
1,061
Fine Gael
Shay Boyhan*
8.35
626
653
676
700
717
823
859
948
1,033
Labour
Betty Doran*
5.79
434
500
523
588
610
647
Fine Gael
Peter Burke
6.60
495
511
531
571
601
Fine Gael
Tommy Wright
6.42
481
492
499
533
Independent
Frank McIntyre
5.51
413
427
476
Sinn Féin
Declan Gunning
4.46
334
350
Electorate: 13,184 Valid: 7,497 (56.86%) Spoilt: 124 Quota: 1,250 Turnout: 7,621 (57.80%)
External links
This page was last edited on 16 November 2023, at 07:30