To install click the Add extension button. That's it.

The source code for the WIKI 2 extension is being checked by specialists of the Mozilla Foundation, Google, and Apple. You could also do it yourself at any point in time.

4,5
Kelly Slayton
Congratulations on this excellent venture… what a great idea!
Alexander Grigorievskiy
I use WIKI 2 every day and almost forgot how the original Wikipedia looks like.
Live Statistics
English Articles
Improved in 24 Hours
Added in 24 Hours
What we do. Every page goes through several hundred of perfecting techniques; in live mode. Quite the same Wikipedia. Just better.
.
Leo
Newton
Brights
Milds

2004 Luxembourg general election

From Wikipedia, the free encyclopedia

2004 Luxembourg general election
Luxembourg
← 1999 13 June 2004 2009 →

All 60 seats in the Chamber of Deputies
31 seats needed for a majority
Party Leader % Seats +/–
CSV Jean-Claude Juncker 35.81 24 +5
LSAP Jean Asselborn 25.43 14 +1
DP Lydie Polfer 14.94 10 −5
Greens François Bausch 11.54 7 +2
ADR Robert Mehlen 9.04 5 −2
This lists parties that won seats. See the complete results below.
Results by commune
Prime Minister before Prime Minister after
Jean-Claude Juncker
CSV
Jean-Claude Juncker
CSV

General elections were held in Luxembourg on 13 June 2004,[1] alongside European Parliament elections. The ruling Christian Social People's Party (CSV) of Prime Minister Jean-Claude Juncker won the election, increasing its number of seats to its highest since before 1989 and its share of the vote to levels not seen since the 1959 election.

As expected, the CSV won a plurality of seats, adding 5 new deputies, and continued as the majority partner in the coalition government. However, the junior partner changed from the liberal Democratic Party (DP), which lost 5 seats, to the Luxembourg Socialist Workers' Party (LSAP), which gained one seat. The Greens also slightly increased their representation, whilst the Alternative Democratic Reform Party (ADR) lost ground.

The election coincided with the 2004 European Parliament election.

YouTube Encyclopedic

  • 1/5
    Views:
    724 440
    3 630
    1 019
    42 932
    388
  • What Will Europe Look Like In 2025?
  • What Brexit tells us about the British
  • A. Maurits van der Veen: Fall 2013 CES Friday Lecture Series
  • Danny Dorling | People and Places, Brexit and Britain: the importance of immigration and empire
  • Netherlands | Wikipedia audio article

Transcription

Candidates

List # Party Running in Existing seats
Centre Est Nord Sud
1 Alternative Democratic Reform Party (ADR)
7
2 Democratic Party (DP)
15
3 Luxembourg Socialist Workers' Party (LSAP)
13
4 The Greens
5
5 Christian Social People's Party (CSV)
19
6 The Left
1
7 Communist Party (KPL)
0
8 Free Party (FPL)
0

Results

PartyVotes%Seats+/–
Christian Social People's Party1,103,82535.81245
Luxembourg Socialist Workers' Party784,04825.4314+1
Democratic Party460,60114.9410–5
The Greens355,89511.547+2
Action Committee for Democracy and Pensions Justice278,7929.045–2
The Left62,0712.010–1
Communist Party of Luxembourg35,5241.150New
Free Party of Luxembourg1,9250.060New
Total3,082,681100.00600
Valid votes188,91094.41
Invalid/blank votes11,1825.59
Total votes200,092100.00
Registered voters/turnout217,68391.92
Source: Nohlen & Stöver

By locality

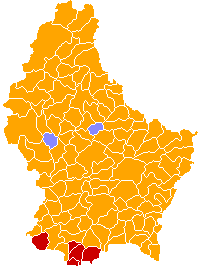
The CSV (orange) won pluralities in almost all communes in the country, limiting the success of the LSAP (red) and DP (light blue).

The CSV won pluralities in all four districts; in the previous election, the Democratic Party had won a plurality in Centre. However, the CSV won a better-than-average increase in their vote share in Luxembourg City (of 7.4%) and Centre generally (7.5%), wiping out the DP's advantage and winning 2 deputies in that circonscription alone. The CSV's vote remaining roughly constant across all circonscriptions (in all cases between 35.5% and 38.6%):

CSV LSAP DP Greens ADR The Left KPL FPL
Centre 35.5% 18.8% 21.3% 13.6% 7.9% 2.0% 0.9% 0.0%
Est 38.6% 16.5% 19.1% 12.1% 12.3% 1.3% 0.0% 0.0%
Nord 36.3% 15.8% 20.2% 10.9% 14.7% 1.3% 0.0% 0.7%
Sud 35.6% 32.2% 9.5% 10.2% 8.4% 2.3% 1.7% 0.0%

The CSV won pluralities across almost all of the country, winning more votes than any other party in 111 of the country's (then) 118 communes. The LSAP won pluralities in five communes in the industrial Red Lands: Differdange, Dudelange, Kayl, Rumelange, Schifflange. The DP won the northern communes of Schieren and Préizerdaul.[2]

References

  1. ^ Dieter Nohlen & Philip Stöver (2010) Elections in Europe: A data handbook, p1244 ISBN 978-3-8329-5609-7
  2. ^ "Répartition des suffrages en % du total des voix exprimés par parti et par commune 1994-2004" (in French). Statec. 15 October 2004. Retrieved 2008-03-01.
This page was last edited on 10 October 2023, at 20:47
Basis of this page is in Wikipedia. Text is available under the CC BY-SA 3.0 Unported License. Non-text media are available under their specified licenses. Wikipedia® is a registered trademark of the Wikimedia Foundation, Inc. WIKI 2 is an independent company and has no affiliation with Wikimedia Foundation.