
| |||||||||||||||||||||
One third of seats to Bassetlaw District Council (16 seats) 25 seats needed for a majority | |||||||||||||||||||||
|---|---|---|---|---|---|---|---|---|---|---|---|---|---|---|---|---|---|---|---|---|---|
| Turnout | 42.1% | ||||||||||||||||||||
| |||||||||||||||||||||
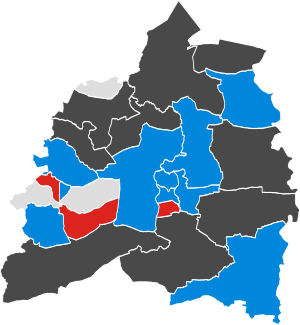 No election Colours denote the winning party, as shown in the main table of results. | |||||||||||||||||||||
| |||||||||||||||||||||
The 2004 Bassetlaw District Council election took place on 10 June 2004 to elect members of Bassetlaw District Council in Nottinghamshire, England as part of the 2004 United Kingdom local elections. One third of the council was up for election.
YouTube Encyclopedic
-
1/1Views:1 076
-
Boosting the delivery of the Maternity Support Worker – Webinar
Transcription
Election result
The Conservative Party won a majority of seats in the election and the Labour Party lost control of the council for the first time since 1976. Following the election, the council was under no overall control as no single party held a majority, with the Conservatives one seat short of a majority.
| Overall result | ||||
|---|---|---|---|---|
| Party | Seats (2000) |
Seats (Council) |
Seats (Change) | |
| Conservative | 10 | 24 | +5 | |
| Labour | 3 | 18 | -7 | |
| Liberal Democrats | 0 | 1 | -1 | |
| Independent | 3 | 5 | +3 | |
| Registered electors | 67,177 | |||
| Votes cast | 28,266 | |||
| Turnout | 42.1% | |||
Ward results
Beckingham
| Party | Candidate | Votes | % | ±% | |
|---|---|---|---|---|---|
| Conservative | Kenneth Bullivant | 610 | 67.5% | ||
| Labour | Joan Sanger | 294 | 32.5% | ||
| Turnout | 904 | 51.8% | |||
| Registered electors | 1,768 | ||||
Carlton
| Party | Candidate | Votes | % | ±% | |
|---|---|---|---|---|---|
| Conservative | Valerie Bowles | 1,039 | 50.3% | ||
| Labour | William Walters | 1,027 | 49.7% | ||
| Turnout | 2,066 | 45.5% | |||
| Registered electors | 4,605 | ||||
Clayworth
| Party | Candidate | Votes | % | ±% | |
|---|---|---|---|---|---|
| Conservative | Kathleen Sutton | 702 | 81.5% | ||
| Labour | Gillian Freeman | 159 | 18.5% | ||
| Turnout | 861 | 55.2% | |||
| Registered electors | 1,582 | ||||
East Retford East
| Party | Candidate | Votes | % | ±% | |
|---|---|---|---|---|---|
| Conservative | Michael Quigley | 1,346 | 55.4% | ||
| Labour | Pamela Skelding | 646 | 26.6% | ||
| Liberal Democrats | Lawrence Hudson | 437 | 18.0% | ||
| Turnout | 2,426 | 46.0% | |||
| Registered electors | 5,308 | ||||
East Retford North
| Party | Candidate | Votes | % | ±% | |
|---|---|---|---|---|---|
| Conservative | Anthony Tromans | 1,084 | 51.9% | ||
| Labour | James Napier | 1,006 | 48.1% | ||
| Turnout | 2,090 | 44.8% | |||
| Registered electors | 4,716 | ||||
East Retford South
| Party | Candidate | Votes | % | ±% | |
|---|---|---|---|---|---|
| Labour | Lionel Skelding | 746 | 56.5% | ||
| Conservative | Andrew Dibb | 575 | 43.5% | ||
| Turnout | 1,321 | 41.4% | |||
| Registered electors | 3,259 | ||||
East Retford West
| Party | Candidate | Votes | % | ±% | |
|---|---|---|---|---|---|
| Conservative | Perry Offer | 575 | 46.0% | ||
| Labour | James Anderson | 399 | 31.9% | ||
| Liberal Democrats | Tegfryn Davies | 276 | 22.1% | ||
| Turnout | 1,250 | 39.1% | |||
| Registered electors | 3,212 | ||||
Harworth
| Party | Candidate | Votes | % | ±% | |
|---|---|---|---|---|---|
| Independent | Sharon Randall | 1,137 | 53.4% | ||
| Labour | Keith Muskett | 993 | 46.6% | ||
| Turnout | 2,130 | 37.8% | |||
| Registered electors | 5,662 | ||||
Sutton
| Party | Candidate | Votes | % | ±% | |
|---|---|---|---|---|---|
| Conservative | Elizabeth Yates | 572 | 75.1% | ||
| Liberal Democrats | Geoffrey Chapman | 190 | 24.9% | ||
| Turnout | 762 | 48.1% | |||
| Registered electors | 1,594 | ||||
Tuxford and Trent
| Party | Candidate | Votes | % | ±% | |
|---|---|---|---|---|---|
| Conservative | Michael Jenkins | 675 | 46.8% | ||
| Labour | Albert Hunt | 407 | 28.2% | ||
| Liberal Democrats | Peter Lock | 362 | 25.1% | ||
| Turnout | 1,444 | 45.8% | |||
| Registered electors | 3,181 | ||||
Worksop East
| Party | Candidate | Votes | % | ±% | |
|---|---|---|---|---|---|
| Independent | Geoffrey Coe | 1,204 | 54.9% | ||
| Labour | James Elliott | 988 | 45.1% | ||
| Turnout | 2,192 | 43.8% | |||
| Registered electors | 5,053 | ||||
Worksop North
| Party | Candidate | Votes | % | ±% | |
|---|---|---|---|---|---|
| Labour | Allan Makeman | 1,283 | 53.7% | ||
| Conservative | Christopher Wanless | 1,105 | 46.3% | ||
| Turnout | 2,388 | 39.6% | |||
| Registered electors | 6,117 | ||||
Worksop North East
| Party | Candidate | Votes | % | ±% | |
|---|---|---|---|---|---|
| Conservative | William Graham | 1,156 | 50.1% | ||
| Labour | David Walsh | 1,153 | 49.9% | ||
| Turnout | 2,309 | 46.0% | |||
| Registered electors | 5,130 | ||||
Worksop North West
| Party | Candidate | Votes | % | ±% | |
|---|---|---|---|---|---|
| Independent | Ivor Jones | 1,166 | 57.9% | ||
| Labour | Glynn Gilfoyle | 849 | 42.1% | ||
| Turnout | 2,015 | 38.9% | |||
| Registered electors | 5,277 | ||||
Worksop South
| Party | Candidate | Votes | % | ±% | |
|---|---|---|---|---|---|
| Conservative | Michael Bennett | 1,628 | 70.0% | ||
| Labour | Roger Dyas-Elliott | 697 | 30.0% | ||
| Turnout | 2,325 | 45.1% | |||
| Registered electors | 5,265 | ||||
Worksop South East
| Party | Candidate | Votes | % | ±% | |
|---|---|---|---|---|---|
| Labour | John Shephard | 1,281 | 71.9% | ||
| Conservative | Carole Mangham | 502 | 28.1% | ||
| Turnout | 1,783 | 33.4% | |||
| Registered electors | 5,448 | ||||