
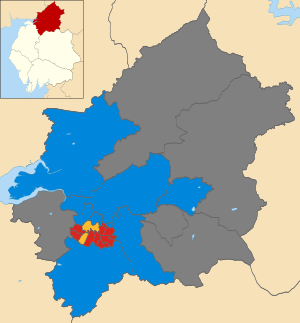
The 2002 Carlisle City Council election took place on 2 May 2002 to elect members of Carlisle District Council in Cumbria, England. One third of the council was up for election and the Conservative Party stayed in overall control of the council.[1]
After the election, the composition of the council was:
- Conservative 27
- Labour 18
- Liberal Democrats 5
- Independent 2[1]
Election result
The Conservatives retained a majority on the council, despite losing 2 seats to Labour.[2] Overall turnout at the election was 31.7%.[3]
| Party | Seats | Gains | Losses | Net gain/loss | Seats % | Votes % | Votes | +/− | |
|---|---|---|---|---|---|---|---|---|---|
| Labour | 8 | +2 | 47.1 | 43.9 | 9,850 | ||||
| Conservative | 7 | -2 | 41.2 | 42.9 | 9,627 | ||||
| Liberal Democrats | 2 | 0 | 11.8 | 11.0 | 2,471 | ||||
| Independent | 0 | 0 | 0 | 2.1 | 468 | ||||
| Legalise Cannabis | 0 | 0 | 0 | 0.1 | 26 | ||||
Ward results
| Party | Candidate | Votes | % | ±% | |
|---|---|---|---|---|---|
| Conservative | Sandra Fisher | 936 | 60.3 | ||
| Labour | Roger Horne | 617 | 39.7 | ||
| Majority | 319 | 20.5 | |||
| Turnout | 1,553 | ||||
| Party | Candidate | Votes | % | ±% | |
|---|---|---|---|---|---|
| Labour | Kenneth Rutherford | 574 | 48.4 | ||
| Conservative | Neville Lishman | 450 | 37.9 | ||
| Liberal Democrats | Olwyn Luckley | 137 | 11.5 | ||
| Legalise Cannabis | Colin Paisley | 26 | 2.2 | ||
| Majority | 124 | 10.4 | |||
| Turnout | 1,187 | ||||
| Party | Candidate | Votes | % | ±% | |
|---|---|---|---|---|---|
| Labour | Anne Glendinning | 761 | 63.1 | ||
| Conservative | Teresa Cartner | 445 | 36.9 | ||
| Majority | 316 | 26.2 | |||
| Turnout | 1,206 | ||||
| Party | Candidate | Votes | % | ±% | |
|---|---|---|---|---|---|
| Conservative | Michael Mitchelson | 744 | 71.1 | ||
| Labour | John Hale | 302 | 28.9 | ||
| Majority | 442 | 42.3 | |||
| Turnout | 1,046 | ||||
| Party | Candidate | Votes | % | ±% | |
|---|---|---|---|---|---|
| Liberal Democrats | John Guest | 549 | 49.1 | ||
| Labour | Thomas Johnson | 373 | 33.4 | ||
| Conservative | Clark Vasay | 195 | 17.5 | ||
| Majority | 176 | 15.8 | |||
| Turnout | 1,117 | ||||
| Party | Candidate | Votes | % | ±% | |
|---|---|---|---|---|---|
| Labour | Heather Bradley | 817 | 77.7 | ||
| Conservative | Teresa Preston | 235 | 22.3 | ||
| Majority | 582 | 55.3 | |||
| Turnout | 1,052 | ||||
| Party | Candidate | Votes | % | ±% | |
|---|---|---|---|---|---|
| Conservative | Lucy Crookdale | 766 | 48.4 | ||
| Liberal Democrats | Trevor Allison | 537 | 33.9 | ||
| Labour | Raymond Warwick | 281 | 17.7 | ||
| Majority | 229 | 14.5 | |||
| Turnout | 1,584 | ||||
| Party | Candidate | Votes | % | ±% | |
|---|---|---|---|---|---|
| Labour | Paul Atkinson | 833 | 67.5 | ||
| Conservative | Anthony Fontes | 217 | 17.6 | ||
| Liberal Democrats | Allan Stevenson | 184 | 14.9 | ||
| Majority | 616 | 49.9 | |||
| Turnout | 1,234 | ||||
| Party | Candidate | Votes | % | ±% | |
|---|---|---|---|---|---|
| Labour | Joseph Weedall | 868 | 62.1 | ||
| Conservative | Michelle Gwillim | 529 | 37.9 | ||
| Majority | 339 | 24.3 | |||
| Turnout | 1,397 | ||||
| Party | Candidate | Votes | % | ±% | |
|---|---|---|---|---|---|
| Conservative | Raynor Bloxham | 528 | 59.2 | ||
| Labour | Robert Dodds | 364 | 40.8 | ||
| Majority | 164 | 18.4 | |||
| Turnout | 892 | ||||
| Party | Candidate | Votes | % | ±% | |
|---|---|---|---|---|---|
| Liberal Democrats | John Farmer | 907 | 51.0 | ||
| Labour | Grant Warwick | 691 | 38.8 | ||
| Conservative | Henry Stordy | 182 | 10.2 | ||
| Majority | 216 | 12.1 | |||
| Turnout | 1,780 | ||||
| Party | Candidate | Votes | % | ±% | |
|---|---|---|---|---|---|
| Labour | Anne Quilter | 881 | 59.8 | ||
| Conservative | John Lee | 593 | 40.2 | ||
| Majority | 288 | 19.5 | |||
| Turnout | 1,474 | ||||
| Party | Candidate | Votes | % | ±% | |
|---|---|---|---|---|---|
| Conservative | Marilyn Bowman | 803 | 77.6 | ||
| Labour | Alex Faulds | 232 | 22.4 | ||
| Majority | 571 | 55.2 | |||
| Turnout | 1,035 | ||||
| Party | Candidate | Votes | % | ±% | |
|---|---|---|---|---|---|
| Conservative | Elizabeth Mallinson | 1,126 | 65.8 | ||
| Labour | Keith Aitken | 585 | 34.2 | ||
| Majority | 541 | 31.6 | |||
| Turnout | 1,711 | ||||
| Party | Candidate | Votes | % | ±% | |
|---|---|---|---|---|---|
| Labour | David Wilson | 942 | 69.2 | ||
| Conservative | Richard Hyslop | 419 | 30.8 | ||
| Majority | 523 | 38.4 | |||
| Turnout | 1,361 | ||||
| Party | Candidate | Votes | % | ±% | |
|---|---|---|---|---|---|
| Conservative | Donald Joscelyne | 751 | 61.6 | ||
| Independent | Robert Wickings | 468 | 38.4 | ||
| Majority | 283 | 23.2 | |||
| Turnout | 1,219 | ||||
| Party | Candidate | Votes | % | ±% | |
|---|---|---|---|---|---|
| Labour | George Stothard | 729 | 45.7 | ||
| Conservative | Elizabeth Blackadder | 708 | 44.4 | ||
| Liberal Democrats | Raymond Langstone | 157 | 9.8 | ||
| Majority | 21 | 1.3 | |||
| Turnout | 1,594 | ||||
References
- ^ a b "Carlisle". BBC News Online. Retrieved 28 November 2011.
- ^ "BNP shock for North". BBC News Online. 3 May 2002. Retrieved 28 November 2011.
- ^ "2003 facts and figures" (PDF). Carlisle City Council. Archived from the original (PDF) on 4 March 2016. Retrieved 28 November 2011.
- ^ a b c d e f g h i j k l m n o p q r "Carlisle". Local Elections Archive Project. Retrieved 28 November 2011.
- ^ "Local Elections in England: 2 May 2002" (PDF). House of Commons Library. Retrieved 28 November 2011.