
| |||||||||||||||||||||||||||||||||||||||||||||
52 seats of the Nova Scotia House of Assembly 27 seats were needed for a majority | |||||||||||||||||||||||||||||||||||||||||||||
|---|---|---|---|---|---|---|---|---|---|---|---|---|---|---|---|---|---|---|---|---|---|---|---|---|---|---|---|---|---|---|---|---|---|---|---|---|---|---|---|---|---|---|---|---|---|
| Turnout | 68.12% | ||||||||||||||||||||||||||||||||||||||||||||
| |||||||||||||||||||||||||||||||||||||||||||||
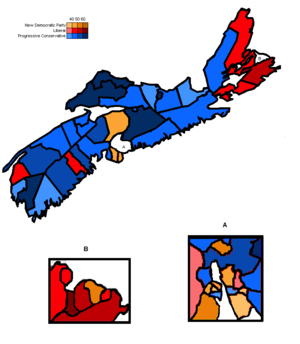 Riding map of Nova Scotia showing winning parties | |||||||||||||||||||||||||||||||||||||||||||||
| |||||||||||||||||||||||||||||||||||||||||||||


The 1999 Nova Scotia general election was held on July 27, 1999, to elect members of the 58th House of Assembly of the Province of Nova Scotia, Canada. The government was defeated on a money bill on June 18, and the Nova Scotia House of Assembly was dissolved by Lieutenant Governor James Kinley. It was won by the Progressive Conservative party, led by Dr. John Hamm. They received a majority of 30 seats compared to 11 seats by the NDP and 11 by the Liberals.
Campaign
The Halifax Daily News ran an article which asked each party leader personal questions, including one about whether the candidate had ever been convicted of a criminal offence. NDP Leader Robert Chisholm said no in response, however, several days later it was revealed that Chisholm had a past criminal record for driving under the influence of alcohol when he was 19 years old. Chisholm claimed that he lied because he did not want his daughter to find out about his past.[2]
Results
Results by party
| 30 | 11 | 11 |
| Progressive Conservative | New Democratic | Liberal |
| Party | Party leader | # of candidates |
Seats | Popular vote | ||||||
|---|---|---|---|---|---|---|---|---|---|---|
| 1998 | Dissolution | Elected | Change | # | % | Change (pp) | ||||
| Progressive Conservative | John Hamm | 52 | 14 | 13 | 30 | +16 | 169,383 | 38.93% | +9.33% | |
| New Democratic | Robert Chisholm | 52 | 19 | 19 | 11 | -8 | 129,474 | 29.76% | -4.67% | |
| Liberal | Russell MacLellan | 52 | 19 | 19 | 11 | -8 | 128,795 | 29.60% | -5.50% | |
| Nova Scotia Party | Jack Friis | 17 | 0 | 0 | 0 | 0 | 3,153 | 0.72% | – | |
| Independent | 5 | 0 | 1 | 0 | 0 | 1,278 | 0.29% | 0.00% | ||
| Vacant | 0 | |||||||||
| Total valid votes | 432,083 | 99.31% | +0.12% | |||||||
| Blank and invalid ballots | 2,983 | 0.69% | +0.12% | |||||||
| Total | 178 | 52 | 52 | 52 | – | 435,066 | 100.00% | – | ||
| Registered voters / turnout | 638,655 | 68.12% | -1.35% | |||||||
Results by region
| Party name | HRM | C.B. | Valley | S. Shore | Fundy | Central | Total | ||
|---|---|---|---|---|---|---|---|---|---|
| Parties winning seats in the legislature: | |||||||||
| Progressive Conservative | Seats: | 7 | 1 | 6 | 6 | 5 | 5 | 30 | |
| Popular vote: | 36.64% | 17.26% | 48.06% | 46.24% | 55.96% | 46.00% | 38.93% | ||
| New Democratic Party | Seats: | 9 | 1 | — | — | 1 | — | 11 | |
| Popular vote: | 37.24% | 33.77% | 21.47% | 23.49% | 24.14% | 25.57% | 29.76% | ||
| Liberal | Seats: | 1 | 8 | 1 | 1 | — | — | 11 | |
| Popular vote: | 24.68% | 47.53% | 29.64% | 29.45% | 19.03% | 28.16% | 29.60% | ||
| Parties not winning seats in the legislature: | |||||||||
| Nova Scotia Party | Popular vote: | 1.35% | — | 0.83% | 0.82% | 0.21% | 0.27% | 0.72% | |
| Independents | Popular vote: | 0.09% | 1.44% | — | — | 0.66% | — | 0.29% | |
| Total seats: | 17 | 9 | 7 | 7 | 6 | 5 | 52 | ||
Retiring incumbents
- Liberal
- Laurie Montgomery, Annapolis
- Ed Lorraine, Colchester North
- Gerry Fogarty, Halifax Bedford Basin
- Francene Cosman, Bedford-Fall River
- Progressive Conservative
- Independent
Nominated candidates
Legend
bold denotes party leader
† denotes an incumbent who is not running for re-election or was defeated in nomination contest
Valley
| Electoral district | Candidates | Incumbent | ||||||||||
|---|---|---|---|---|---|---|---|---|---|---|---|---|
| Liberal | NDP | PC | Nova Scotia | Independent | ||||||||
| Annapolis | Stephen McNeil 3,265 35.22% |
Tom Clahane 1,708 18.43% |
Frank Chipman 4,026 43.43% |
Paul Mann 271 2.92% |
Laurie Montgomery † | |||||||
| Clare | Wayne Gaudet 2,705 43.76% |
Don Melanson 1,078 17.44% |
Paul Comeau 2,355 38.10% |
Anne Marie Boyer 43 0.70% |
Wayne Gaudet | |||||||
| Digby—Annapolis | Vivian O'Neil 1,550 24.09% |
Steve Downes 1,105 17.17% |
Gordon Balser 3,780 58.74% |
Gordon Balser | ||||||||
| Hants West | Joe Robertson 2,015 22.25% |
Dick Terfry 1,764 19.48% |
Ron Russell 5,276 58.27% |
Ron Russell | ||||||||
| Kings North | Peter Hill 1,975 22.42% |
Neil H. McNeil 2,513 28.53% |
Mark Parent 4,321 49.05% |
George Archibald † | ||||||||
| Kings South | Robbie Harrison 3,213 33.23% |
Mary DeWolfe 2,567 26.55% |
David Morse 3,890 40.23% |
Robbie Harrison | ||||||||
| Kings West | Don Clarke 2,346 28.70% |
Jacquie DeMestral 1,629 19.93% |
Jon Carey 4,033 49.34% |
Frances Adams 166 2.03% |
George Moody† | |||||||
South Shore
| Electoral district | Candidates | Incumbent | ||||||||||
|---|---|---|---|---|---|---|---|---|---|---|---|---|
| Liberal | NDP | PC | Nova Scotia | Independent | ||||||||
| Argyle | Karen Kravfe 820 15.55% |
Belinda Tucker 343 6.51% |
Neil LeBlanc 4,060 77.01% |
Oscar Harris 49 0.93% |
Neil LeBlanc | |||||||
| Chester—St. Margaret's | Karen Willis Duerden 1,971 21.28% |
Hinrich Bitter-Suermann 3,098 33.45% |
John Chataway 4,193 45.27% |
Hinrich Bitter-Suermann | ||||||||
| Lunenburg | Lila O'Connor 2,344 26.29% |
Marilyn B. Crook 1,982 22.23% |
Michael Baker 4,590 51.48% |
Michael Baker | ||||||||
| Lunenburg West | Don Downe 4,248 45.46% |
Eric Hustvedt 1,846 19.75% |
Jerry Swain 3,251 34.79% |
Don Downe | ||||||||
| Queens | Eddie Whitty 1,296 20.77% |
John Wiles 1,498 24.00% |
Kerry Morash 3,447 55.23% |
John Leefe † | ||||||||
| Shelburne | Clifford Huskilson 3,206 41.54% |
Dianne Nickerson 1,306 16.92% |
Cecil O'Donnell 3,206 41.54% |
Clifford Huskilson | ||||||||
| Yarmouth | Phil DeMille 2,605 28.21% |
John Deveau 3,079 33.34% |
Richard Hurlburt 3,141 34.02% |
Brian W. Hurlburt 409 4.43% |
John Deveau | |||||||
Fundy-Northeast
| Electoral district | Candidates | Incumbent | ||||||||||
|---|---|---|---|---|---|---|---|---|---|---|---|---|
| Liberal | NDP | PC | Nova Scotia | Independent | ||||||||
| Colchester—Musquodoboit Valley | Leo Stacey 1,052 12.97% |
Jim Harpell 1,591 19.62% |
Brooke Taylor 5,465 67.40% |
Brooke Taylor | ||||||||
| Colchester North | John Davidson 2,274 27.03% |
Ralph Martin 2,411 28.66% |
Bill Langille 3,728 44.31% |
Ed Lorraine † | ||||||||
| Cumberland North | Kathy Langille 1,595 19.02% |
Doug Wilson 856 10.21% |
Ernie Fage 5,936 70.78% |
Ernie Fage | ||||||||
| Cumberland South | John Harrison 1,000 13.39% |
Scott McKee 941 12.60% |
Murray Scott 5,527 74.01% |
Murray Scott | ||||||||
| Hants East | Sara Stewart 2,150 23.33% |
John MacDonell 3,985 43.25% |
Reese Morash 3,079 33.42% |
John MacDonell | ||||||||
| Truro—Bible Hill | Matthew Graham 1,613 18.21% |
Ibel Scammell 2,499 28.21% |
Jamie Muir 4,747 53.58% |
Jamie Muir | ||||||||
Central Halifax
| Electoral district | Candidates | Incumbent | ||||||||||
|---|---|---|---|---|---|---|---|---|---|---|---|---|
| Liberal | NDP | PC | Nova Scotia | Independent | ||||||||
| Halifax Bedford Basin | Jack Hardiman 2,935 27.74% |
Errol Gaum 2,946 27.85% |
Mary Ann McGrath 4,489 42.43% |
Janice Lively 209 1.98% |
Gerry Fogarty † | |||||||
| Halifax Chebucto | Royden Trainer 2,286 27.27% |
Howard Epstein 3,159 37.69% |
Sean Phillips 2,811 33.54% |
Hilda M. Stevens 126 1.50% |
Howard Epstein | |||||||
| Halifax Citadel | Ed Kinley 2,752 29.88% |
Peter Delefes 2,958 32.11% |
Jane Purves 3,392 36.83% |
Grace Patterson 52 0.56% |
Art Canning 57 0.62% |
Peter Delefes | ||||||
| Halifax Fairview | Greta Murtagh 1,888 24.15% |
Eileen O'Connell 3,615 46.23% |
Narayana Swamy 2,117 27.08% |
Maria Alexandridis 199 2.55% |
Eileen O'Connell | |||||||
| Halifax Needham | Mike Rogers 1,970 25.12% |
Maureen MacDonald 3,525 44.95% |
Linda Carvery 2,185 27.86% |
Scott Higgins 162 2.07% |
Maureen MacDonald | |||||||
Suburban Halifax
| Electoral district | Candidates | Incumbent | ||||||||||
|---|---|---|---|---|---|---|---|---|---|---|---|---|
| Liberal | NDP | PC | Nova Scotia | Independent | ||||||||
| Bedford—Fall River | Gerry St. Armand 2,197 19.17% |
Jane Earle 2,700 23.55% |
Peter Christie 6,566 57.28% |
Francene Cosman † | ||||||||
| Halifax Atlantic | David Melnick 1,458 16.53% |
Robert Chisholm 4,266 48.37% |
Bruce Cooke 2,794 31.68% |
Gerald Rodgers 234 2.65% |
Golda M. Redden 68 0.77% |
Robert Chisholm | ||||||
| Sackville—Beaver Bank | Bill MacDonald 2,276 25.86% |
Rosemary Godin 2,951 33.53% |
Barry Barnet 3,573 40.60% |
Rosemary Godin | ||||||||
| Sackville—Cobequid | Kevin Perkins 1,235 14.59% |
John Holm 4,787 56.57% |
Wade Marshall 2,440 28.83% |
John Holm | ||||||||
| Timberlea—Prospect | Vicki Brown 2,171 23.34% |
Bill Estabrooks 4,356 46.83% |
Ken Fralick 2,600 27.95% |
Ken Bumstead 174 1.87% |
Bill Estabrooks | |||||||
Dartmouth/Cole Harbour/Eastern Shore
| Electoral district | Candidates | Incumbent | ||||||||||
|---|---|---|---|---|---|---|---|---|---|---|---|---|
| Liberal | NDP | PC | Nova Scotia | Independent | ||||||||
| Cole Harbour—Eastern Passage | Colin MacEachern 2,216 23.39% |
Kevin Deveaux 3,721 39.27% |
Nadune Cooper Mont 3,539 37.35% |
Kevin Deveaux | ||||||||
| Dartmouth—Cole Harbour | Peter Foy 2,150 25.79% |
Darrell Dexter 3,164 37.95% |
Greg Frampton 2,750 32.98% |
Rufus Peacock 274 3.29% |
Darrell Dexter | |||||||
| Dartmouth East | Jim Smith 2,975 37.39% |
Heather Henderson 2,272 28.55% |
Terry Degen 2,710 34.06% |
Jim Smith | ||||||||
| Dartmouth North | Frank Cameron 1,746 24.74% |
Jerry Pye 3,105 44.01% |
Jane MacKay 2,060 29.20% |
Susan Livingstone 145 2.05% |
Jerry Pye | |||||||
| Dartmouth South | Audrey Goodyer 2,322 25.83% |
Don Chard 3,011 33.50% |
Tim Olive 3,656 40.67% |
Don Chard | ||||||||
| Eastern Shore | Keith Colwell 2,695 31.01% |
Mary-Alice Tzagarakis 1,970 22.67% |
Bill Dooks 3,637 41.85% |
Jack Friis 388 4.46% |
Keith Colwell | |||||||
| Preston | Wendell Thomas 509 13.38% |
Yvonne Atwell 1,496 39.32% |
David Hendsbee 1,800 47.31% |
Yvonne Atwell | ||||||||
Central Nova
| Electoral district | Candidates | Incumbent | ||||||||||
|---|---|---|---|---|---|---|---|---|---|---|---|---|
| Liberal | NDP | PC | Nova Scotia | Independent | ||||||||
| Antigonish | Hyland Fraser 4,058 39.18% |
Charlene Long 2,229 21.52% |
Angus MacIsaac 4,070 39.30% |
Hyland Fraser | ||||||||
| Guysborough—Port Hawkesbury | Ray White 3,151 40.19% |
Wendy Panagopoulos 1,267 16.16% |
Ron Chisholm 3,285 41.90% |
Ray White | ||||||||
| Pictou Centre | Marie Maxwell 1,171 13.78% |
Jeff Callaghan 1,850 21.76% |
John Hamm 5,479 64.46% |
John Hamm | ||||||||
| Pictou East | Lynn MacDonald 1,285 15.76% |
Andy Thompson 2,388 29.30% |
Jim DeWolfe 4,478 54.94% |
Jim DeWolfe | ||||||||
| Pictou West | Paul Landry 2,109 25.47% |
Charlie Parker 2,955 35.69% |
Muriel Baillie 3,102 37.46% |
D. Ed Berringer 114 1.38% |
Charlie Parker | |||||||
Cape Breton
| Electoral district | Candidates | Incumbent | ||||||||||
|---|---|---|---|---|---|---|---|---|---|---|---|---|
| Liberal | NDP | PC | Nova Scotia | Independent | ||||||||
| Cape Breton Centre | Susan Deruelle Marsh 2,985 39.94% |
Frank Corbett 4,042 54.09% |
John Morrissey 446 5.97% |
Frank Corbett | ||||||||
| Cape Breton East | Dave Wilson 3,704 40.12% |
Cecil Saccary 3,699 40.06% |
Brad Kerr 1,043 11.30% |
Gerard Burke 787 8.52% |
Reeves Matheson † | |||||||
| Cape Breton North | Russell MacLellan 4,222 48.69% |
Archie MacKinnon 2,587 29.83% |
Murray Johnston 1,863 21.48% |
Russell MacLellan | ||||||||
| Cape Breton Nova | Paul MacEwan 4,004 53.44% |
Gordie Gosse 3,253 43.42% |
Harold Dorrington 235 3.14% |
Paul MacEwan | ||||||||
| Cape Breton South | Manning MacDonald 5,356 62.90% |
Elizabeth Cusack 2,451 28.78% |
Leland Lewis 708 8.31% |
Manning MacDonald | ||||||||
| Cape Breton—The Lakes | Brian Boudreau 3,715 43.70% |
Helen MacDonald 3,614 42.51% |
Ken Langley 1,173 13.80% |
Helen MacDonald | ||||||||
| Cape Breton West | Russell MacKinnon 5,094 51.83% |
Brian Slaney 3,359 34.18% |
Joe Boudreau 1,375 13.99% |
Russell MacKinnon | ||||||||
| Inverness | Charlie MacDonald 3,549 39.27% |
Roy Yipp 1,612 17.84% |
Rodney MacDonald 3,876 42.89% |
Charlie MacDonald | ||||||||
| Richmond | Michel Samson 3,105 47.01% |
Wilma Conrod 1,595 24.15% |
Joseph MacPhee 1,905 28.84% |
Michel Samson | ||||||||
| Victoria | Kennie MacAskill 2,263 49.46% |
Nancy MacKeigan 772 16.87% |
Anna Curtis-Steele 1,174 25.66% |
Osborne Burke 229 5.01% Stemer MacLeod 137 2.99% |
Kennie MacAskill | |||||||
See also
References
- ^ 4 April 2000 deferred by-election for Cape Breton East seat, won by Liberal candidate
- ^ "Chisholm admits to drunk driving conviction". CBC News. July 23, 1996. Retrieved October 28, 2023.
- ^ "Summary, by Political Affiliation of Valid Votes Cast and Candidates Elected Provincial General Elections, 1960-1999" (PDF). Elections Nova Scotia. Retrieved November 11, 2021.
- ^ "Elections Returns 1999 Recapitulation" (PDF). Elections Nova Scotia. Retrieved November 11, 2021.
- Government of Nova Scotia. "Summary Results from 1867 to 2011" (PDF). Elections Statistics. Elections Nova Scotia. Archived from the original (PDF) on October 3, 2013. Retrieved October 1, 2013.
External links
- Elections Nova Scotia
- Halifax Herald 1999 election website via Internet Archive.
| General elections | |
|---|---|
| Municipal elections | |
| Referendums | |
See also: List of Nova Scotia by-elections | |