
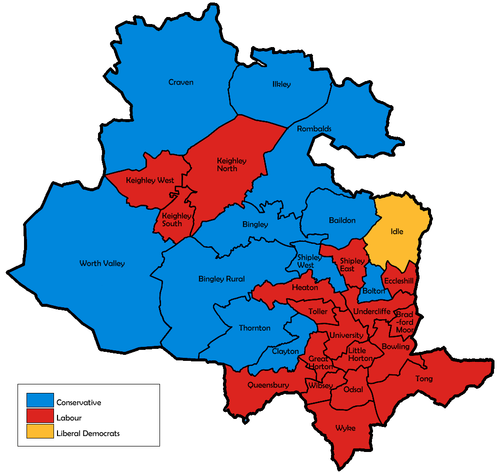
The City of Bradford Metropolitan District Council elections were held on Thursday, 2 May 1991, with one third of the council up for election. Labour retained control of the council.[1][2]
YouTube Encyclopedic
-
1/3Views:2 01683525 457
-
LBCCD - Board of Trustees Meeting - June 24, 2020
-
LBCCD - Board Meeting - February 27, 2019, Part 2
-
Ontario Votes 2018: Election Night
Transcription
Election result
| Party | Seats | Gains | Losses | Net gain/loss | Seats % | Votes % | Votes | +/− | |
|---|---|---|---|---|---|---|---|---|---|
| Labour | 18 | 6 | 0 | 60.0 | 43.8 | 66,373 | -6.6% | ||
| Conservative | 11 | 1 | 7 | 36.7 | 38.6 | 58,449 | +2.5% | ||
| Liberal Democrats | 1 | 1 | 1 | 3.3 | 15.2 | 23,049 | +6.1% | ||
| Green | 0 | 0 | 0 | 0.0 | 2.3 | 3,440 | -1.7% | ||
| Independent | 0 | 0 | 0 | 0.0 | 0.1 | 145 | -0.3% | ||
| Communist | 0 | 0 | 0 | 0.0 | 0.0 | 49 | +0.0% | ||
This result had the following consequences for the total number of seats on the council after the elections:
| Party | Previous council | New council | |||
|---|---|---|---|---|---|
| Labour | 47 | 53 | |||
| Conservatives | 41 | 35 | |||
| Liberal Democrat | 2 | 2 | |||
| Total | 90 | 90 | |||
| Working majority | 4 | 16 | |||
Ward results
| Party | Candidate | Votes | % | ±% | |
|---|---|---|---|---|---|
| Conservative | K. Poulton | 3,032 | 48.7 | +2.6 | |
| Liberal Democrats | E. Blaine | 1,492 | 23.9 | -8.4 | |
| Labour | J. Flood | 1,409 | 22.6 | +5.5 | |
| Green | C. Harris | 297 | 4.8 | +0.3 | |
| Majority | 1,540 | 24.7 | +11.0 | ||
| Turnout | 6,230 | ||||
| Conservative hold | Swing | +5.5 | |||
| Party | Candidate | Votes | % | ±% | |
|---|---|---|---|---|---|
| Conservative | N. Roper | 2,618 | 48.1 | +1.8 | |
| Labour | M. Gregory | 1,972 | 36.2 | -4.1 | |
| Liberal Democrats | S. Whitehead | 637 | 11.7 | +4.1 | |
| Green | M. Thompson | 214 | 3.9 | -1.7 | |
| Majority | 646 | 11.9 | +6.0 | ||
| Turnout | 5,441 | ||||
| Conservative hold | Swing | +2.9 | |||
| Party | Candidate | Votes | % | ±% | |
|---|---|---|---|---|---|
| Conservative | G. Smith | 2,987 | 56.2 | +2.6 | |
| Labour | G. Carey | 1,233 | 23.2 | -8.3 | |
| Liberal Democrats | M. Fielden | 801 | 15.1 | +7.6 | |
| Green | M. Love | 296 | 5.6 | -1.8 | |
| Majority | 1,754 | 33.0 | +10.9 | ||
| Turnout | 5,317 | ||||
| Conservative hold | Swing | +5.4 | |||
| Party | Candidate | Votes | % | ±% | |
|---|---|---|---|---|---|
| Conservative | F. Lee | 2,065 | 46.8 | +5.1 | |
| Liberal Democrats | J. Ward | 1,201 | 27.2 | +16.4 | |
| Labour | M. Yaqoob | 1,142 | 25.9 | -21.5 | |
| Majority | 864 | 19.6 | +14.0 | ||
| Turnout | 4,408 | ||||
| Conservative hold | Swing | -5.6 | |||
| Party | Candidate | Votes | % | ±% | |
|---|---|---|---|---|---|
| Labour | M. Qureshi | 2,379 | 55.4 | -18.6 | |
| Conservative | B. Moore | 972 | 22.6 | +5.1 | |
| Liberal Democrats | J. Collins | 945 | 22.0 | +13.6 | |
| Majority | 1,407 | 32.8 | -23.7 | ||
| Turnout | 4,296 | ||||
| Labour hold | Swing | -11.8 | |||
| Party | Candidate | Votes | % | ±% | |
|---|---|---|---|---|---|
| Labour | B. Singh | 2,669 | 67.1 | -11.9 | |
| Conservative | H. Ibbotson | 621 | 15.6 | +1.7 | |
| Liberal Democrats | H. Middleton | 516 | 13.0 | +13.0 | |
| Green | I. Davis | 172 | 4.3 | -2.8 | |
| Majority | 2,048 | 51.5 | -13.6 | ||
| Turnout | 3,978 | ||||
| Labour hold | Swing | -6.8 | |||
| Party | Candidate | Votes | % | ±% | |
|---|---|---|---|---|---|
| Conservative | R. Farley | 2,772 | 51.6 | +6.3 | |
| Labour | P. Chippendale | 2,162 | 40.3 | -7.0 | |
| Liberal Democrats | K. Margison | 433 | 8.1 | +8.1 | |
| Majority | 610 | 11.4 | +9.4 | ||
| Turnout | 5,367 | ||||
| Conservative hold | Swing | +6.6 | |||
| Party | Candidate | Votes | % | ±% | |
|---|---|---|---|---|---|
| Conservative | D. Harrison | 2,925 | 51.9 | +4.7 | |
| Liberal Democrats | J. Brooksbank | 1,277 | 22.6 | +4.4 | |
| Labour | M. Newton | 1,224 | 21.7 | -7.5 | |
| Green | G. Lambert | 212 | 3.8 | +3.8 | |
| Majority | 1,648 | 29.2 | +11.2 | ||
| Turnout | 5,638 | ||||
| Conservative gain from Liberal Democrats | Swing | +0.1 | |||
| Party | Candidate | Votes | % | ±% | |
|---|---|---|---|---|---|
| Labour | G. Midwood | 2,245 | 50.1 | -4.9 | |
| Conservative | B. Larkin | 1,565 | 34.9 | +4.0 | |
| Liberal Democrats | M. Attenborough | 669 | 14.9 | +5.4 | |
| Majority | 680 | 15.2 | -8.9 | ||
| Turnout | 4,479 | ||||
| Labour gain from Conservative | Swing | -4.4 | |||
| Party | Candidate | Votes | % | ±% | |
|---|---|---|---|---|---|
| Labour | J. Godward | 2,567 | 52.5 | -5.4 | |
| Conservative | M. Crabtree | 1,745 | 35.7 | +3.1 | |
| Liberal Democrats | M. Egan | 424 | 8.7 | +8.7 | |
| Green | M. Knott | 152 | 3.1 | -6.4 | |
| Majority | 822 | 16.8 | -8.6 | ||
| Turnout | 4,888 | ||||
| Labour hold | Swing | -4.2 | |||
| Party | Candidate | Votes | % | ±% | |
|---|---|---|---|---|---|
| Labour | L. Maguire | 2,891 | 47.7 | -4.2 | |
| Conservative | C. Hobson | 2,557 | 42.2 | +2.9 | |
| Liberal Democrats | M. Margison | 455 | 7.5 | +7.5 | |
| Green | K. Warnes | 154 | 2.5 | -6.2 | |
| Majority | 334 | 5.5 | -7.1 | ||
| Turnout | 6,057 | ||||
| Labour gain from Conservative | Swing | -3.5 | |||
| Party | Candidate | Votes | % | ±% | |
|---|---|---|---|---|---|
| Liberal Democrats | C. Hare | 2,400 | 43.9 | +13.6 | |
| Conservative | H. Lycett | 1,731 | 31.7 | +0.4 | |
| Labour | T. Britton | 1,336 | 24.4 | -12.5 | |
| Majority | 669 | 12.2 | +6.5 | ||
| Turnout | 5,467 | ||||
| Liberal Democrats gain from Conservative | Swing | +6.4 | |||
| Party | Candidate | Votes | % | ±% | |
|---|---|---|---|---|---|
| Conservative | B. Smith | 3,415 | 61.8 | +7.2 | |
| Labour | K. Best | 1,185 | 21.5 | -1.9 | |
| Liberal Democrats | P. Cheney | 922 | 16.7 | +4.0 | |
| Majority | 2,230 | 40.4 | +9.1 | ||
| Turnout | 5,522 | ||||
| Conservative hold | Swing | +4.5 | |||
| Party | Candidate | Votes | % | ±% | |
|---|---|---|---|---|---|
| Labour | M. Slater | 2,762 | 46.3 | -2.2 | |
| Conservative | A. Henderson | 2,403 | 40.3 | +2.8 | |
| Liberal Democrats | J. Beaumont | 615 | 10.3 | +3.1 | |
| Green | M. Crowson | 182 | 3.0 | -3.7 | |
| Majority | 359 | 6.0 | -5.1 | ||
| Turnout | 5,962 | ||||
| Labour gain from Conservative | Swing | -2.5 | |||
| Party | Candidate | Votes | % | ±% | |
|---|---|---|---|---|---|
| Labour | F. Sunderland | 2,710 | 64.8 | -7.1 | |
| Conservative | J. Maxfield | 865 | 20.7 | +3.1 | |
| Liberal Democrats | B. Salmons | 351 | 8.4 | +2.3 | |
| Independent | R. Dobson | 145 | 3.5 | +3.5 | |
| Green | L. Danson | 111 | 2.6 | -1.7 | |
| Majority | 1,845 | 44.1 | -10.3 | ||
| Turnout | 4,182 | ||||
| Labour hold | Swing | -5.1 | |||
| Party | Candidate | Votes | % | ±% | |
|---|---|---|---|---|---|
| Labour | B. Thorne | 2,843 | 52.3 | -2.3 | |
| Conservative | M. Startin | 1,839 | 33.8 | +0.5 | |
| Liberal Democrats | G. Morgan | 554 | 10.2 | +2.5 | |
| Green | W. Howe | 199 | 3.7 | -0.7 | |
| Majority | 1,004 | 18.5 | -2.7 | ||
| Turnout | 5,435 | ||||
| Labour hold | Swing | -1.4 | |||
| Party | Candidate | Votes | % | ±% | |
|---|---|---|---|---|---|
| Labour | A. Hussain | 2,383 | 64.5 | -7.2 | |
| Liberal Democrats | A. Griffiths | 696 | 18.8 | +6.0 | |
| Conservative | G. Johnson | 618 | 16.7 | +1.2 | |
| Majority | 1,687 | 45.6 | -10.5 | ||
| Turnout | 3,697 | ||||
| Labour hold | Swing | -6.6 | |||
| Party | Candidate | Votes | % | ±% | |
|---|---|---|---|---|---|
| Labour | D. Green | 2,796 | 50.9 | -4.5 | |
| Conservative | M. Riaz | 1,677 | 30.5 | -4.6 | |
| Liberal Democrats | D. Rowley | 1,019 | 18.5 | +9.1 | |
| Majority | 1,119 | 20.4 | +0.1 | ||
| Turnout | 5,492 | ||||
| Labour gain from Conservative | Swing | +0.0 | |||
| Party | Candidate | Votes | % | ±% | |
|---|---|---|---|---|---|
| Labour | J. Womersley | 2,706 | 47.3 | -7.7 | |
| Conservative | E. Sunderland | 2,309 | 40.4 | -4.6 | |
| Liberal Democrats | J. Saul | 707 | 12.4 | +12.4 | |
| Majority | 397 | 6.9 | -3.2 | ||
| Turnout | 5,722 | ||||
| Labour gain from Conservative | Swing | -1.5 | |||
| Party | Candidate | Votes | % | ±% | |
|---|---|---|---|---|---|
| Conservative | R. Wightman | 3,643 | 59.3 | +2.0 | |
| Labour | H. Gundry | 1,344 | 21.9 | -6.6 | |
| Liberal Democrats | V. Whelan | 1,155 | 18.8 | +4.6 | |
| Majority | 2,299 | 37.4 | +8.7 | ||
| Turnout | 6,142 | ||||
| Conservative hold | Swing | +4.3 | |||
| Party | Candidate | Votes | % | ±% | |
|---|---|---|---|---|---|
| Labour | R. Redfern | 2,384 | 56.6 | -10.2 | |
| Conservative | J. Carroll | 1,196 | 28.4 | +5.0 | |
| Liberal Democrats | J. Whitehead | 628 | 14.9 | +5.1 | |
| Majority | 1,188 | 28.2 | -15.2 | ||
| Turnout | 4,208 | ||||
| Labour hold | Swing | -7.6 | |||
| Party | Candidate | Votes | % | ±% | |
|---|---|---|---|---|---|
| Conservative | J. Evans | 2,669 | 43.8 | +1.7 | |
| Labour | J. Phillips | 2,390 | 39.2 | -5.0 | |
| Liberal Democrats | T. Willis | 692 | 11.4 | +4.00 | |
| Green | D. Ford | 342 | 5.6 | -0.7 | |
| Majority | 279 | 4.6 | +2.4 | ||
| Turnout | 6,093 | ||||
| Conservative hold | Swing | +3.3 | |||
| Party | Candidate | Votes | % | ±% | |
|---|---|---|---|---|---|
| Conservative | J. Buffham | 2,329 | 45.3 | +4.0 | |
| Labour | P. Wilkinson | 2,143 | 41.7 | -5.4 | |
| Liberal Democrats | H. Wright | 494 | 9.6 | +3.6 | |
| Green | P. Daniels | 177 | 3.4 | -2.3 | |
| Majority | 186 | 3.6 | -2.2 | ||
| Turnout | 5,143 | ||||
| Conservative hold | Swing | +4.7 | |||
| Party | Candidate | Votes | % | ±% | |
|---|---|---|---|---|---|
| Labour | Y. Tough | 3,064 | 60.3 | +6.1 | |
| Conservative | H. Greed | 1,430 | 28.2 | +0.2 | |
| Liberal Democrats | S. Boulton | 390 | 7.7 | -1.3 | |
| Green | P. Braham | 194 | 3.8 | +3.8 | |
| Majority | 1,634 | 32.2 | +5.9 | ||
| Turnout | 5,078 | ||||
| Labour hold | Swing | +2.9 | |||
| Party | Candidate | Votes | % | ±% | |
|---|---|---|---|---|---|
| Labour | T. Mahon | 2,066 | 65.5 | -10.7 | |
| Conservative | D. Owen | 732 | 23.2 | -0.6 | |
| Liberal Democrats | K. Robinson | 356 | 11.3 | +11.3 | |
| Majority | 1,334 | 42.3 | -10.1 | ||
| Turnout | 3,154 | ||||
| Labour hold | Swing | -5.0 | |||
| Party | Candidate | Votes | % | ±% | |
|---|---|---|---|---|---|
| Labour | D. Fairfax | 2,582 | 56.5 | -6.4 | |
| Conservative | A. Wade | 1,257 | 27.5 | +0.2 | |
| Liberal Democrats | E. Hallmann | 590 | 12.9 | +3.1 | |
| Green | S. Stepan | 139 | 3.0 | +3.0 | |
| Majority | 1,325 | 29.0 | -6.7 | ||
| Turnout | 4,568 | ||||
| Labour hold | Swing | -3.3 | |||
| Party | Candidate | Votes | % | ±% | |
|---|---|---|---|---|---|
| Labour | A. Ahmed | 3,613 | 70.9 | +3.6 | |
| Conservative | J. Austin | 728 | 14.3 | -9.5 | |
| Liberal Democrats | C. Devonshire | 400 | 7.8 | +7.8 | |
| Green | D. Stepan | 306 | 6.0 | -2.9 | |
| Communist | R. Young | 49 | 1.0 | +1.0 | |
| Majority | 2,885 | 56.6 | +13.1 | ||
| Turnout | 5,096 | ||||
| Labour hold | Swing | +6.5 | |||
| Party | Candidate | Votes | % | ±% | |
|---|---|---|---|---|---|
| Labour | R. Berry | 2,209 | 46.3 | -6.3 | |
| Conservative | J. Robertshaw | 1,727 | 36.2 | +3.5 | |
| Liberal Democrats | B. Boulton | 832 | 17.4 | +6.5 | |
| Majority | 482 | 10.1 | -9.8 | ||
| Turnout | 4,768 | ||||
| Labour gain from Conservative | Swing | -4.9 | |||
| Party | Candidate | Votes | % | ±% | |
|---|---|---|---|---|---|
| Conservative | M. Ellis | 2,402 | 47.8 | +3.8 | |
| Labour | R. Kelly | 1,701 | 33.8 | -7.3 | |
| Liberal Democrats | T. Brooksbank | 631 | 12.5 | +3.5 | |
| Green | A. Speller | 293 | 5.8 | +0.1 | |
| Majority | 701 | 13.9 | +11.1 | ||
| Turnout | 5,027 | ||||
| Conservative hold | Swing | +5.5 | |||
| Party | Candidate | Votes | % | ±% | |
|---|---|---|---|---|---|
| Labour | M. Beeley | 2,263 | 48.7 | -10.8 | |
| Conservative | V. Owen | 1,620 | 34.8 | +5.6 | |
| Liberal Democrats | S. Cawood | 767 | 16.5 | +5.2 | |
| Majority | 643 | 13.8 | -16.5 | ||
| Turnout | 4,650 | ||||
| Labour hold | Swing | -8.2 | |||
References
| Mayor | |
|---|---|
| Bradford | |
| Calderdale | |
| Kirklees | |
| Leeds |
|
| Wakefield | |
| West Yorkshire CC | |
| West Riding CC | |
| |
| Metropolitan boroughs |
|
|---|---|
| District councils (England) |
|
| District councils (Wales) |
|