
| |||||||||||||||||||||||||||||||||||||||||||||||||||||
All 79 seats of Cornwall County Council 40 seats needed for a majority | |||||||||||||||||||||||||||||||||||||||||||||||||||||
|---|---|---|---|---|---|---|---|---|---|---|---|---|---|---|---|---|---|---|---|---|---|---|---|---|---|---|---|---|---|---|---|---|---|---|---|---|---|---|---|---|---|---|---|---|---|---|---|---|---|---|---|---|---|
| |||||||||||||||||||||||||||||||||||||||||||||||||||||
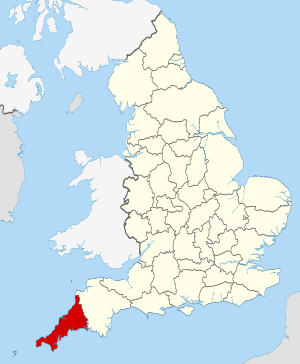 The County of Cornwall within England | |||||||||||||||||||||||||||||||||||||||||||||||||||||
| |||||||||||||||||||||||||||||||||||||||||||||||||||||
Elections to Cornwall County Council were held on 5 May 1977. The whole council of seventy-nine members was up for election and the result was that the Independents, despite losing nine seats, comfortably retained control, winning sixty-four seats. The Conservatives gained eight seats, ending as the second largest political group with thirteen, while Labour remained with only one member, the Ecology Party also won one, and (as in 1973) no one was elected as a representative of the Liberal Party.[2]
Results summary
| Party | Seats | Gains | Losses | Net gain/loss | Seats % | Votes % | Votes | +/− | |
|---|---|---|---|---|---|---|---|---|---|
| Independent | 64 | 0 | 9 | 81.0 | 67.5 | 44,050 | |||
| Conservative | 13 | 8 | 0 | 16.5 | 13.4 | 8,766 | |||
| Labour | 1 | 0 | 0 | 1.3 | 6.2 | 4,060 | |||
| Ecology | 1 | 1 | 0 | 1.3 | 1.5 | 967 | New | ||
| Liberal | 0 | 0 | 0 | 0.0 | 4.0 | 2,636 | |||
| Mebyon Kernow | 0 | 0 | 0 | 0.0 | 2.7 | 1,736 | New | ||
| Ind. Conservative | 0 | 0 | 0 | 0.0 | 1.5 | 958 | New | ||
| CARE | 0 | 0 | 0 | 0.0 | 1.2 | 806 | New | ||
| Independent Labour | 0 | 0 | 0 | 0.0 | 0.9 | 569 | New | ||
| National Front | 0 | 0 | 0 | 0.0 | 0.7 | 465 | New | ||
| Residents | 0 | 0 | 0 | 0.0 | 0.4 | 223 | New | ||
References
- ^ "Local Election Summaries 1977". The Elections Centre. Retrieved 21 June 2019.
- ^ a b 'Conservatives triumph in Greater London and metropolitan counties' in The Times of London, issue 59997 dated 7 May 1977, p. 3
| County councils (England) |
|
|---|---|
| County councils (Wales) |
|
| Unicameral area | |
| District councils (Scotland) |
|
| District councils (Northern Ireland) | |
| Sui generis |
|
| Cornwall Council | |
|---|---|
| Council of the Isles of Scilly | |
| Caradon District Council |
|
| Carrick District Council |
|
| Kerrier District Council |
|
| North Cornwall District Council |
|
| Penwith District Council | |
| Restormel Borough Council | |
| |
This Cornwall article is a stub. You can help Wikipedia by expanding it. |
This United Kingdom election-related article is a stub. You can help Wikipedia by expanding it. |